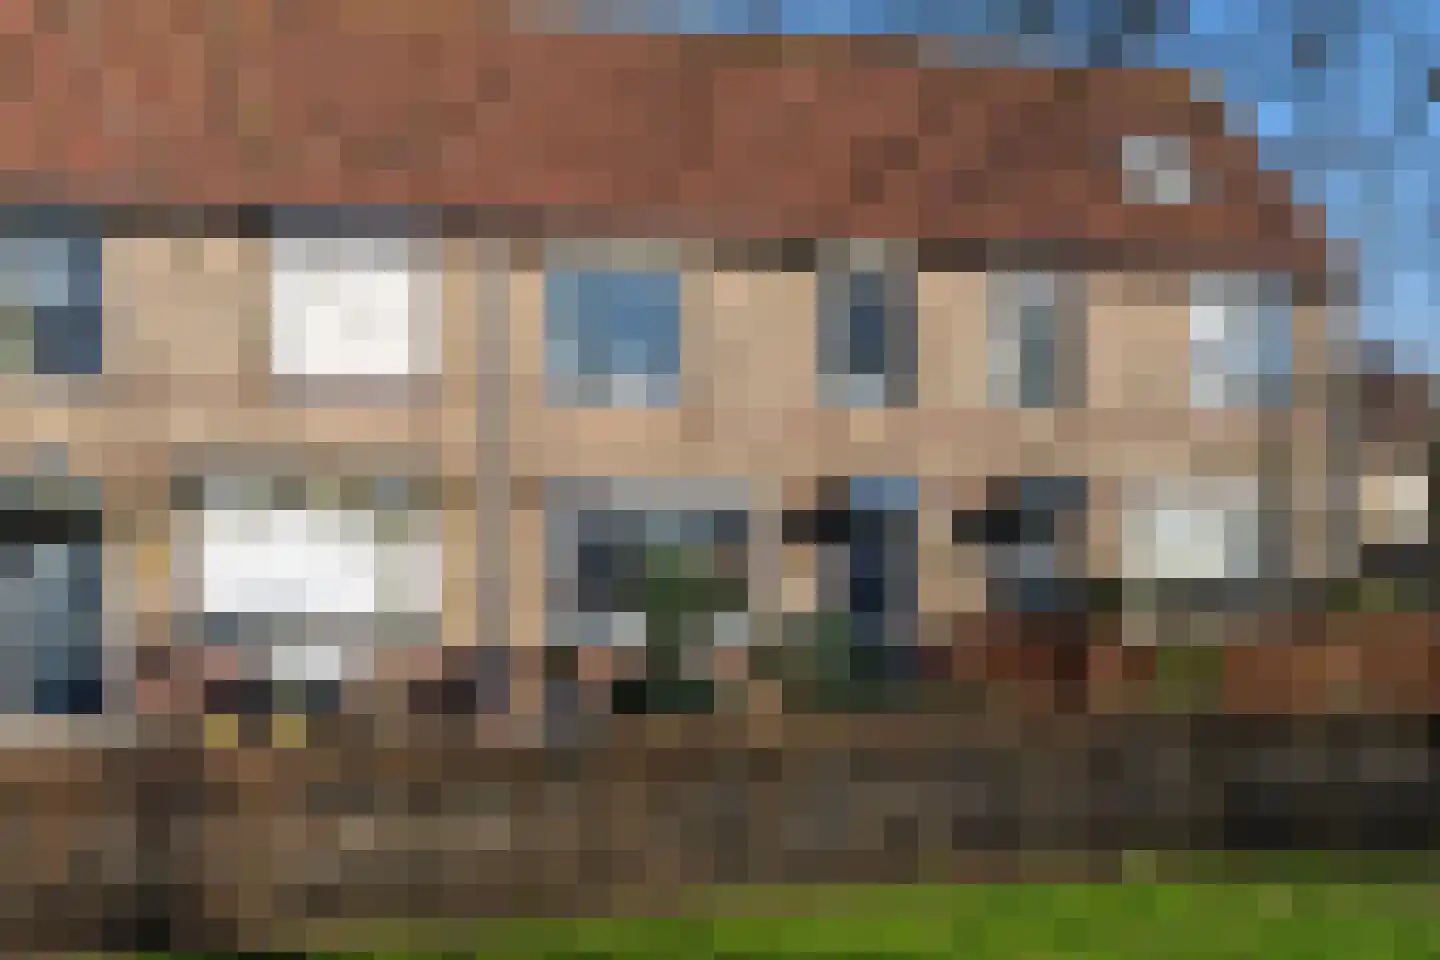
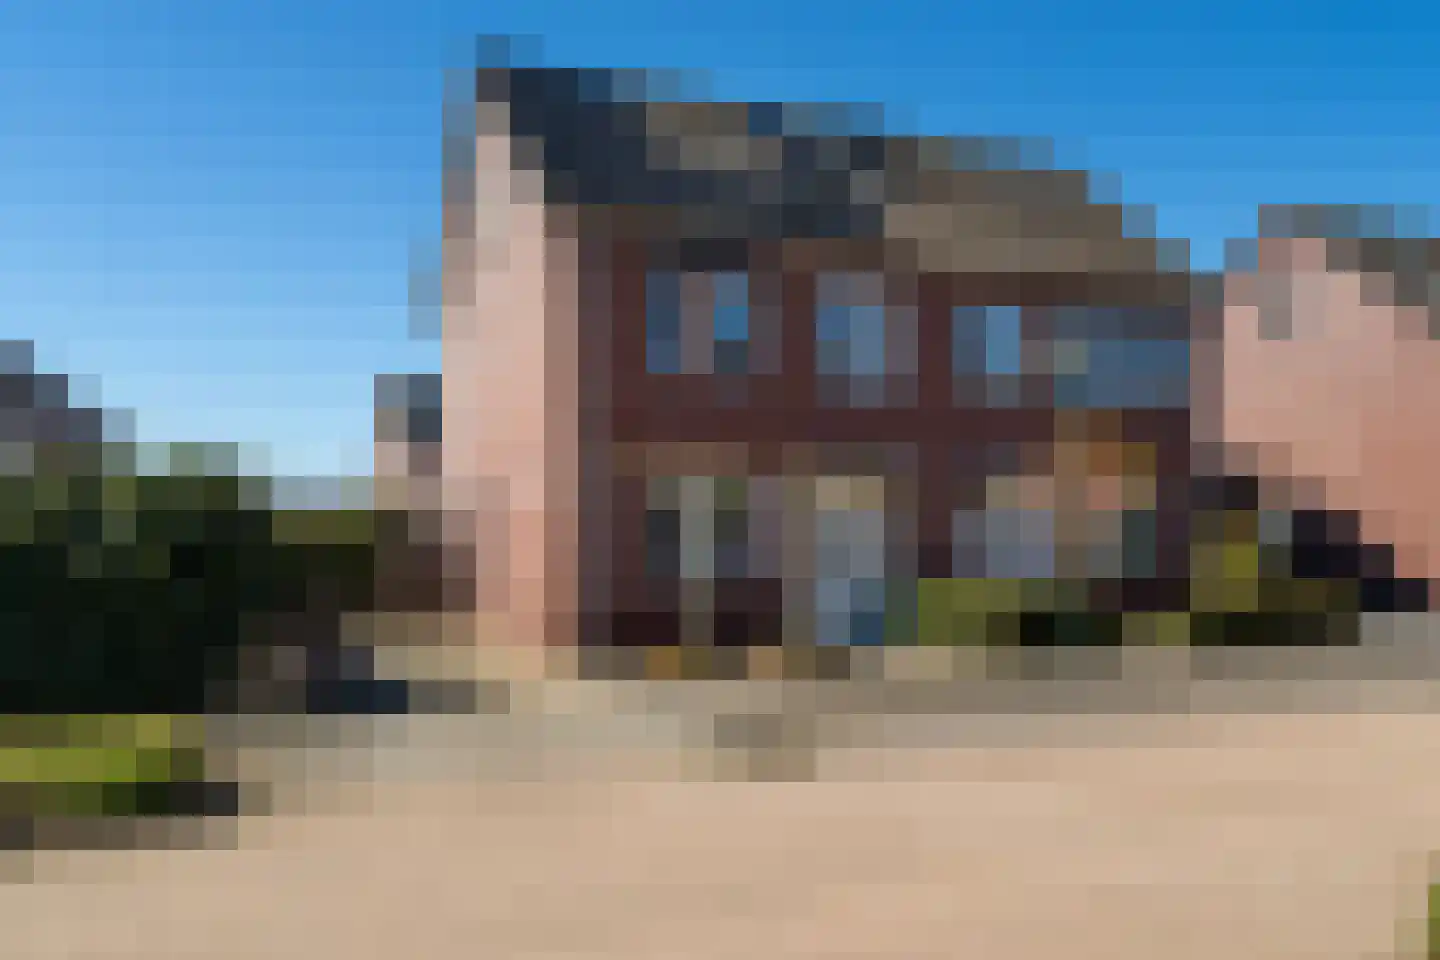
- Available
Brugdam 13 a
4286AX Almkerk
€ 698.000 k.k.
€ 3.035/m²
- Living area
- 230 m²
- Land area
- 228 m²
- Bedrooms
- 4
Searching in 43 houses in Almkerk
Type to search. Use arrow down and arrow up to navigate through results and press Enter to open.
Hidden search suggestions.
View current properties in Almkerk or search targeted on street, postal code and property characteristics.
View the current housing stock in Almkerk and quickly filter by price, living area, rooms and more. There are currently 43 houses in this place within our selection. View also 33 sold houses in Almkerk for extra insight into the local housing market.
4286AX Almkerk
€ 698.000 k.k.
€ 3.035/m²
4286LK Almkerk
€ 1.195.000 k.k.
€ 4.979/m²
4286EA Almkerk
€ 2.295.000 k.k.
€ 4.893/m²
4286GJ Almkerk
€ 399.000 k.k.
€ 3.950/m²
4286AL Almkerk
€ 795.000 k.k.
€ 5.129/m²
4286AZ Almkerk
€ 795.000 k.k.
€ 3.487/m²
4286ET Almkerk
€ 775.000 k.k.
€ 3.954/m²
4286CZ Almkerk
€ 475.000 k.k.
€ 4.948/m²
4286CM Almkerk
€ 395.000 k.k.
€ 3.657/m²
4286CC Almkerk
€ 375.000 k.k.
€ 5.000/m²
4286GN Almkerk
€ 525.000 k.k.
€ 4.565/m²
4286BJ Almkerk
€ 465.000 k.k.
€ 3.690/m²
4286CV Almkerk
€ 470.000 k.k.
€ 3.481/m²
4286BD Almkerk
€ 789.000 k.k.
€ 4.840/m²
4286BB Almkerk
€ 449.000 k.k.
€ 3.508/m²
4286LL Almkerk
€ 182.500 k.k.
€ 5.530/m²
4286BG Almkerk
€ 495.000 k.k.
€ 3.808/m²
4286GA Almkerk
€ 750.000 k.k.
€ 5.357/m²
4286ET Almkerk
€ 425.000 k.k.
€ 3.427/m²
4286EC Almkerk
€ 475.000 k.k.
€ 3.321/m²
4286GK Almkerk
€ 469.000 k.k.
€ 4.263/m²
4286ES Almkerk
€ 415.000 k.k.
€ 3.320/m²
4286BD Almkerk
€ 265.000 k.k.
€ 4.568/m²
4286LM Almkerk
€ 650.000 k.k.
€ 4.924/m²
4286EA Almkerk
€ 649.500 k.k.
€ 3.648/m²
4286ES Almkerk
€ 535.000 k.k.
€ 4.115/m²
4286BJ Almkerk
€ 375.000 k.k.
€ 3.000/m²
4286BR Almkerk
€ 389.000 k.k.
€ 3.536/m²
Get free quotes from real estate agents with local market knowledge. Compare more than 23 real estate agents in Almkerk.
Selling a home in Almkerk? Compare all real estate agents in Almkerk or view the top 10 real estate agents in Almkerk for extra context for your choice.
Real estate agents make sharper offers when they know you're comparing — ask for quotes for sale or purchase.
Practical answers about housing supply, sales and comparing real estate agents in Almkerk.
The costs of a real estate agent in Almkerk depend on commission, setup costs, property presentation and the chosen service. Compare the 23 real estate agents in Almkerk via the real estate agent page and request multiple quotes to compare rates and approach well.
Within our selection, we are currently showing 43 houses in Almkerk. View also the sold houses in Almkerk to compare the current offering with recent transactions.
Take into account not only price and living area but also maintenance, energy label, location, outdoor space and sales status. This way you compare houses in Almkerk on more than just the asking price.
A local real estate agent knows the neighborhoods, recent transactions and demand in Almkerk. By comparing 23 real estate agents in the region you get a better insight into prices, sales strategy and expected yield; the top 10 in Almkerk provides a useful starting point.
Yes, when making a sales plan, a valuation in Almkerk is wise. You gain insight into a realistic asking price and can then compare offers from real estate agents specifically.
View current location data on residents, WOZ development, housing stock, energy consumption, business activity and safety in Almkerk. In 2025 were there 3.840 residents. The average WOZ value in 2025 is EUR 424.000.
These figures help to better assess and compare the housing stock in Almkerk with recent sold homes. Orient yourself then on suitable top real estate agents in Almkerk for sales advice in this region.
Residents
3.840
Last year: 2025
Average WOZ
EUR 424.000
Last year: 2025
Average income per person.
EUR 34.200
Source: AllNumbers
Crimes (current year)
92
Total registered
| Year | Residents |
|---|---|
| 2021 | 3.720 |
| 2022 | 3.765 |
| 2023 | 3.805 |
| 2024 | 3.810 |
| 2025 | 3.840 |
| Year | Average WOZ |
|---|---|
| 2021 | EUR 308.000 |
| 2022 | EUR 339.000 |
| 2023 | EUR 399.000 |
| 2024 | EUR 419.000 |
| 2025 | EUR 424.000 |
Hoger
700
Praktisch
770
Middelbaar
1.380
Europa
125
Nederland
3.490
Buiten Europa
225
Label C
412
Label A
377
Label B
208
Label G
196
Label D
122
Label F
87
Label A+
56
Label E
38
Label A++
35
Label A+++
10
Label A+++++
1
Label A++++
0
| Year | Gas (m3) | Electricity (kWh) |
|---|---|---|
| 2020 | 1.370 | 3.220 |
| 2021 | 1.540 | 3.260 |
| 2022 | 1.160 | 3.120 |
| 2023 | 960 | 2.970 |
| 2024 | 920 | 3.060 |
Hoekwoning
Gas: 850 • Electricity: 2.340
Huurwoning
Gas: 750 • Electricity: 2.010
Koopwoning
Gas: 1.070 • Electricity: 3.460
Appartement
Gas: 530 • Electricity: 2.130
Tussenwoning
Gas: 770 • Electricity: 2.190
Vrijstaande woning
Gas: 1.270 • Electricity: 3.940
Twee-onder-één-kap woning
Gas: 980 • Electricity: 3.180
Total number of company establishments: 570
| Period | Crimes |
|---|---|
| jan 2026 | 10 |
| jul 2025 | 6 |
| jun 2025 | 6 |
| mei 2025 | 7 |
| mrt 2025 | 11 |
| mrt 2026 | 10 |
| nov 2024 | 9 |
| nov 2025 | 7 |
| okt 2024 | 14 |
| okt 2025 | 8 |
| sep 2024 | 6 |
| sep 2025 | 6 |
These figures give an indicative picture of safety trends in the living environment of Almkerk.
Short answers based on current local statistics, handy for a quick comparison of the living environment.
Almkerk telt in 2025 ongeveer 3.840 inwoners.
De gemiddelde WOZ-waarde in Almkerk is in 2025 circa € 424.000.
Het gemiddelde inkomen per inwoner in Almkerk ligt rond € 34.200 per jaar.
Voor het huidige jaar gaat het om ongeveer 92 geregistreerde misdrijven. Gebruik deze cijfers als indicatie en vergelijk trends per periode.
In Almkerk komt vooral "Vrijstaande woningen" veel voor, met ongeveer 575 woningen.