- Under consideration
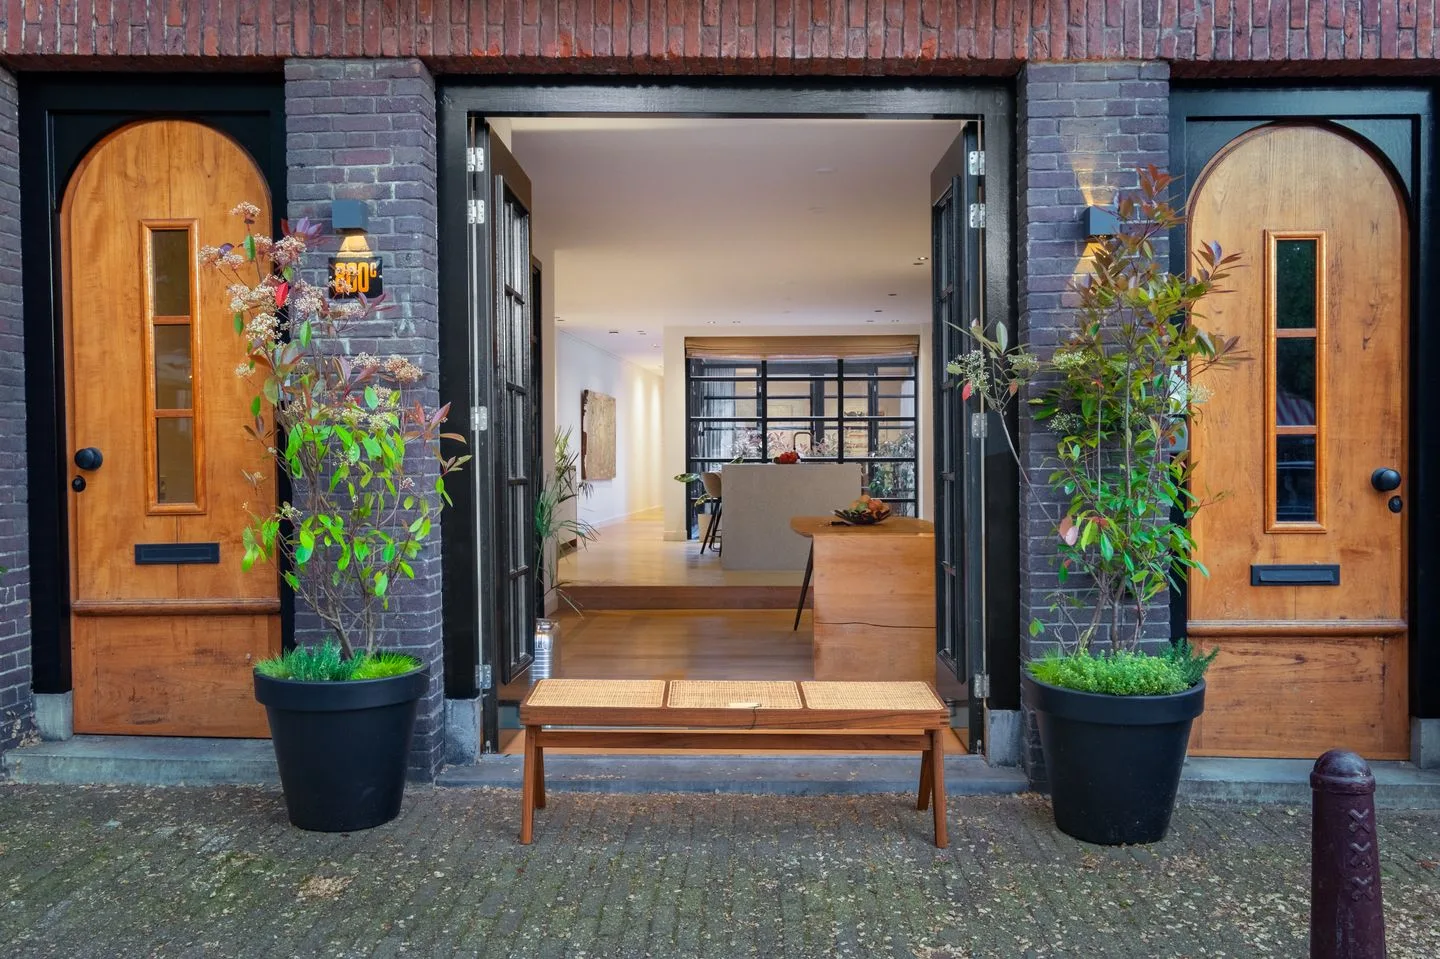
Prinsengracht 800 C
1017LH Amsterdam
€ 1.700.000 k.k.
€ 10.000/m²
A++
Save as favorite
- Living area
- 170 m²
- Land area
- —
- Bedrooms
- 3