Residents
22.040
Last year: 2025
3454NV De Meern • Utrecht
€ 1.450.000 k.k.
Cost of copper (estimated): € 30.850
2% transfer tax (€ 29.000) + notary (€ 1.150) + valuation (€ 700)
Total incl. VAT: € 1.480.850
Purchase price /m²: € 6.872
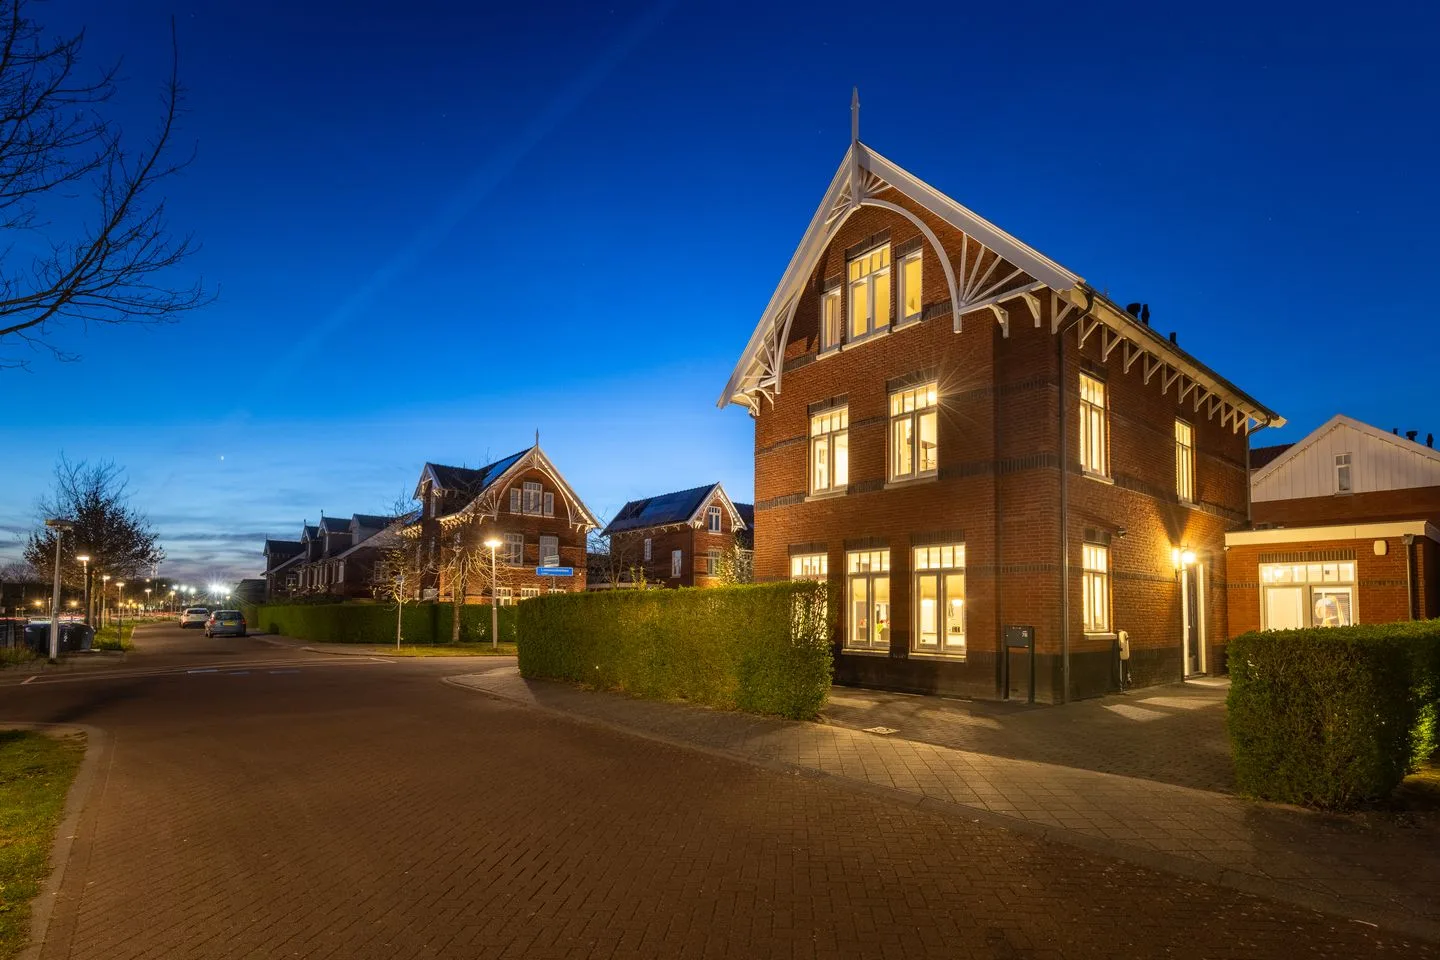
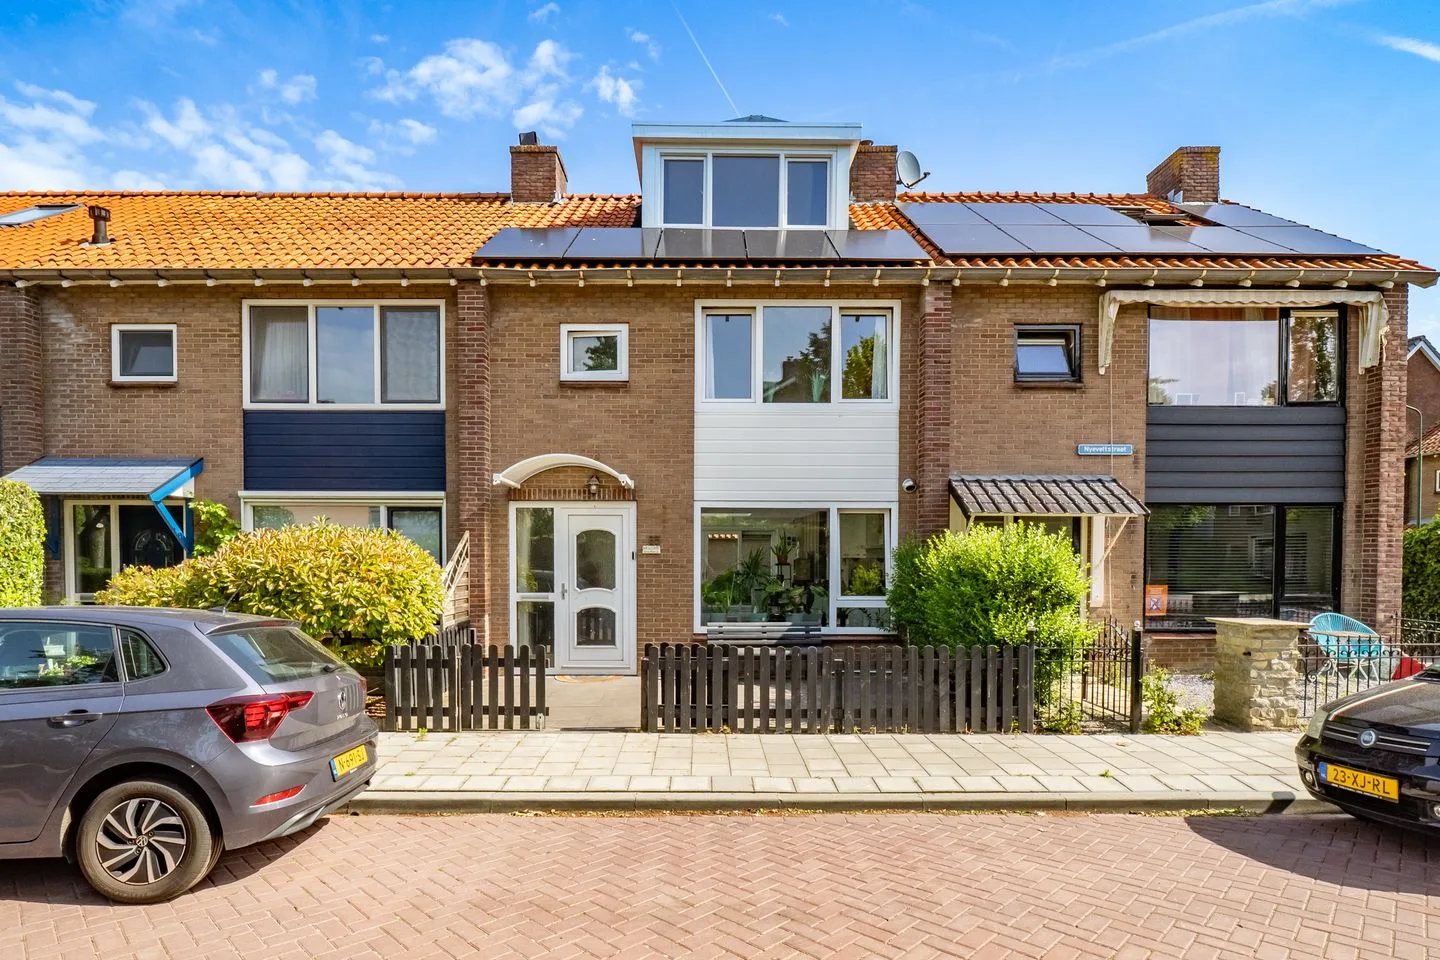
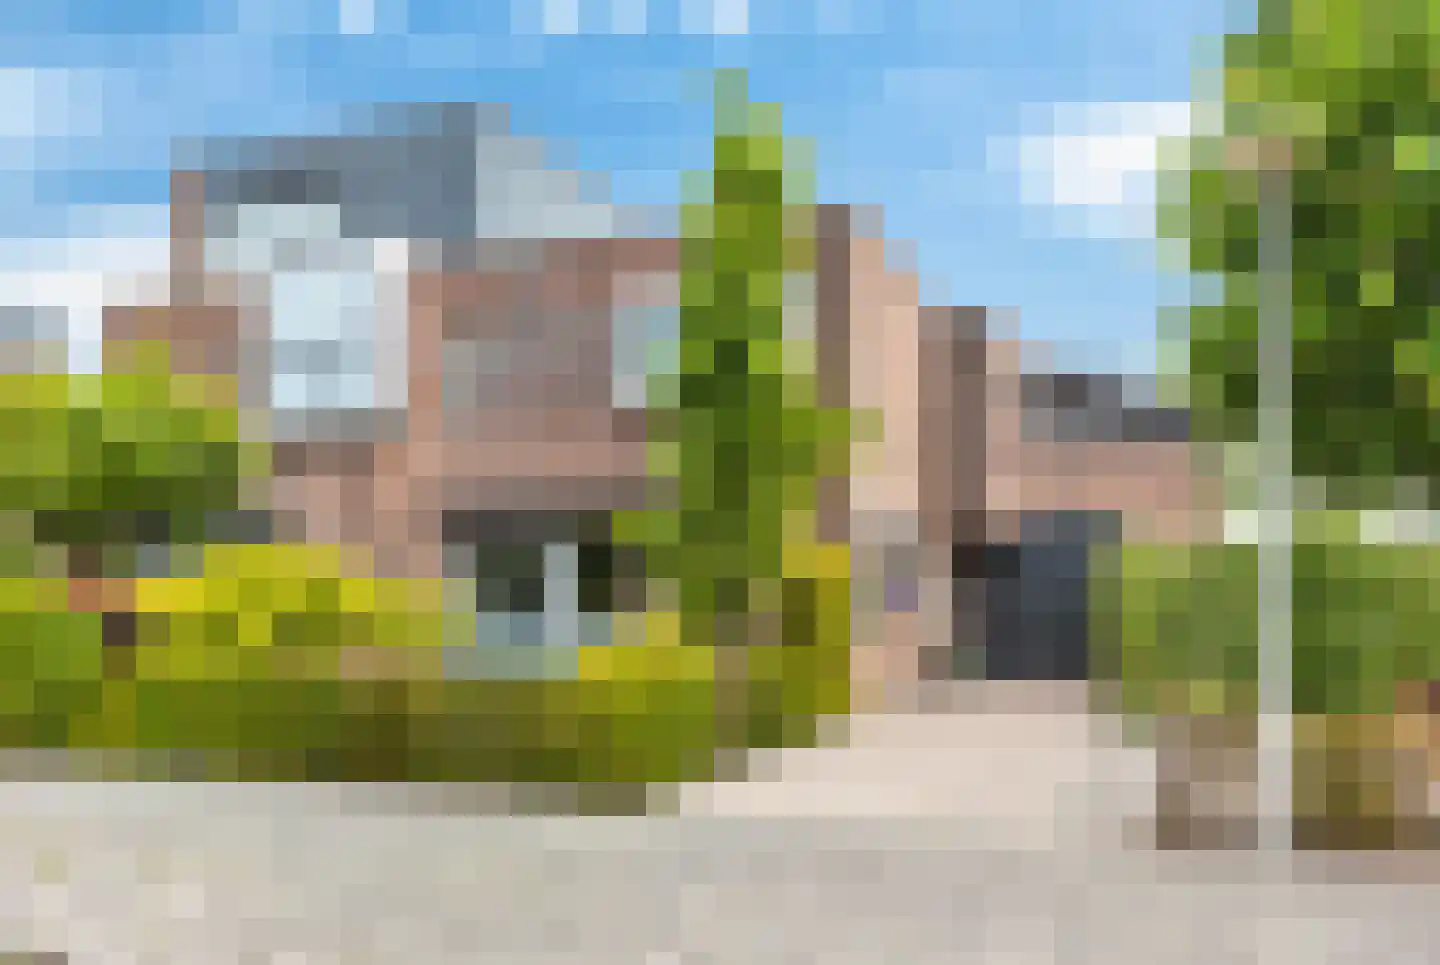
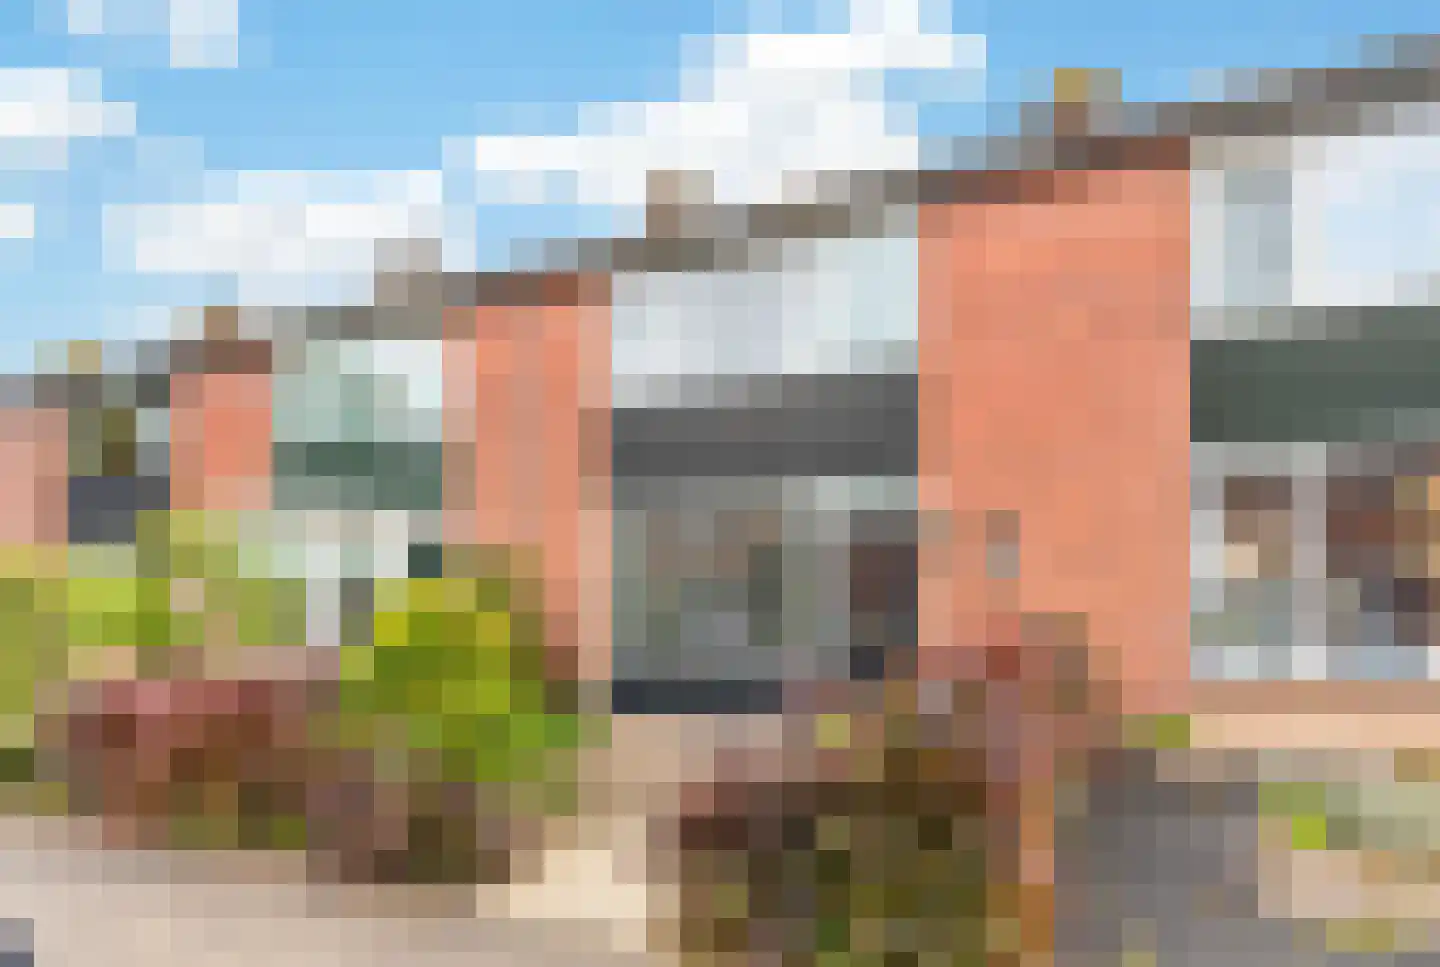
Hier woon je zoals het bedoeld is: vrijstaand, royaal en met een vanzelfsprekende luxe, midden in een villapark waar rust, ruimte en klasse samenkomen: Emmikkerboslaan 78 De Meern – een villa van formaat in een villapark waar alles samenkomt Dit is zo’n huis waar je stil van wordt zodra je aan komt rijden. Deze vrijstaande villa met ruimte, licht en luxe afwerking, gelegen in een villapark aan de zuidkant van het Maximapark. Hier woon je niet alleen comfortabel, maar ook met een gevoel van rust en privacy. De architect heeft in het ontwerp een statement gemaakt door kenmerkende elementen toe te voegen, wat de woning een bijzondere allure geeft. Kenmerken: • Vrijstaande villa met 211 m² woonoppervlak • Parkeren voor 3 auto's op eigen terrein • Elke etage voorzien van een toilet • Zes volwaardige slaapkamers en royale leefruimtes • Luxe SieMatic woonkeuken met eiland en hoogwaardige afwerking • Strak aangelegde tuin met overkapping, meerdere terrassen en veel privacy • Energielabel A, volledig geïsoleerd en voorzien airconditioning • Vloerverwarming en moderne installaties voor optimaal comfort • Gelegen in exclusief villapark met uitsluitend woningen in het hogere segment • Nabij Maximapark, sportpark Ouderijn, Hockeyvereniging Fletiomare en zwembad Binnen ervaar je de kwaliteit en rust die je van een woning in deze klasse mag verwachten. De leefruimte is royaal opgezet en het licht treedt prettig binnen dankzij de grote raampartijen en openslaande deuren naar de tuin. Alles voelt doordacht en in balans: van de strakke afwerking tot de maatwerk kastenwand met haard, die subtiel verschoven kan worden voor sfeervolle donkere avonden. De woonkeuken vormt het hart van het huis, met een ruim eiland en hoogwaardige inbouwapparatuur. Dit is een plek waar je kookt, samenkomt en waar het dagelijks leven zich moeiteloos afspeelt. De combinatie van ruimte, licht en afwerking geeft de woning een vanzelfsprekende luxe die je niet vaak tegenkomt. Op de eerste verdieping bevinden zich drie ruime slaapkamers en een verzorgde badkamer. De badkamer is voorzien van een ligbad, badkamermeubel met dubbele wastafel en een inloopdouche. De tweede verdieping biedt nog eens drie slaapkamers en extra bergruimte, waardoor de woning zich moeiteloos aanpast aan verschillende woonwensen. Of je nu een groot gezin hebt, thuiswerkt of extra ruimte zoekt voor hobby’s, hier kan het zonder concessies. Elke kamer voelt volwaardig en prettig, met voldoende licht en ruimte. Het betere buitenleven beleef je in de zonnig gelegen tuin. Strak aangelegd, met verschillende terrassen, en meerdere plekken om te zitten, of eventueel een zwembad kan aanleggen. Onder de overkapping geniet je beschut van lange avonden, terwijl de open delen van de tuin juist uitnodigen om van de zon te genieten. De privacy is hier vanzelfsprekend, waardoor je echt het gevoel hebt vrij te wonen. De woning is gebouwd in 2016 en beschikt over energielabel A, wat zorgt voor een comfortabel en efficiënt energieverbruik. Dankzij de volledige isolatie, HR++ beglazing en de hybride warmtepomp in combinatie met een cv-ketel woon je hier toekomstgericht . Vloerverwarming op de begane grond draagt bij aan het comfort en de gelijkmatige warmteverdeling. Wat deze woning extra bijzonder maakt, is de ligging in een villapark waar kwaliteit en rust de standaard zijn. Hier geen doorsnee straatbeeld, maar een omgeving met uitsluitend vrijstaande woningen in het hogere segment, brede lanen en veel groen. De sfeer is rustig, verzorgd en ruim opgezet, precies wat je verwacht bij een woning in deze buitencategorie. Tegelijkertijd ligt het Maximapark om de hoek, een plek waar je kunt wandelen, sporten en ontspannen. Met hockeyvereniging Fletiomare, sportpark Ouderijn en een zwembad om de hoek is er altijd iets te doen. De bereikbaarheid richting Utrecht en de uitvalswegen is uitstekend, waardoor je hier vrij woont met de stad binnen handbereik. Benieuwd naar deze woning? Kom snel langs voor een bezichtiging en ontdek zelf het comfort en de sfeer van Emmikkerboslaan 78. Of bekijk de woningpresentatie op: emmikkerboslaan78.nl Interesse? Neem contact op via of bel 030 688 45 35.
€ 1.450.000
Cost of copper (estimated): € 30.850
2% transfer tax (€ 29.000) + notary (€ 1.150) + valuation (€ 700)
Total purchase (incl. p.p.): € 1.480.850
3,21%
Yearly
€ 72.500
Direct available
Estimated mortgage
Indicative gross monthly cost
Based on annuity and 30 year term
Indicative net monthly cost
iDisclaimer: this mortgage calculation is a simplified indication based on general assumptions. No rights can be derived from the results shown. Calculated with 10-annual interest (zonder NHG), automatically determined based on the price limit € 470.000. Source: 10-jaars rente uit mortgage_rates (08-06-2026 03:45). For non-NHG, an 80% mortgage of the market value has been used in this indication.
Ligbad en wastafel
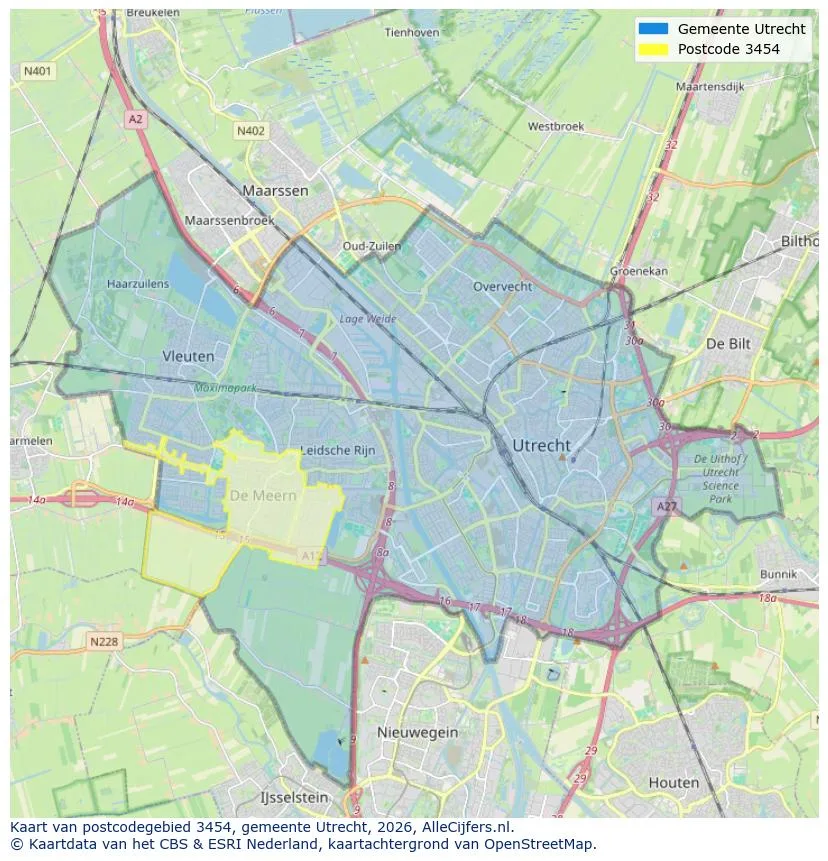
Geographic orientation and real estate agent density in De Meern
View current location data on residents, WOZ development, housing stock, energy consumption, business activity and safety in De Meern. In 2025 were there 22.040 residents. The average WOZ value in 2025 is EUR 578.098.
Residents
22.040
Last year: 2025
Average WOZ
EUR 578.098
Last year: 2025
Average income per person.
EUR 39.181
Source: AllNumbers
Crimes (current year)
900
Total registered
| Year | Residents |
|---|---|
| 2021 | 21.815 |
| 2022 | 21.825 |
| 2023 | 21.965 |
| 2024 | 21.980 |
| 2025 | 22.040 |
| Year | Average WOZ |
|---|---|
| 2021 | EUR 400.197 |
| 2022 | EUR 447.015 |
| 2023 | EUR 545.234 |
| 2024 | EUR 536.126 |
| 2025 | EUR 578.098 |
Hoger
6.850
Praktisch
3.740
Middelbaar
5.530
Europa
1.615
Nederland
15.565
Buiten Europa
4.865
Label A
3.517
Label B
2.648
Label C
1.305
Label D
427
Label E
335
Label F
237
Label A+
212
Label G
177
Label A+++
127
Label A++
71
Label A++++
39
Label A+++++
4
| Year | Gas (m3) | Electricity (kWh) |
|---|---|---|
| 2020 | 1.063 | 3.099 |
| 2021 | 1.213 | 3.175 |
| 2022 | 935 | 2.962 |
| 2023 | 810 | 2.756 |
| 2024 | 781 | 2.808 |
Hoekwoning
Gas: 892 • Electricity: 2.920
Huurwoning
Gas: 652 • Electricity: 2.003
Koopwoning
Gas: 869 • Electricity: 3.002
Appartement
Gas: 484 • Electricity: 1.810
Tussenwoning
Gas: 787 • Electricity: 2.649
Vrijstaande woning
Gas: 1.400 • Electricity: 4.762
Twee-onder-één-kap woning
Gas: 1.062 • Electricity: 3.374
Total number of company establishments: 3.355
| Period | Crimes |
|---|---|
| jan 2025 | 63 |
| jan 2026 | 91 |
| jul 2025 | 85 |
| jun 2025 | 77 |
| mei 2025 | 75 |
| mrt 2025 | 74 |
| nov 2024 | 94 |
| nov 2025 | 93 |
| okt 2024 | 92 |
| okt 2025 | 76 |
| sep 2024 | 61 |
| sep 2025 | 71 |
These figures give an indicative picture of safety trends in the living environment of De Meern.
Short answers based on current local statistics, handy for a quick comparison of the living environment.
De Meern telt in 2025 ongeveer 22.040 inwoners.
De gemiddelde WOZ-waarde in De Meern is in 2025 circa € 578.098.
Het gemiddelde inkomen per inwoner in De Meern ligt rond € 39.181 per jaar.
Voor het huidige jaar gaat het om ongeveer 900 geregistreerde misdrijven. Gebruik deze cijfers als indicatie en vergelijk trends per periode.
In De Meern komt vooral "Tussenwoningen" veel voor, met ongeveer 4.636 woningen.
View more homes in this location.
3453NS De Meern
€ 499.000 k.k.
€ 4.941/m²
3453MC De Meern
€ 775.000 k.k.
€ 4.330/m²
3454MX De Meern
€ 60.000 k.k.
3454EW De Meern
€ 590.000 k.k.
€ 5.086/m²
3454WV De Meern
€ 500.000 k.k.
€ 4.202/m²
3453PH De Meern
€ 700.000 k.k.
€ 3.784/m²
3453VX De Meern
€ 750.000 k.k.
€ 5.952/m²
3454XJ De Meern
€ 525.000 k.k.
€ 5.526/m²
