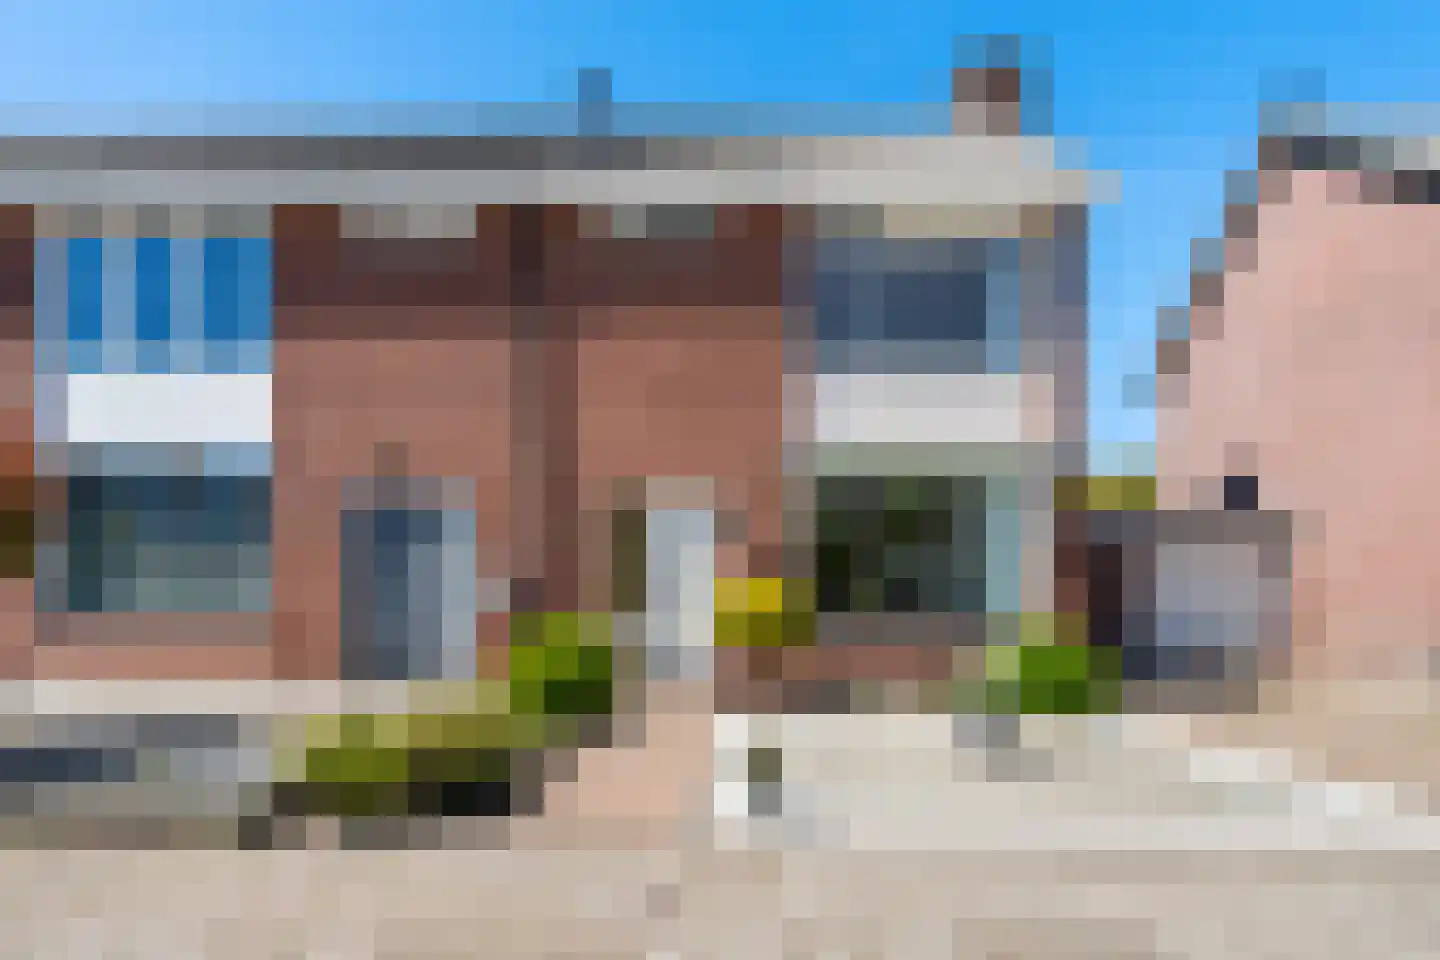
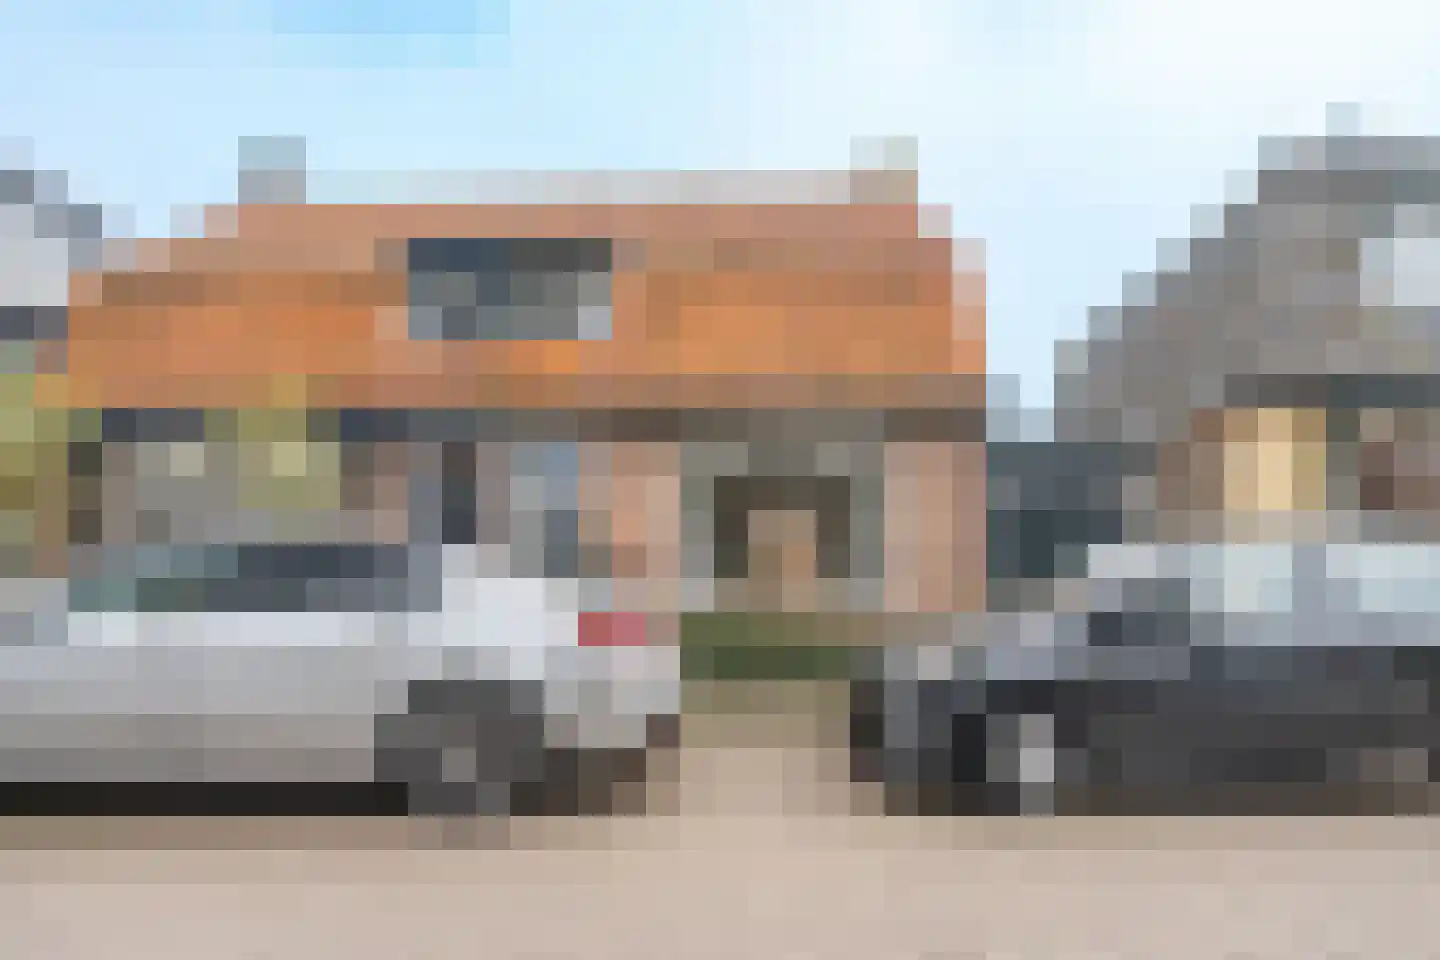
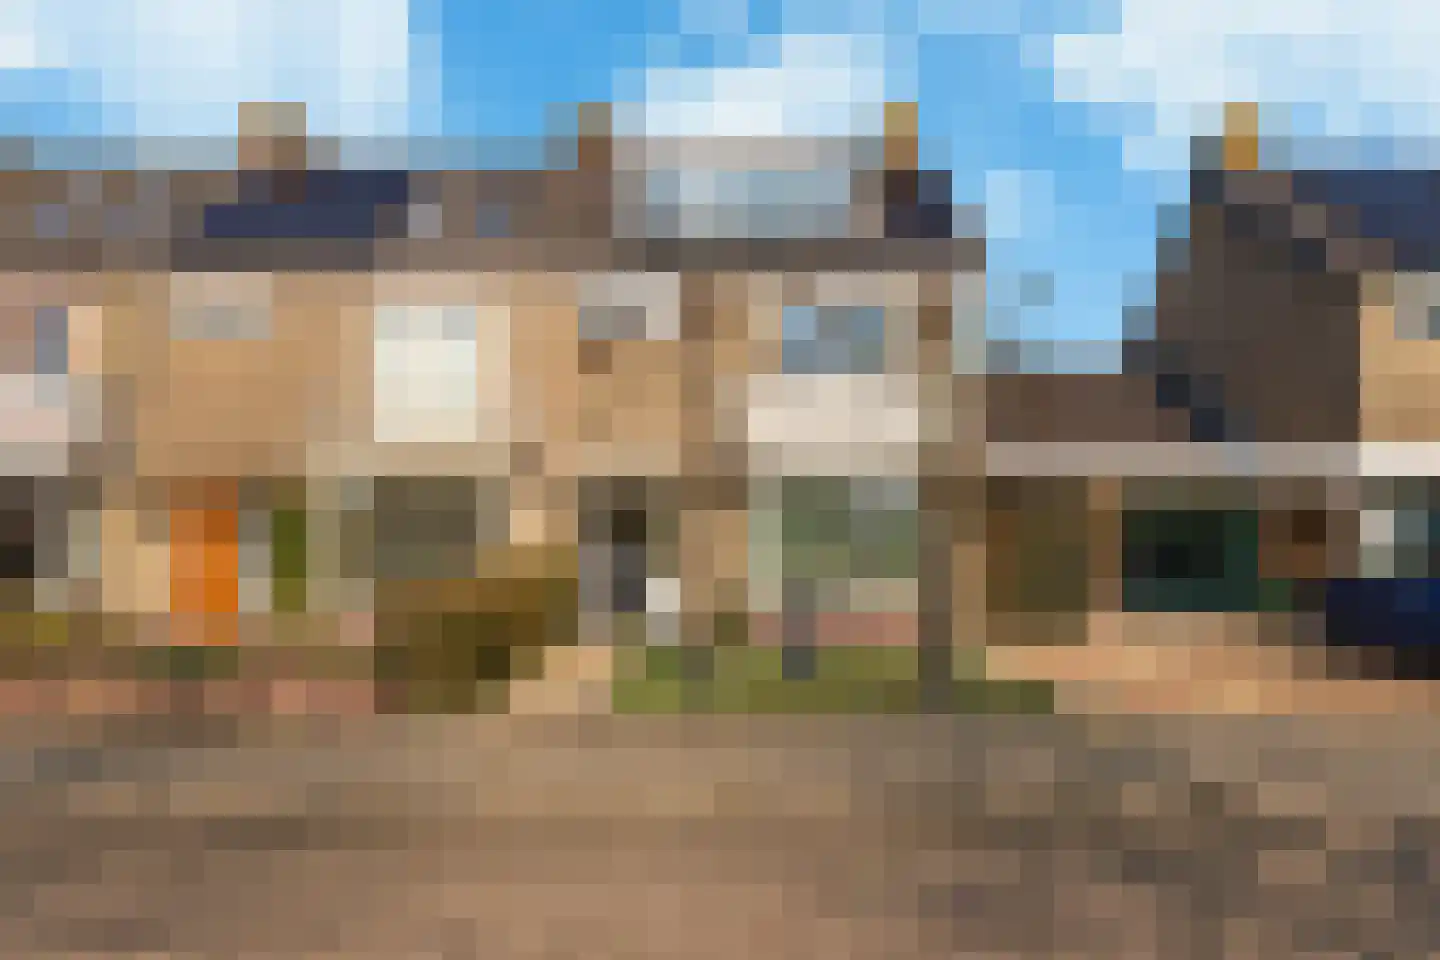
Housing offer in De Zilk

Searching in 28 houses in De Zilk

Connected to: Vastgoed Nederland NVM Makelaars

View the current housing stock in De Zilk and quickly filter by price, living area, rooms and more. There are currently 28 houses in this place within our selection. View also 17 sold houses in De Zilk for extra insight into the local housing market.

Selection

Search and filter homes

Set your preferences and discover homes that suit you.

Total supply 244.789
Filters

Set price, area and other characteristics. Adjust a filter or click on Show homes. Location changes directly above.

Reset filters

You search for

  • Place De Zilk

Selling a home in De Zilk? Compare realtor offers

Get free quotes from real estate agents with local market knowledge. Compare more than 106 real estate agents in De Zilk.

Free request a quote

  • Quotes in De Zilk
  • Non-binding
  • Personal
  • Compare free rates

Selling a home in De Zilk? Compare all real estate agents in De Zilk or view the top 10 real estate agents in De Zilk for extra context for your choice.

Compare multiple quotes

Real estate agents make sharper offers when they know you're comparing — ask for quotes for sale or purchase.

Frequently asked questions about homes in De Zilk

Practical answers about housing supply, sales and comparing real estate agents in De Zilk.

Residential and neighborhood statistics in De Zilk

View current location data on residents, WOZ development, housing stock, energy consumption, business activity and safety in De Zilk. In 2025 were there 2.405 residents. The average WOZ value in 2025 is EUR 467.000.

These figures help to better assess and compare the housing stock in De Zilk with recent sold homes. Orient yourself then on suitable top real estate agents in De Zilk for sales advice in this region.

Residents

2.405

Last year: 2025

Average WOZ

EUR 467.000

Last year: 2025

Average income per person.

EUR 32.400

Source: AllNumbers

Crimes (current year)

32

Total registered

Demographics and WOZ development

Inhabitants per year

Inhabitants per year in De Zilk
Year Residents
2021 2.300
2022 2.290
2023 2.355
2024 2.395
2025 2.405

Annual WOZ value

WOZ value per year in De Zilk
Year Average WOZ
2021 EUR 340.000
2022 EUR 382.000
2023 EUR 434.000
2024 EUR 444.000
2025 EUR 467.000

Composition of residents

Age build-up

65+: 575 0-15: 345 15-25: 250 25-45: 565 45-65: 660

Education level

Hoger

600

Praktisch

440

Middelbaar

770

Origin of residents (2025)

Europa

170

Nederland

2.040

Buiten Europa

190

Housing stock and construction periods

Types of homes

Hoekwoningen 251
Appartementen 126
Tussenwoningen 430
Vrijstaande woningen 145
Twee-onder-één-kap woningen 99

Construction period of buildings

Voor 1700 1
1700 tot 1900 9
1900 tot 1925 56
1925 tot 1950 141
1950 tot 1970 509
1970 tot 1980 67
1980 tot 1990 70
1990 tot 2000 59
2000 tot 2010 32
2010 tot 2020 99
2020 en later 22

Energy and sustainability

Energy label distribution

Label C

219

Label A

201

Label F

133

Label D

107

Label B

105

Label G

103

Label E

100

Label A+++

77

Label A+

13

Label A++

6

Label A++++

1

Label A+++++

0

Average energy consumption per year

Average energy consumption per year in De Zilk
Year Gas (m3) Electricity (kWh)
2020 1.140 2.990
2021 1.410 3.200
2022 1.100 2.880
2023 900 2.660
2024 860 2.760

Consumption per house type

Hoekwoning

Gas: 890 • Electricity: 2.670

Huurwoning

Gas: 760 • Electricity: 2.060

Koopwoning

Gas: 950 • Electricity: 2.900

Appartement

Gas: 450 • Electricity: 2.110

Tussenwoning

Gas: 780 • Electricity: 2.410

Vrijstaande woning

Gas: 1.460 • Electricity: 3.710

Twee-onder-één-kap woning

Gas: 1.090 • Electricity: 2.890

Business activity in De Zilk (2025)

Handel en HORECA 60
Nijverheid en energie 45
Zakelijke dienstverlening 100
Overheid, onderwijs en zorg 55
Landbouw, bosbouw en visserij 30
Vervoer, informatie en communicatie 20
Financiele diensten en onroerendgoed 20
Cultuur, recreatie en overige diensten 35

Total number of company establishments: 360

Recent crime statistics

Recent crime statistics in De Zilk
Period Crimes
jan 2025 2
jan 2026 2
jul 2025 3
jun 2025 1
mei 2025 4
mrt 2025 3
nov 2024 2
nov 2025 4
okt 2024 0
okt 2025 3
sep 2024 2
sep 2025 3

These figures give an indicative picture of safety trends in the living environment of De Zilk.

Frequently asked questions about living in De Zilk

Short answers based on current local statistics, handy for a quick comparison of the living environment.

Hoeveel inwoners heeft De Zilk?

De Zilk telt in 2025 ongeveer 2.405 inwoners.

Wat is de gemiddelde WOZ-waarde in De Zilk?

De gemiddelde WOZ-waarde in De Zilk is in 2025 circa € 467.000.

Wat is het gemiddelde inkomen per inwoner in De Zilk?

Het gemiddelde inkomen per inwoner in De Zilk ligt rond € 32.400 per jaar.

Hoe veilig is wonen in De Zilk?

Voor het huidige jaar gaat het om ongeveer 32 geregistreerde misdrijven. Gebruik deze cijfers als indicatie en vergelijk trends per periode.

Welke woningtypen komen het meest voor in De Zilk?

In De Zilk komt vooral "Tussenwoningen" veel voor, met ongeveer 430 woningen.

Receive free, non-binding quotes

Compare multiple real estate agents and choose the best match.