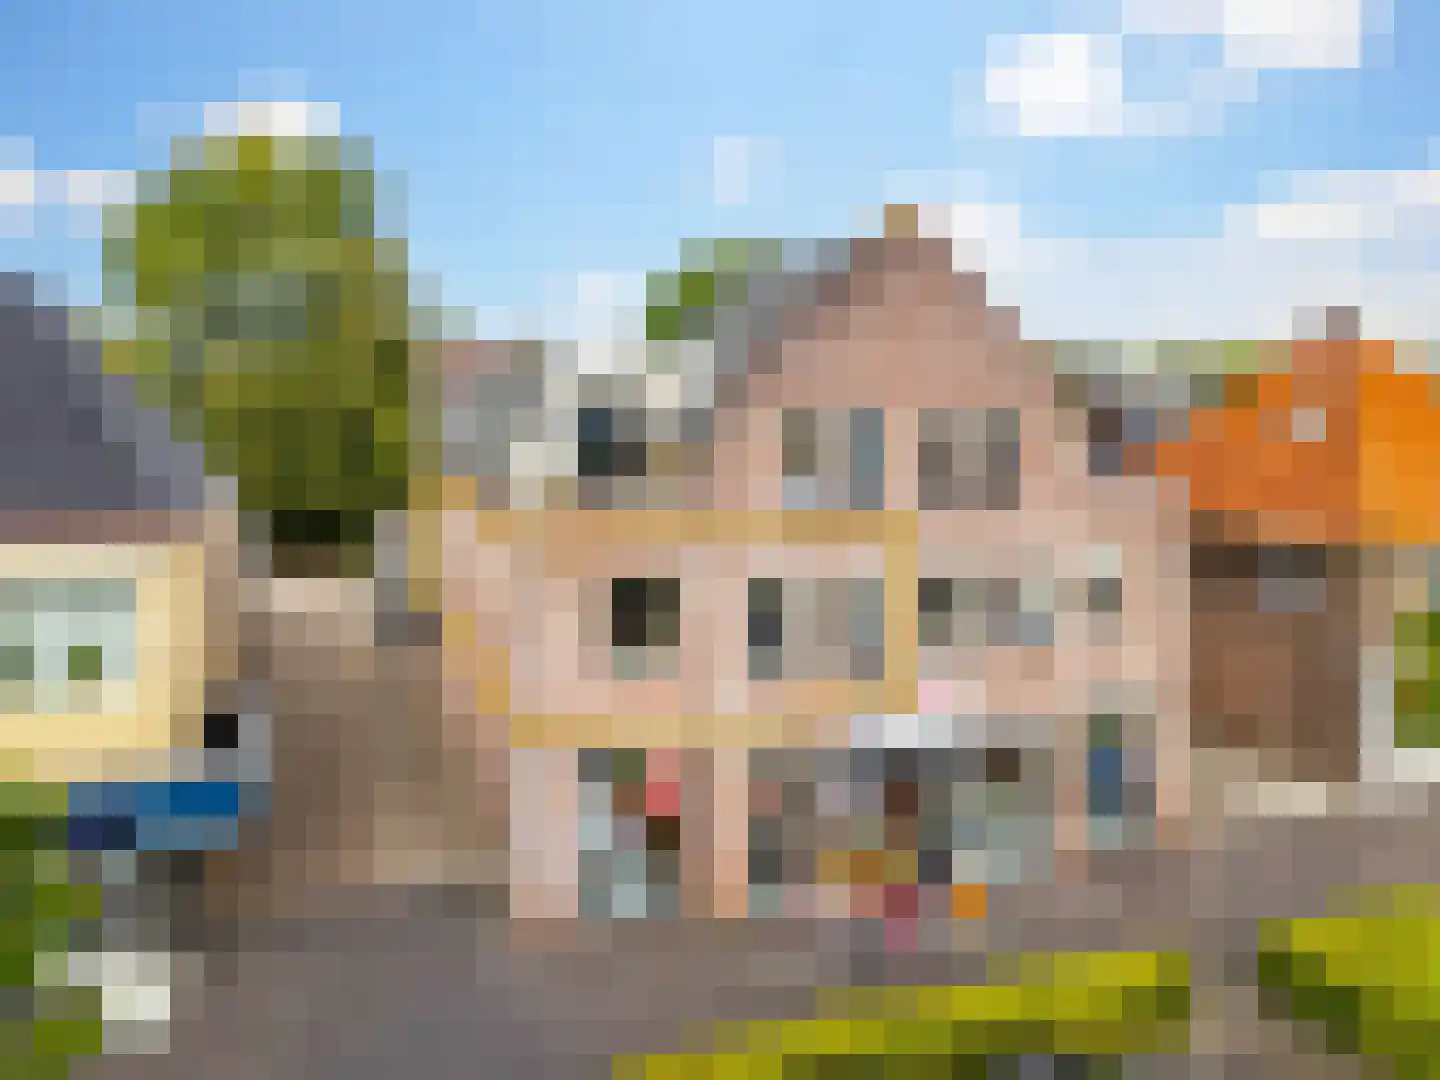
- Sold
Bijenkorf 24
6961PB Eerbeek
€ 399.000 k.k.
€ 4.071/m²
- Living area
- 98 m²
- Land area
- 219 m²
- Bedrooms
- 3
Searching in 141 houses in Eerbeek
Type to search. Use arrow down and arrow up to navigate through results and press Enter to open.
Hidden search suggestions.
View current properties in Eerbeek or search targeted on street, postal code and property characteristics.
View the current housing stock in Eerbeek and quickly filter by price, living area, rooms and more. There are currently 141 houses in this place within our selection. View also 112 sold houses in Eerbeek for extra insight into the local housing market.
6961PB Eerbeek
€ 399.000 k.k.
€ 4.071/m²
6961TX Eerbeek
€ 325.000 k.k.
€ 3.316/m²
6961LE Eerbeek
€ 695.000 k.k.
€ 5.387/m²
6961VM Eerbeek
€ 419.000 k.k.
€ 3.809/m²
6961SL Eerbeek
€ 699.000 k.k.
€ 4.087/m²
6961JV Eerbeek
€ 525.000 k.k.
€ 4.449/m²
6961XM Eerbeek
Price upon request
6961PD Eerbeek
€ 899.000 k.k.
€ 4.517/m²
6961ZB Eerbeek
€ 375.000 k.k.
€ 3.504/m²
6961SL Eerbeek
€ 649.000 k.k.
€ 3.795/m²
6961BC Eerbeek
€ 339.000 k.k.
€ 2.756/m²
6961ZL Eerbeek
€ 309.000 k.k.
€ 4.012/m²
6961GC Eerbeek
€ 885.000 k.k.
€ 3.915/m²
6961TX Eerbeek
€ 375.000 k.k.
€ 4.310/m²
6961PG Eerbeek
€ 619.000 k.k.
€ 3.967/m²
6961EB Eerbeek
€ 750.000 k.k.
€ 2.851/m²
6961CD Eerbeek
€ 425.000 k.k.
€ 3.512/m²
6961CH Eerbeek
€ 375.000 k.k.
€ 5.281/m²
6961CW Eerbeek
€ 490.000 k.k.
€ 5.506/m²
6961TZ Eerbeek
€ 319.000 k.k.
€ 4.557/m²
6961ZR Eerbeek
€ 290.000 k.k.
€ 3.452/m²
6961SN Eerbeek
€ 475.000 k.k.
€ 3.925/m²
6961SN Eerbeek
€ 495.000 k.k.
€ 3.897/m²
6961ZT Eerbeek
€ 495.000 k.k.
€ 3.807/m²
6961KM Eerbeek
€ 925.000 k.k.
€ 5.082/m²
6961PA Eerbeek
€ 449.000 k.k.
€ 0/m²
6961HE Eerbeek
€ 599.000 k.k.
€ 0/m²
6961XX Eerbeek
€ 332.500 k.k.
€ 0/m²
Get free quotes from real estate agents with local market knowledge. Compare more than 17 real estate agents in Eerbeek.
Selling a home in Eerbeek? View the sales-oriented guide sell a house in Eerbeek, compare all real estate agents in Eerbeek or view the top 10 real estate agents in Eerbeek for extra context to your choice.
Real estate agents make sharper offers when they know you're comparing — ask for quotes for sale or purchase.
Practical answers about housing supply, sales and comparing real estate agents in Eerbeek.
The costs of a real estate agent in Eerbeek depend on commission, setup costs, property presentation and the chosen service. Compare the 17 real estate agents in Eerbeek via the real estate agent page and request multiple quotes to compare rates and approach well.
Within our selection, we are currently showing 141 houses in Eerbeek. View also the sold houses in Eerbeek to compare the current offering with recent transactions.
Take into account not only price and living area but also maintenance, energy label, location, outdoor space and sales status. This way you compare houses in Eerbeek on more than just the asking price.
A local real estate agent knows the neighborhoods, recent transactions and demand in Eerbeek. By comparing 17 real estate agents in the region you get a better insight into prices, sales strategy and expected yield; the top 10 in Eerbeek provides a useful starting point.
Yes, when making a sales plan, a valuation in Eerbeek is wise. You gain insight into a realistic asking price and can then compare offers from real estate agents specifically.
View current location data on residents, WOZ development, housing stock, energy consumption, business activity and safety in Eerbeek. In 2026 were there 10.232 residents. The average WOZ value in 2025 is EUR 380.000.
These figures help to better assess and compare the housing stock in Eerbeek with recent sold homes. Orient yourself then on suitable top real estate agents in Eerbeek for sales advice in this region.
Residents
10.232
Last year: 2026
Average WOZ
EUR 380.000
Last year: 2025
Average income per person.
EUR 35.000
Source: AllNumbers
Crimes (current year)
255
Total registered
| Year | Residents |
|---|---|
| 2021 | 9.850 |
| 2022 | 9.920 |
| 2023 | 10.060 |
| 2024 | 10.215 |
| 2025 | 10.210 |
| 2026 | 10.232 |
| Year | Average WOZ |
|---|---|
| 2021 | EUR 269.000 |
| 2022 | EUR 299.000 |
| 2023 | EUR 357.000 |
| 2024 | EUR 368.000 |
| 2025 | EUR 380.000 |
Hoger
1.810
Praktisch
2.230
Middelbaar
3.420
Europa
490
Nederland
8.465
Buiten Europa
1.250
Label C
1.322
Label A
1.007
Label B
801
Label D
672
Label G
308
Label E
263
Label A+
248
Label F
246
Label A+++
183
Label A++++
96
Label A++
78
Label A+++++
5
| Year | Gas (m3) | Electricity (kWh) |
|---|---|---|
| 2020 | 1.340 | 2.880 |
| 2021 | 1.490 | 2.940 |
| 2022 | 1.150 | 2.730 |
| 2023 | 940 | 2.630 |
| 2024 | 890 | 2.720 |
Hoekwoning
Gas: 850 • Electricity: 2.430
Huurwoning
Gas: 760 • Electricity: 1.980
Koopwoning
Gas: 1.040 • Electricity: 3.000
Appartement
Gas: 700 • Electricity: 1.810
Tussenwoning
Gas: 780 • Electricity: 2.260
Vrijstaande woning
Gas: 1.440 • Electricity: 3.760
Twee-onder-één-kap woning
Gas: 970 • Electricity: 2.900
Total number of company establishments: 1.090
| Period | Crimes |
|---|---|
| jan 2026 | 14 |
| jul 2025 | 22 |
| jun 2025 | 14 |
| mei 2025 | 16 |
| mrt 2025 | 24 |
| mrt 2026 | 16 |
| nov 2024 | 16 |
| nov 2025 | 23 |
| okt 2024 | 25 |
| okt 2025 | 34 |
| sep 2024 | 11 |
| sep 2025 | 29 |
These figures give an indicative picture of safety trends in the living environment of Eerbeek.
Short answers based on current local statistics, handy for a quick comparison of the living environment.
Eerbeek telt in 2026 ongeveer 10.232 inwoners.
De gemiddelde WOZ-waarde in Eerbeek is in 2025 circa € 380.000.
Het gemiddelde inkomen per inwoner in Eerbeek ligt rond € 35.000 per jaar.
Voor het huidige jaar gaat het om ongeveer 255 geregistreerde misdrijven. Gebruik deze cijfers als indicatie en vergelijk trends per periode.
In Eerbeek komt vooral "Tussenwoningen" veel voor, met ongeveer 1.499 woningen.