- Sold
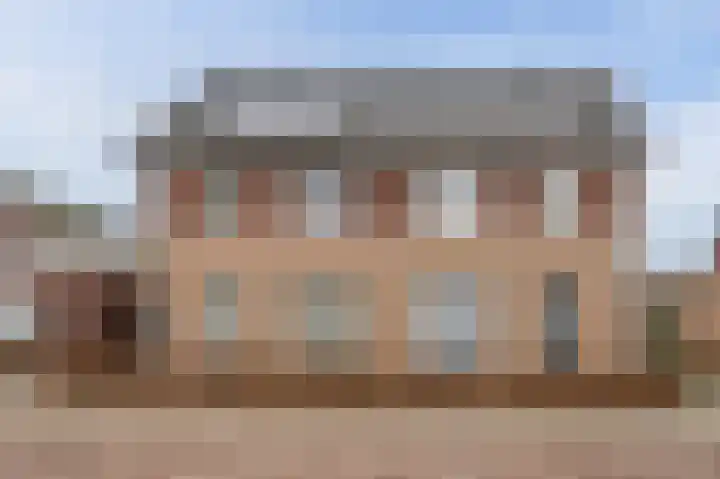
Burgemeester Verheijenstraat 3
5469HD Erp
€ 595.000 k.k.
€ 4.047/m²
- Living area
- 147 m²
- Land area
- 348 m²
- Bedrooms
- 4
View 38 sold houses in Erp
Type to search. Use arrow down and arrow up to navigate through results and press Enter to open.
Hidden search suggestions.
Compare sold homes in Erp or view the current offering in this location directly.
On this page you will find recently sold homes in Erp. Use this overview to better estimate selling prices, popular neighborhoods, and the local housing supply before you choose a real estate agent. Also view the current housing supply with 66 houses in Erp.
5469HD Erp
€ 595.000 k.k.
€ 4.047/m²
5469GN Erp
€ 575.000 k.k.
€ 3.709/m²
5469PN Erp
€ 725.000 k.k.
€ 5.034/m²
5469EV Erp
€ 695.000 k.k.
€ 3.075/m²
5469SL Erp
€ 545.000 k.k.
€ 4.067/m²
5469TR Erp
€ 385.000 k.k.
€ 3.598/m²
5469HK Erp
€ 749.000 k.k.
€ 4.770/m²
5469AN Erp
€ 370.000 k.k.
€ 4.157/m²
5469NG Erp
€ 700.000 k.k.
€ 4.093/m²
5469BE Erp
€ 420.000 k.k.
€ 3.818/m²
5469ST Erp
€ 910.000 k.k.
€ 2.660/m²
5469HD Erp
€ 480.000 k.k.
€ 4.705/m²
5469BG Erp
€ 495.000 k.k.
€ 4.419/m²
5469HH Erp
€ 595.000 k.k.
€ 4.160/m²
5469HK Erp
€ 510.000 k.k.
€ 4.112/m²
5469SE Erp
€ 1.325.000 k.k.
€ 3.271/m²
5469SH Erp
€ 515.000 k.k.
€ 3.652/m²
5469BM Erp
€ 769.000 k.k.
€ 2.806/m²
5469WC Erp
€ 775.000 k.k.
€ 3.934/m²
5469GC Erp
€ 415.000 k.k.
€ 4.414/m²
5469WC Erp
€ 750.000 k.k.
€ 4.658/m²
5469PS Erp
€ 495.000 k.k.
€ 3.413/m²
5469BA Erp
€ 325.000 k.k.
€ 3.532/m²
5469BG Erp
€ 489.000 k.k.
€ 3.622/m²
5469AA Erp
€ 1.295.000 k.k.
€ 4.942/m²
5469TC Erp
€ 689.000 k.k.
€ 0/m²
5469PZ Erp
€ 725.000 k.k.
€ 0/m²
5469KC Erp
€ 785.000 k.k.
€ 3.720/m²
Get free quotes from realtors with local market knowledge in Erp.
Selling a home in Erp? Compare real estate agents who know the local housing market. Also check out all real estate agents in Erp or the top 10 real estate agents in Erp for extra context for your choice.
By comparing brokers and requesting quotes
Short answers about housing prices, sold homes and comparing real estate agents in Erp.
The costs of a real estate agent in Erp vary per office, property type and sales approach. Therefore, compare multiple quotes and also look at the real estate agents in Erp to better compare rates, presentation and local experience.
On this page we currently show 38 sold houses in Erp from our selection. This helps you to better assess recent transactions and the local housing market.
Houses sold in Erp give insight into asking prices, house types and neighborhoods where recent transactions have taken place. Compare this also with the current housing stock in Erp to better understand the market.
You can use sold homes as a first market indication, but a local real estate agent can better take into account finishing, location, maintenance and current demand in Erp.
Compare realtors in Erp on local sales experience, reviews, expected yield, commission and marketing approach. The top 10 realtors in Erp helps to quickly discover strong offices.
View current location data on residents, WOZ development, housing stock, energy consumption, business activity and safety in Erp. In 2025 were there 7.365 residents. The average WOZ value in 2025 is EUR 482.000.
These figures help to better assess and compare the housing stock in Erp with recent sold homes. Orient yourself then on suitable top real estate agents in Erp for sales advice in this region.
Residents
7.365
Last year: 2025
Average WOZ
EUR 482.000
Last year: 2025
Average income per person.
EUR 33.000
Source: AllNumbers
Crimes (current year)
205
Total registered
| Year | Residents |
|---|---|
| 2021 | 7.000 |
| 2022 | 7.075 |
| 2023 | 7.260 |
| 2024 | 7.310 |
| 2025 | 7.365 |
| Year | Average WOZ |
|---|---|
| 2021 | EUR 354.000 |
| 2022 | EUR 386.000 |
| 2023 | EUR 441.000 |
| 2024 | EUR 455.000 |
| 2025 | EUR 482.000 |
Hoger
1.390
Praktisch
1.460
Middelbaar
2.620
Europa
405
Nederland
6.620
Buiten Europa
345
Label C
700
Label A
683
Label B
461
Label D
320
Label G
284
Label F
223
Label A+
113
Label E
101
Label A+++
97
Label A++
41
Label A++++
25
Label A+++++
1
| Year | Gas (m3) | Electricity (kWh) |
|---|---|---|
| 2020 | 1.580 | 3.720 |
| 2021 | 1.740 | 3.790 |
| 2022 | 1.350 | 3.540 |
| 2023 | 1.100 | 3.370 |
| 2024 | 1.040 | 3.410 |
Hoekwoning
Gas: 930 • Electricity: 2.910
Huurwoning
Gas: 840 • Electricity: 2.420
Koopwoning
Gas: 1.170 • Electricity: 3.630
Appartement
Gas: 580 • Electricity: 1.930
Tussenwoning
Gas: 840 • Electricity: 2.520
Vrijstaande woning
Gas: 1.330 • Electricity: 4.110
Twee-onder-één-kap woning
Gas: 1.140 • Electricity: 3.350
Total number of company establishments: 1.120
| Period | Crimes |
|---|---|
| jan 2025 | 9 |
| jan 2026 | 11 |
| jul 2025 | 9 |
| jun 2025 | 62 |
| mei 2025 | 16 |
| mrt 2025 | 11 |
| nov 2024 | 11 |
| nov 2025 | 10 |
| okt 2024 | 18 |
| okt 2025 | 17 |
| sep 2024 | 11 |
| sep 2025 | 17 |
These figures give an indicative picture of safety trends in the living environment of Erp.
Short answers based on current local statistics, handy for a quick comparison of the living environment.
Erp telt in 2025 ongeveer 7.365 inwoners.
De gemiddelde WOZ-waarde in Erp is in 2025 circa € 482.000.
Het gemiddelde inkomen per inwoner in Erp ligt rond € 33.000 per jaar.
Voor het huidige jaar gaat het om ongeveer 205 geregistreerde misdrijven. Gebruik deze cijfers als indicatie en vergelijk trends per periode.
In Erp komt vooral "Vrijstaande woningen" veel voor, met ongeveer 1.335 woningen.