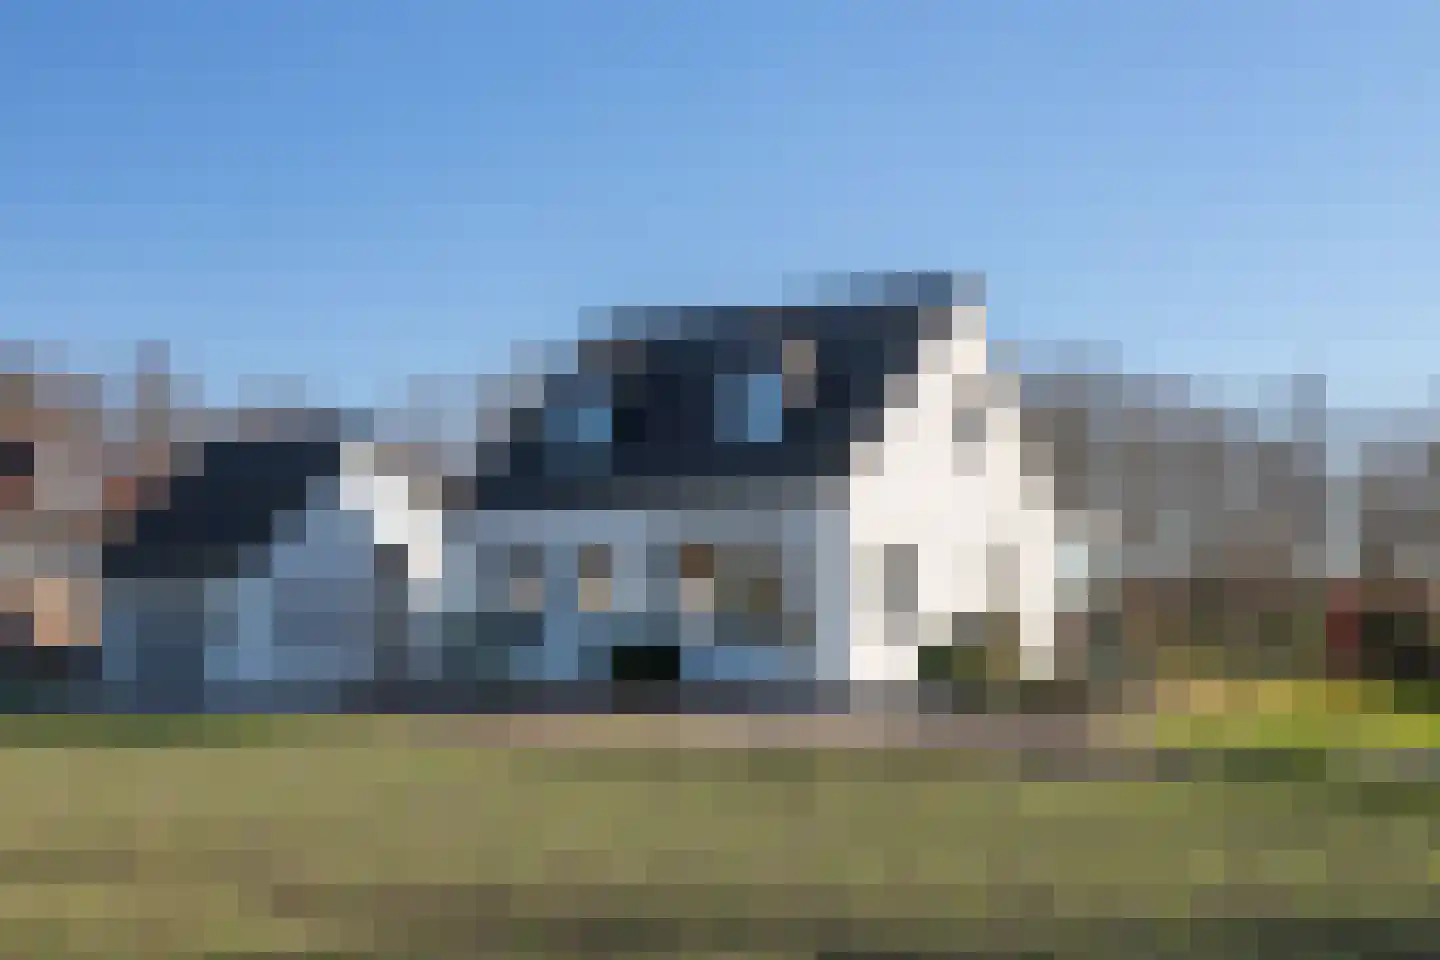
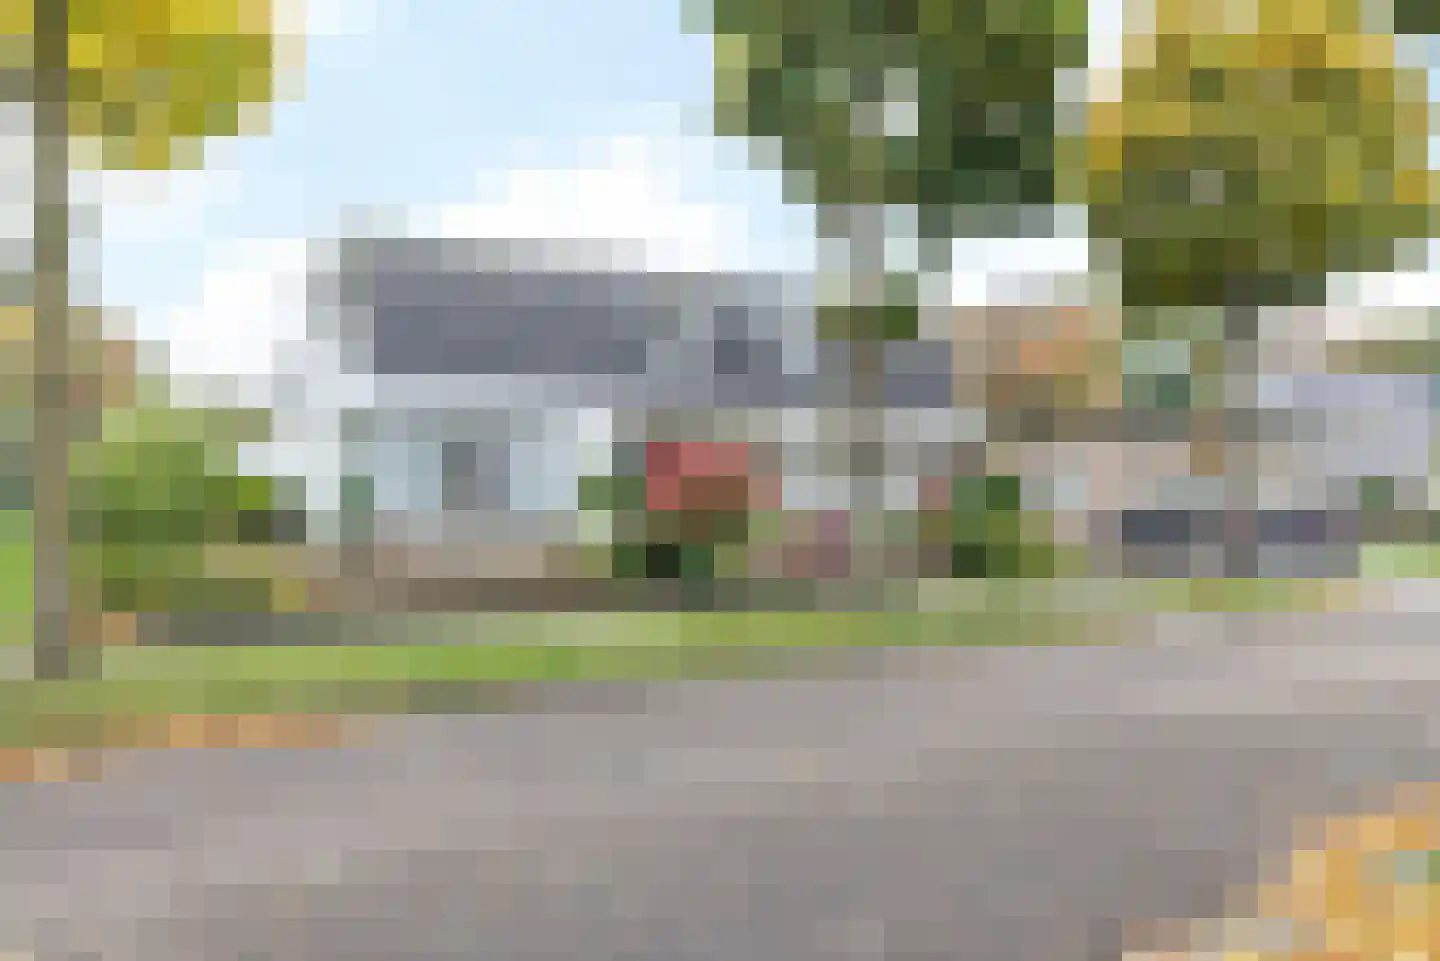
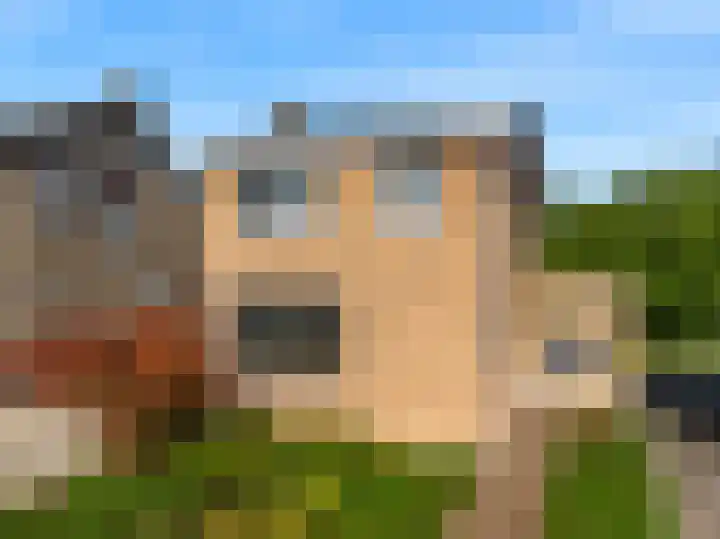
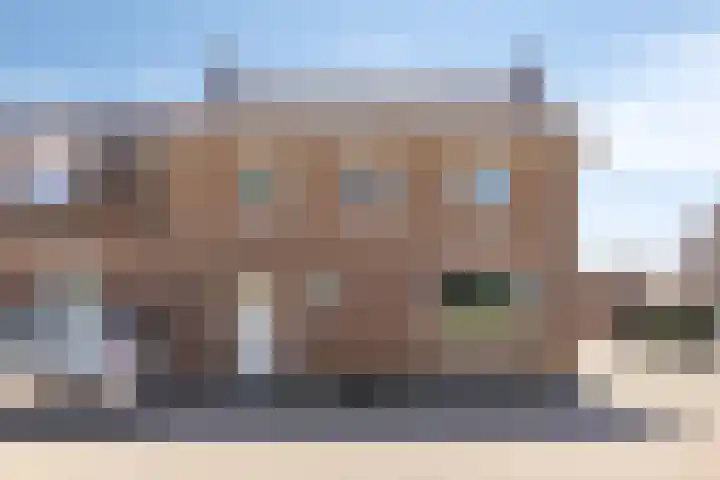
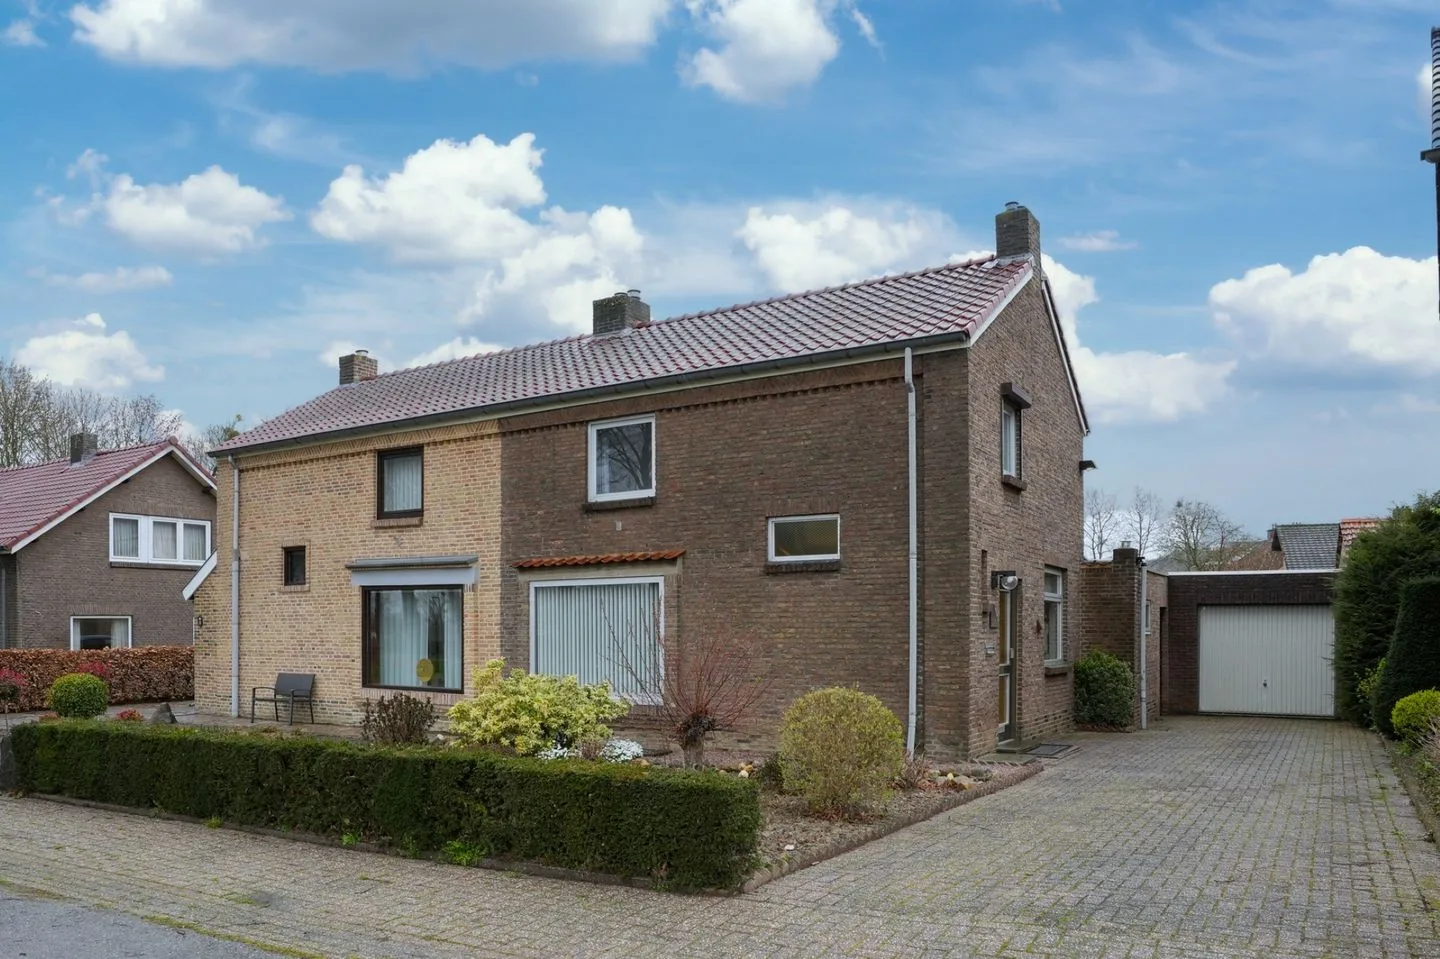
Houses sold in Geulle

View 27 sold houses in Geulle

Connected to: Vastgoed Nederland NVM Makelaars

On this page you will find recently sold homes in Geulle. Use this overview to better estimate selling prices, popular neighborhoods, and the local housing supply before you choose a real estate agent. Also view the current housing supply with 31 houses in Geulle.

Selection

Search and filter homes

Set your preferences and discover homes that suit you.

Total supply 242.717
Filters

Set price, area and other characteristics. Adjust a filter or click on Show homes. Location changes directly above.

Reset filters

You search for

  • Place Geulle
  • Status Sold

Huis verkopen in Geulle? Vergelijk verkoopmakelaars

Bekijk recente verkopen en ontvang gratis offertes van lokale makelaars. Vergelijk meer dan 111 makelaars in Geulle.

Free request a quote

  • Quotes in Geulle
  • Non-binding
  • Personal
  • Gratis tarieven vergelijken

Zelf je woning verkopen in Geulle? Vergelijk verkoopmakelaars in Geulle of bekijk de beste verkoopmakelaars in Geulle als referentie bij jouw keuze.

Vergelijk meerdere offertes

Makelaars maken scherpere voorstellen als ze weten dat je vergelijkt — vraag offertes aan voor verkoop of aankoop.

Frequently asked questions about sold homes in Geulle

Short answers about housing prices, sold homes and comparing real estate agents in Geulle.

Residential and neighborhood statistics in Geulle

View current location data on residents, WOZ development, housing stock, energy consumption, business activity and safety in Geulle. In 2026 were there 2.496 residents. The average WOZ value in 2025 is EUR 360.208.

These figures help to better assess and compare the housing stock in Geulle with recent sold homes. Orient yourself then on suitable top real estate agents in Geulle for sales advice in this region.

Residents

2.496

Last year: 2026

Average WOZ

EUR 360.208

Last year: 2025

Average income per person.

EUR 32

Source: AllNumbers

Crimes (current year)

31

Total registered

Demographics and WOZ development

Inhabitants per year

Inhabitants per year in Geulle
Year Residents
2021 2.537
2022 2.506
2023 2.512
2024 2.491
2025 2.514
2026 2.496

Annual WOZ value

WOZ value per year in Geulle
Year Average WOZ
2021 EUR 279.229
2022 EUR 295.717
2023 EUR 347.054
2024 EUR 340.834
2025 EUR 360.208

Composition of residents

Age build-up

65+: 842 0-15: 254 15-25: 204 25-45: 454 45-65: 698

Education level

Hoger

446

Praktisch

430

Middelbaar

733

Origin of residents (2025)

Europa

189

Nederland

2.239

Buiten Europa

91

Housing stock and construction periods

Types of homes

Hoekwoningen 105
Appartementen 193
Tussenwoningen 121
Vrijstaande woningen 452
Twee-onder-één-kap woningen 346

Construction period of buildings

Voor 1700 2
1700 tot 1900 67
1900 tot 1925 73
1925 tot 1950 160
1950 tot 1970 363
1970 tot 1980 229
1980 tot 1990 122
1990 tot 2000 50
2000 tot 2010 31
2010 tot 2020 7
2020 en later 12

Energy and sustainability

Energy label distribution

Label C

256

Label G

184

Label D

182

Label F

171

Label A

150

Label B

112

Label E

74

Label A++

3

Label A+

2

Label A+++

1

Label A++++

0

Label A+++++

0

Average energy consumption per year

Average energy consumption per year in Geulle
Year Gas (m3) Electricity (kWh)
2020 1.555 3.243
2021 1.767 3.329
2022 1.378 3.164
2023 1.116 2.992
2024 1.052 3.073

Consumption per house type

Hoekwoning

Gas: 1.093 • Electricity: 2.828

Huurwoning

Gas: 847 • Electricity: 2.010

Koopwoning

Gas: 1.191 • Electricity: 3.242

Appartement

Gas: 760 • Electricity: 1.991

Tussenwoning

Gas: 872 • Electricity: 2.700

Vrijstaande woning

Gas: 1.374 • Electricity: 3.715

Twee-onder-één-kap woning

Gas: 1.097 • Electricity: 2.871

Business activity in Geulle (2025)

Handel en HORECA 48
Nijverheid en energie 43
Zakelijke dienstverlening 75
Overheid, onderwijs en zorg 65
Landbouw, bosbouw en visserij 7
Vervoer, informatie en communicatie 10
Financiele diensten en onroerendgoed 10
Cultuur, recreatie en overige diensten 53

Total number of company establishments: 315

Recent crime statistics

Recent crime statistics in Geulle
Period Crimes
jan 2026 4
jul 2025 4
jun 2025 1
mei 2025 2
mrt 2025 2
mrt 2026 3
nov 2024 1
nov 2025 4
okt 2024 4
okt 2025 2
sep 2024 0
sep 2025 3

These figures give an indicative picture of safety trends in the living environment of Geulle.

Frequently asked questions about living in Geulle

Short answers based on current local statistics, handy for a quick comparison of the living environment.

Hoeveel inwoners heeft Geulle?

Geulle telt in 2026 ongeveer 2.496 inwoners.

Wat is de gemiddelde WOZ-waarde in Geulle?

De gemiddelde WOZ-waarde in Geulle is in 2025 circa € 360.208.

Wat is het gemiddelde inkomen per inwoner in Geulle?

Het gemiddelde inkomen per inwoner in Geulle ligt rond € 32 per jaar.

Hoe veilig is wonen in Geulle?

Voor het huidige jaar gaat het om ongeveer 31 geregistreerde misdrijven. Gebruik deze cijfers als indicatie en vergelijk trends per periode.

Welke woningtypen komen het meest voor in Geulle?

In Geulle komt vooral "Vrijstaande woningen" veel voor, met ongeveer 452 woningen.

Receive free, non-binding quotes

Compare multiple real estate agents and choose the best match.