- Sold
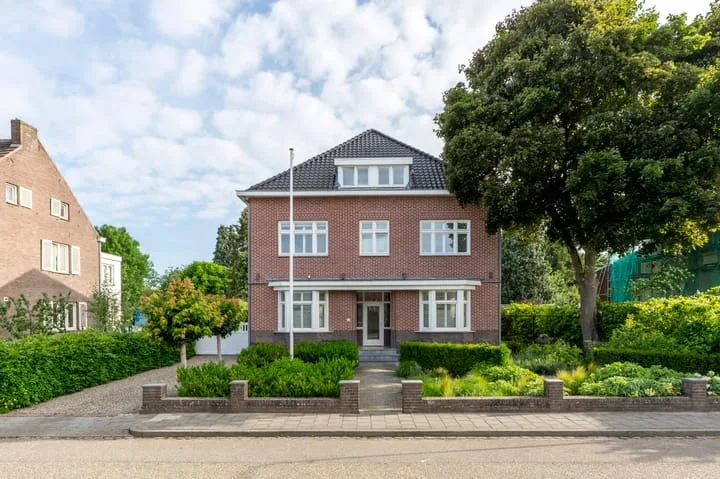
Hennemettenstraat 5 D
6247BT Gronsveld
Price upon request
- Living area
- 111 m²
- Land area
- —
- Bedrooms
- 3
View 31 sold houses in Gronsveld
Type to search. Use arrow down and arrow up to navigate through results and press Enter to open.
Hidden search suggestions.
Compare sold homes in Gronsveld or view the current offering in this location directly.
On this page you will find recently sold homes in Gronsveld. Use this overview to better estimate selling prices, popular neighborhoods, and the local housing supply before you choose a real estate agent. Also view the current housing supply with 49 houses in Gronsveld.
6247BT Gronsveld
Price upon request
6247BZ Gronsveld
€ 429.000 k.k.
€ 3.250/m²
6247CE Gronsveld
Price upon request
6247BW Gronsveld
€ 329.000 k.k.
€ 4.272/m²
6247AH Gronsveld
Price upon request
6247BP Gronsveld
Price upon request
6247BL Gronsveld
€ 995.000 k.k.
€ 3.712/m²
6247CK Gronsveld
€ 499.000 k.k.
€ 3.868/m²
6247CT Gronsveld
Price upon request
6247AR Gronsveld
€ 269.000 k.k.
€ 3.320/m²
6247AT Gronsveld
€ 779.000 k.k.
€ 2.339/m²
6247BX Gronsveld
Price upon request
6247CG Gronsveld
€ 399.000 k.k.
€ 3.439/m²
6247BJ Gronsveld
Price upon request
6247CS Gronsveld
Price upon request
6247EJ Gronsveld
Price upon request
6247CT Gronsveld
Price upon request
6247AZ Gronsveld
€ 379.000 k.k.
€ 3.081/m²
6247AR Gronsveld
€ 299.000 k.k.
€ 4.462/m²
6247CV Gronsveld
€ 550.000 k.k.
€ 2.722/m²
6247AN Gronsveld
€ 395.000 k.k.
€ 2.581/m²
6247EX Gronsveld
€ 369.000 k.k.
€ 3.481/m²
6247AM Gronsveld
€ 550.000 k.k.
€ 4.365/m²
6247NB Gronsveld
€ 324.750
€ 4.775/m²
6247NB Gronsveld
€ 449.750
€ 4.888/m²
6247EK Gronsveld
€ 509.000 k.k.
€ 3.827/m²
6247DA Gronsveld
€ 399.000 k.k.
€ 3.500/m²
6247AP Gronsveld
€ 600.000 k.k.
€ 3.636/m²
Get free quotes from realtors with local market knowledge in Gronsveld.
Selling a home in Gronsveld? Compare real estate agents who know the local housing market. Also check out all real estate agents in Gronsveld or the top 10 real estate agents in Gronsveld for extra context for your choice.
By comparing brokers and requesting quotes
Short answers about housing prices, sold homes and comparing real estate agents in Gronsveld.
The costs of a real estate agent in Gronsveld vary per office, property type and sales approach. Therefore, compare multiple quotes and also look at the real estate agents in Gronsveld to better compare rates, presentation and local experience.
On this page we currently show 31 sold houses in Gronsveld from our selection. This helps you to better assess recent transactions and the local housing market.
Verkochte woningen in Gronsveld geven inzicht in vraagprijzen, woningtypes en buurten waar recent transacties hebben plaatsgevonden. Vergelijk dit ook met het actuele woningaanbod in Gronsveld om de markt beter te duiden.
Je kunt verkochte woningen gebruiken als eerste marktindicatie, maar een lokale makelaar kan beter rekening houden met afwerking, ligging, onderhoud en actuele vraag in Gronsveld.
Vergelijk makelaars in Gronsveld op lokale verkoopervaring, reviews, verwachte opbrengst, courtage en marketingaanpak. De top 10 makelaars in Gronsveld helpt om snel sterke kantoren te ontdekken.
View current location data on residents, WOZ development, housing stock, energy consumption, business activity and safety in Gronsveld. In 2026 were there 3.056 residents. The average WOZ value in 2025 is EUR 386.000.
These figures help to better assess and compare the housing stock in Gronsveld with recent sold homes. Orient yourself then on suitable top real estate agents in Gronsveld for sales advice in this region.
Residents
3.056
Last year: 2026
Average WOZ
EUR 386.000
Last year: 2025
Average income per person.
EUR 38.600
Source: AllNumbers
Crimes (current year)
89
Total registered
| Year | Residents |
|---|---|
| 2021 | 2.915 |
| 2022 | 2.865 |
| 2023 | 2.845 |
| 2024 | 2.890 |
| 2025 | 2.990 |
| 2026 | 3.056 |
| Year | Average WOZ |
|---|---|
| 2021 | EUR 296.000 |
| 2022 | EUR 309.000 |
| 2023 | EUR 367.000 |
| 2024 | EUR 374.000 |
| 2025 | EUR 386.000 |
Hoger
790
Praktisch
430
Middelbaar
940
Europa
335
Nederland
2.490
Buiten Europa
170
Label C
356
Label B
221
Label D
199
Label F
191
Label A
169
Label G
163
Label A+
83
Label E
76
Label A++
57
Label A+++
35
Label A++++
13
Label A+++++
0
| Year | Gas (m3) | Electricity (kWh) |
|---|---|---|
| 2020 | 1.580 | 3.270 |
| 2021 | 1.820 | 3.290 |
| 2022 | 1.430 | 3.100 |
| 2023 | 1.170 | 2.980 |
| 2024 | 1.110 | 3.050 |
Hoekwoning
Gas: 1.020 • Electricity: 2.840
Huurwoning
Gas: 1.000 • Electricity: 2.130
Koopwoning
Gas: 1.200 • Electricity: 3.160
Appartement
Gas: 1.010 • Electricity: 2.100
Tussenwoning
Gas: 1.030 • Electricity: 2.770
Vrijstaande woning
Gas: 1.440 • Electricity: 3.470
Twee-onder-één-kap woning
Gas: 1.160 • Electricity: 2.980
Total number of company establishments: 420
| Period | Crimes |
|---|---|
| jan 2026 | 7 |
| jul 2025 | 14 |
| jun 2025 | 10 |
| mei 2025 | 7 |
| mrt 2025 | 5 |
| mrt 2026 | 7 |
| nov 2024 | 4 |
| nov 2025 | 8 |
| okt 2024 | 13 |
| okt 2025 | 7 |
| sep 2024 | 6 |
| sep 2025 | 3 |
These figures give an indicative picture of safety trends in the living environment of Gronsveld.
Short answers based on current local statistics, handy for a quick comparison of the living environment.
Gronsveld telt in 2026 ongeveer 3.056 inwoners.
De gemiddelde WOZ-waarde in Gronsveld is in 2025 circa € 386.000.
Het gemiddelde inkomen per inwoner in Gronsveld ligt rond € 38.600 per jaar.
Voor het huidige jaar gaat het om ongeveer 89 geregistreerde misdrijven. Gebruik deze cijfers als indicatie en vergelijk trends per periode.
In Gronsveld komt vooral "Tussenwoningen" veel voor, met ongeveer 413 woningen.