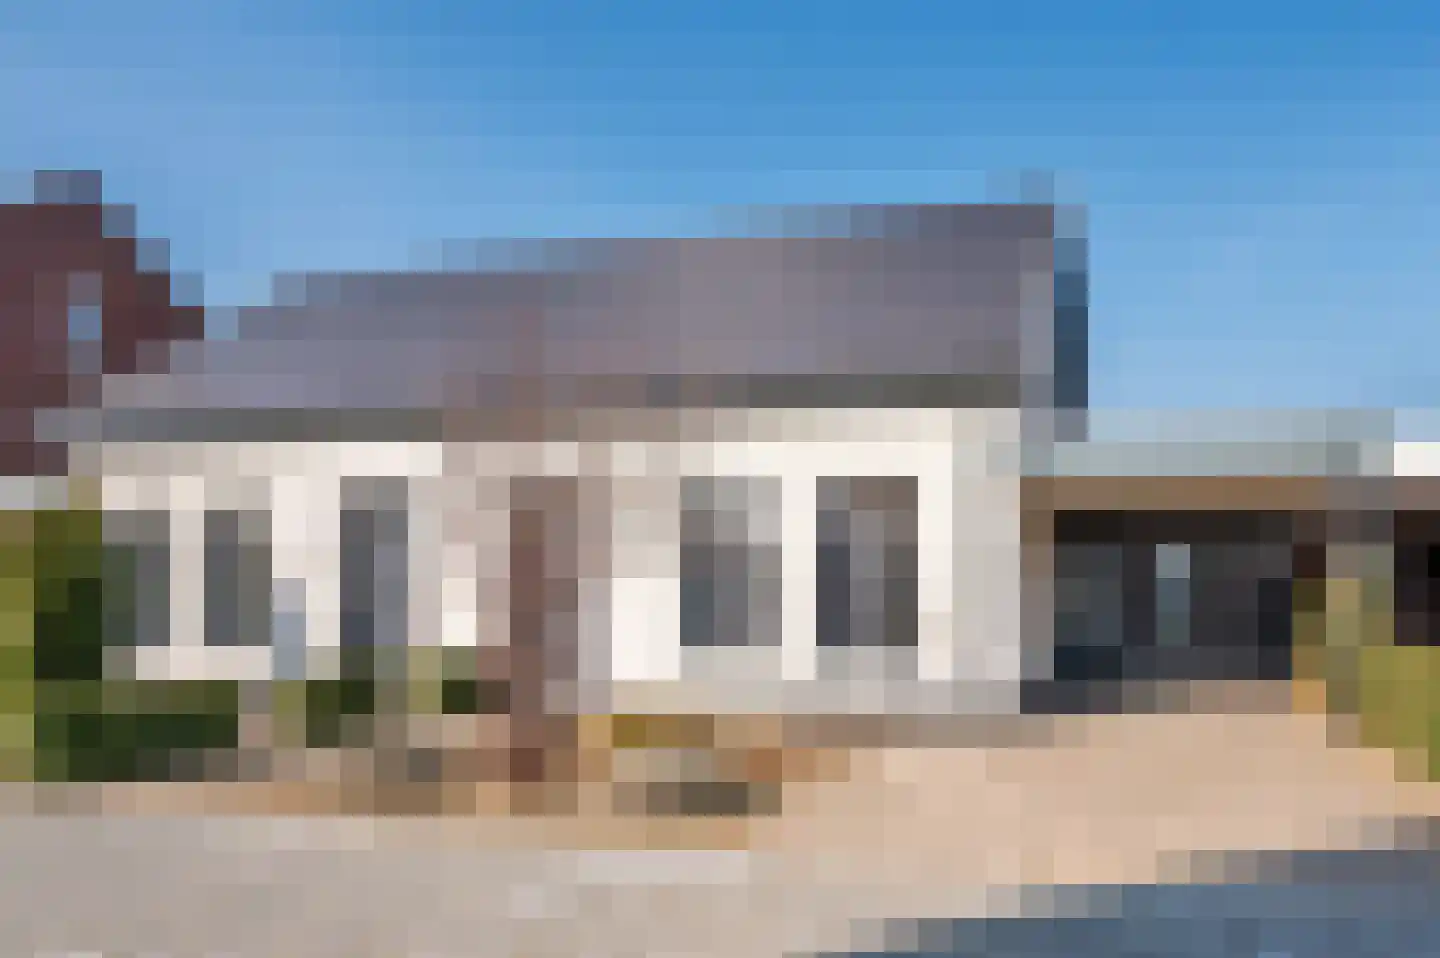
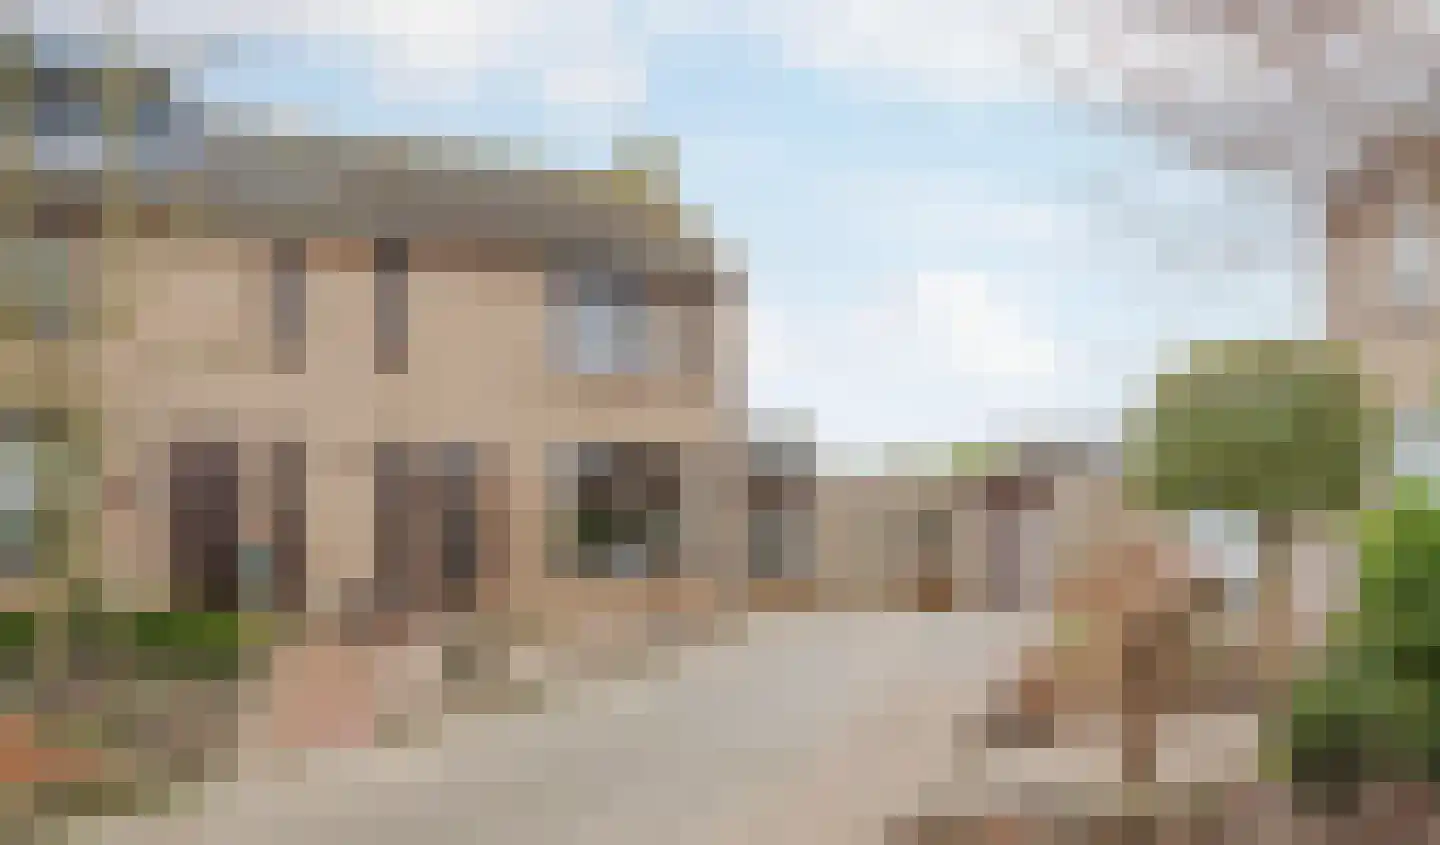
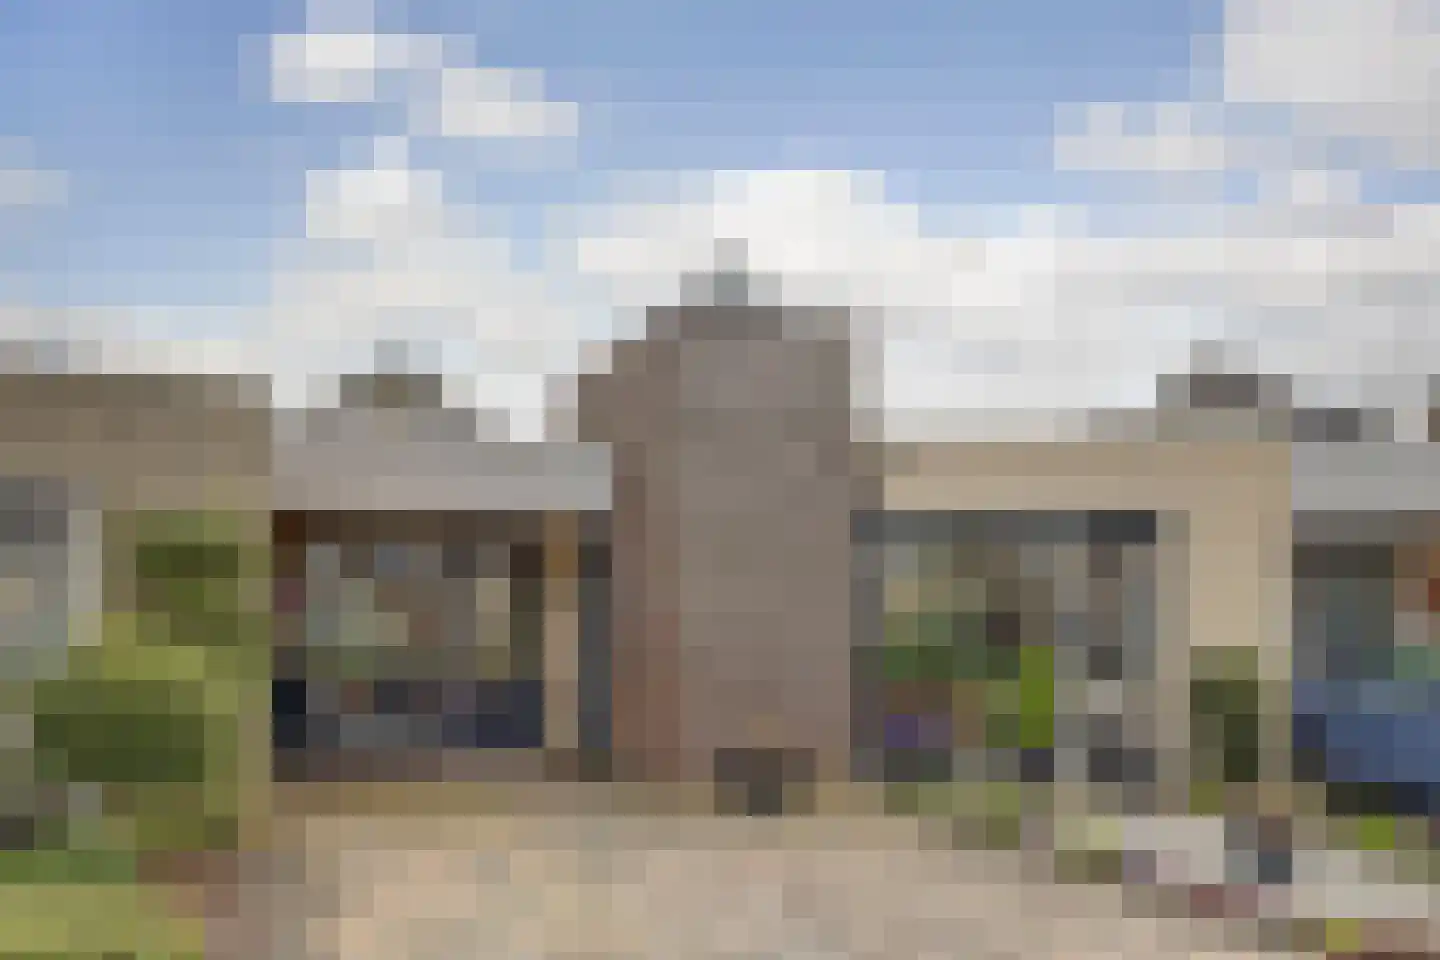
Houses sold in Grubbenvorst

View 53 sold houses in Grubbenvorst

Connected to: Vastgoed Nederland NVM Makelaars

On this page you will find recently sold homes in Grubbenvorst. Use this overview to better estimate selling prices, popular neighborhoods, and the local housing supply before you choose a real estate agent. Also view the current housing supply with 77 houses in Grubbenvorst.

Selection

Search and filter homes

Set your preferences and discover homes that suit you.

Total supply 241.450
Filters

Set price, area and other characteristics. Adjust a filter or click on Show homes. Location changes directly above.

Reset filters

You search for

  • Place Grubbenvorst
  • Status Sold

Huis verkopen in Grubbenvorst? Vergelijk verkoopmakelaars

Bekijk recente verkopen en ontvang gratis offertes van lokale verkoopmakelaars in Grubbenvorst.

Free request a quote

  • Quotes in Grubbenvorst
  • Non-binding
  • Personal
  • Gratis tarieven vergelijken

Zelf je woning verkopen in Grubbenvorst? Vergelijk verkoopmakelaars in Grubbenvorst of bekijk de beste verkoopmakelaars in Grubbenvorst als referentie bij jouw keuze.

Vergelijk meerdere offertes

Makelaars maken scherpere voorstellen als ze weten dat je vergelijkt — vraag offertes aan voor verkoop of aankoop.

Frequently asked questions about sold homes in Grubbenvorst

Short answers about housing prices, sold homes and comparing real estate agents in Grubbenvorst.

Residential and neighborhood statistics in Grubbenvorst

View current location data on residents, WOZ development, housing stock, energy consumption, business activity and safety in Grubbenvorst. In 2025 were there 4.920 residents. The average WOZ value in 2025 is EUR 341.000.

These figures help to better assess and compare the housing stock in Grubbenvorst with recent sold homes. Orient yourself then on suitable top real estate agents in Grubbenvorst for sales advice in this region.

Residents

4.920

Last year: 2025

Average WOZ

EUR 341.000

Last year: 2025

Average income per person.

EUR 33.300

Source: AllNumbers

Crimes (current year)

138

Total registered

Demographics and WOZ development

Inhabitants per year

Inhabitants per year in Grubbenvorst
Year Residents
2021 4.790
2022 4.810
2023 4.855
2024 4.885
2025 4.920

Annual WOZ value

WOZ value per year in Grubbenvorst
Year Average WOZ
2021 EUR 253.000
2022 EUR 269.000
2023 EUR 299.000
2024 EUR 318.000
2025 EUR 341.000

Composition of residents

Age build-up

65+: 1.350 0-15: 665 15-25: 460 25-45: 1.090 45-65: 1.355

Education level

Hoger

930

Praktisch

860

Middelbaar

1.730

Origin of residents (2025)

Europa

740

Nederland

3.875

Buiten Europa

300

Housing stock and construction periods

Types of homes

Hoekwoningen 391
Appartementen 328
Tussenwoningen 669
Vrijstaande woningen 565
Twee-onder-één-kap woningen 361

Construction period of buildings

Voor 1700 3
1700 tot 1900 45
1900 tot 1925 47
1925 tot 1950 93
1950 tot 1970 607
1970 tot 1980 564
1980 tot 1990 287
1990 tot 2000 206
2000 tot 2010 220
2010 tot 2020 70
2020 en later 129

Energy and sustainability

Energy label distribution

Label C

576

Label D

405

Label A

401

Label B

381

Label F

143

Label G

105

Label E

72

Label A+++

43

Label A+

38

Label A++

15

Label A++++

8

Label A+++++

0

Average energy consumption per year

Average energy consumption per year in Grubbenvorst
Year Gas (m3) Electricity (kWh)
2020 1.420 3.210
2021 1.600 3.260
2022 1.240 3.060
2023 1.020 2.950
2024 1.000 3.020

Consumption per house type

Hoekwoning

Gas: 1.020 • Electricity: 2.800

Huurwoning

Gas: 810 • Electricity: 2.140

Koopwoning

Gas: 1.080 • Electricity: 3.180

Appartement

Gas: 600 • Electricity: 1.740

Tussenwoning

Gas: 910 • Electricity: 2.580

Vrijstaande woning

Gas: 1.360 • Electricity: 4.060

Twee-onder-één-kap woning

Gas: 1.050 • Electricity: 3.000

Business activity in Grubbenvorst (2025)

Handel en HORECA 85
Nijverheid en energie 85
Zakelijke dienstverlening 120
Overheid, onderwijs en zorg 85
Landbouw, bosbouw en visserij 30
Vervoer, informatie en communicatie 40
Financiele diensten en onroerendgoed 35
Cultuur, recreatie en overige diensten 80

Total number of company establishments: 565

Recent crime statistics

Recent crime statistics in Grubbenvorst
Period Crimes
jan 2025 13
jan 2026 13
jul 2025 8
jun 2025 13
mei 2025 15
mrt 2025 7
nov 2024 14
nov 2025 9
okt 2024 16
okt 2025 14
sep 2024 9
sep 2025 6

These figures give an indicative picture of safety trends in the living environment of Grubbenvorst.

Frequently asked questions about living in Grubbenvorst

Short answers based on current local statistics, handy for a quick comparison of the living environment.

Hoeveel inwoners heeft Grubbenvorst?

Grubbenvorst telt in 2025 ongeveer 4.920 inwoners.

Wat is de gemiddelde WOZ-waarde in Grubbenvorst?

De gemiddelde WOZ-waarde in Grubbenvorst is in 2025 circa € 341.000.

Wat is het gemiddelde inkomen per inwoner in Grubbenvorst?

Het gemiddelde inkomen per inwoner in Grubbenvorst ligt rond € 33.300 per jaar.

Hoe veilig is wonen in Grubbenvorst?

Voor het huidige jaar gaat het om ongeveer 138 geregistreerde misdrijven. Gebruik deze cijfers als indicatie en vergelijk trends per periode.

Welke woningtypen komen het meest voor in Grubbenvorst?

In Grubbenvorst komt vooral "Tussenwoningen" veel voor, met ongeveer 669 woningen.

Gratis vrijblijvende offertes ontvangen

Vergelijk meerdere makelaars en kies de beste match.