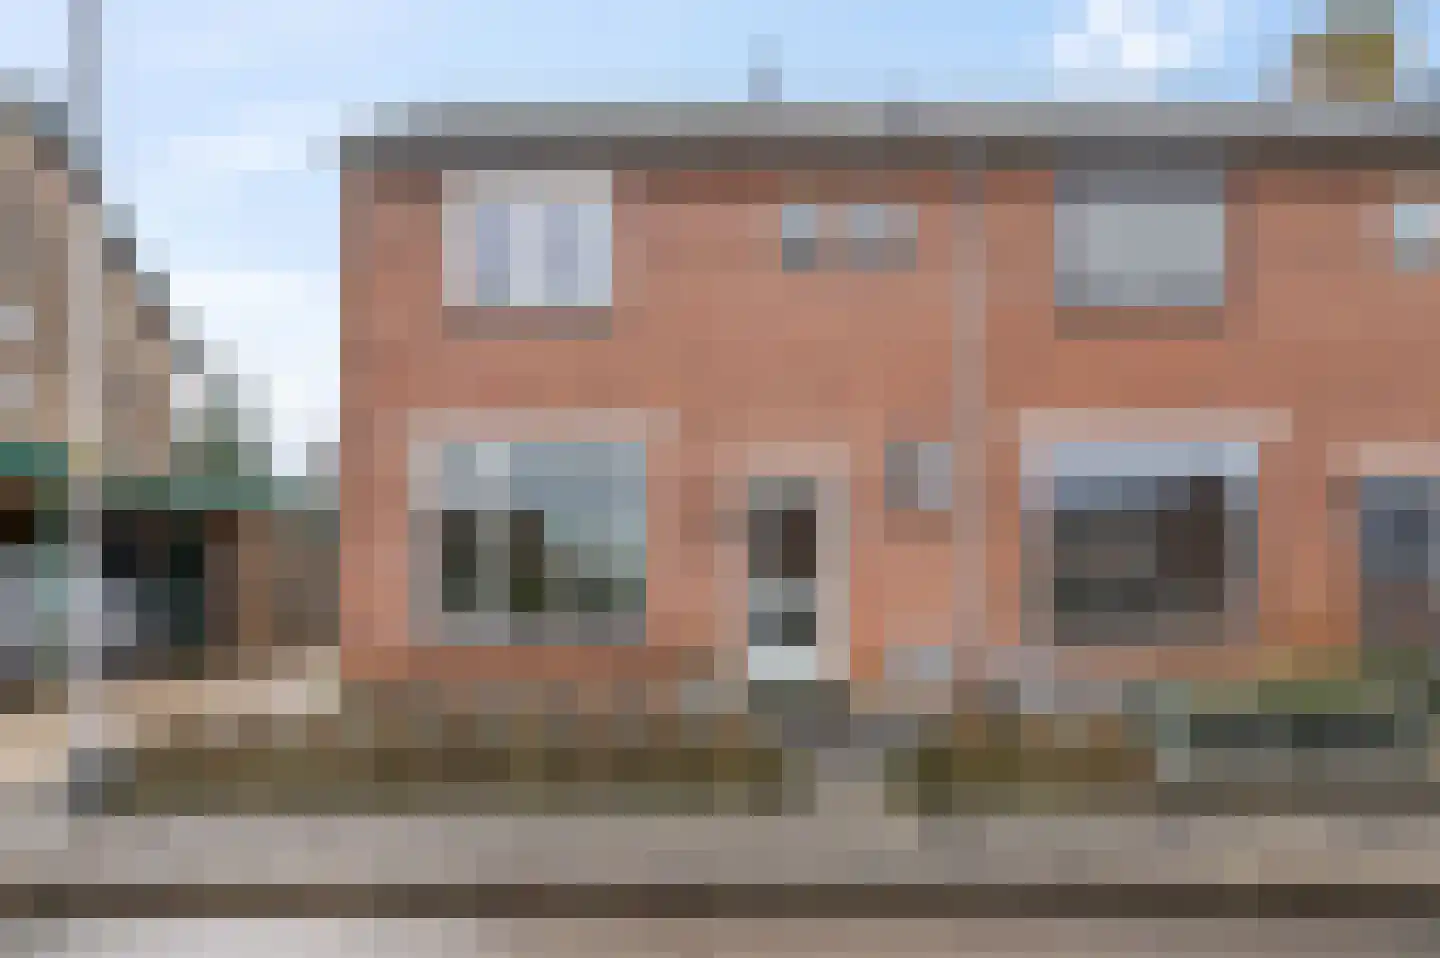
Houses sold in Haalderen

View 11 sold houses in Haalderen

Connected to: Vastgoed Nederland NVM Makelaars

On this page you will find recently sold homes in Haalderen. Use this overview to better estimate selling prices, popular neighborhoods, and the local housing supply before you choose a real estate agent. Also view the current housing supply with 14 houses in Haalderen.

Selection

Search and filter homes

Set your preferences and discover homes that suit you.

Total supply 242.874
Filters

Set price, area and other characteristics. Adjust a filter or click on Show homes. Location changes directly above.

Reset filters

You search for

  • Place Haalderen
  • Status Sold

Huis verkopen in Haalderen? Vergelijk verkoopmakelaars

Bekijk recente verkopen en ontvang gratis offertes van lokale makelaars. Vergelijk meer dan 84 makelaars in Haalderen.

Free request a quote

  • Quotes in Haalderen
  • Non-binding
  • Personal
  • Compare free rates

Zelf je woning verkopen in Haalderen? Vergelijk verkoopmakelaars in Haalderen of bekijk de beste verkoopmakelaars in Haalderen als referentie bij jouw keuze.

Vergelijk meerdere offertes

Makelaars maken scherpere voorstellen als ze weten dat je vergelijkt — vraag offertes aan voor verkoop of aankoop.

Frequently asked questions about sold homes in Haalderen

Short answers about housing prices, sold homes and comparing real estate agents in Haalderen.

Residential and neighborhood statistics in Haalderen

View current location data on residents, WOZ development, housing stock, energy consumption, business activity and safety in Haalderen. In 2026 were there 2.069 residents. The average WOZ value in 2025 is EUR 396.000.

These figures help to better assess and compare the housing stock in Haalderen with recent sold homes. Orient yourself then on suitable top real estate agents in Haalderen for sales advice in this region.

Residents

2.069

Last year: 2026

Average WOZ

EUR 396.000

Last year: 2025

Average income per person.

EUR 30.400

Source: AllNumbers

Crimes (current year)

30

Total registered

Demographics and WOZ development

Inhabitants per year

Inhabitants per year in Haalderen
Year Residents
2021 2.052
2022 2.060
2023 2.065
2024 2.070
2025 2.065
2026 2.069

Annual WOZ value

WOZ value per year in Haalderen
Year Average WOZ
2021 EUR 309.000
2022 EUR 313.000
2023 EUR 360.000
2024 EUR 383.000
2025 EUR 396.000

Composition of residents

Age build-up

65+: 375 0-15: 285 15-25: 320 25-45: 440 45-65: 660

Education level

Hoger

350

Praktisch

480

Middelbaar

820

Origin of residents (2025)

Europa

95

Nederland

1.820

Buiten Europa

145

Housing stock and construction periods

Types of homes

Hoekwoningen 153
Appartementen 94
Tussenwoningen 264
Vrijstaande woningen 201
Twee-onder-één-kap woningen 177

Construction period of buildings

Voor 1700 0
1700 tot 1900 10
1900 tot 1925 34
1925 tot 1950 115
1950 tot 1970 228
1970 tot 1980 98
1980 tot 1990 82
1990 tot 2000 121
2000 tot 2010 100
2010 tot 2020 23
2020 en later 38

Energy and sustainability

Energy label distribution

Label A

218

Label B

186

Label C

139

Label F

98

Label G

65

Label D

52

Label E

33

Label A+++

13

Label A+

4

Label A++++

4

Label A++

1

Label A+++++

0

Average energy consumption per year

Average energy consumption per year in Haalderen
Year Gas (m3) Electricity (kWh)
2020 1.340 3.200
2021 1.520 3.220
2022 1.210 3.110
2023 970 3.020
2024 940 3.160

Consumption per house type

Hoekwoning

Gas: 870 • Electricity: 2.430

Huurwoning

Gas: 850 • Electricity: 1.960

Koopwoning

Gas: 1.020 • Electricity: 3.460

Appartement

Gas: 850 • Electricity: 1.940

Tussenwoning

Gas: 780 • Electricity: 2.360

Vrijstaande woning

Gas: 1.320 • Electricity: 4.350

Twee-onder-één-kap woning

Gas: 990 • Electricity: 3.330

Business activity in Haalderen (2025)

Handel en HORECA 40
Nijverheid en energie 50
Zakelijke dienstverlening 45
Overheid, onderwijs en zorg 45
Landbouw, bosbouw en visserij 10
Vervoer, informatie en communicatie 5
Financiele diensten en onroerendgoed 10
Cultuur, recreatie en overige diensten 30

Total number of company establishments: 235

Recent crime statistics

Recent crime statistics in Haalderen
Period Crimes
jan 2026 6
jul 2025 2
jun 2025 1
mei 2025 4
mrt 2025 2
mrt 2026 5
nov 2024 2
nov 2025 3
okt 2024 4
okt 2025 1
sep 2024 7
sep 2025 3

These figures give an indicative picture of safety trends in the living environment of Haalderen.

Frequently asked questions about living in Haalderen

Short answers based on current local statistics, handy for a quick comparison of the living environment.

Hoeveel inwoners heeft Haalderen?

Haalderen telt in 2026 ongeveer 2.069 inwoners.

Wat is de gemiddelde WOZ-waarde in Haalderen?

De gemiddelde WOZ-waarde in Haalderen is in 2025 circa € 396.000.

Wat is het gemiddelde inkomen per inwoner in Haalderen?

Het gemiddelde inkomen per inwoner in Haalderen ligt rond € 30.400 per jaar.

Hoe veilig is wonen in Haalderen?

Voor het huidige jaar gaat het om ongeveer 30 geregistreerde misdrijven. Gebruik deze cijfers als indicatie en vergelijk trends per periode.

Welke woningtypen komen het meest voor in Haalderen?

In Haalderen komt vooral "Tussenwoningen" veel voor, met ongeveer 264 woningen.

Receive free, non-binding quotes

Compare multiple real estate agents and choose the best match.