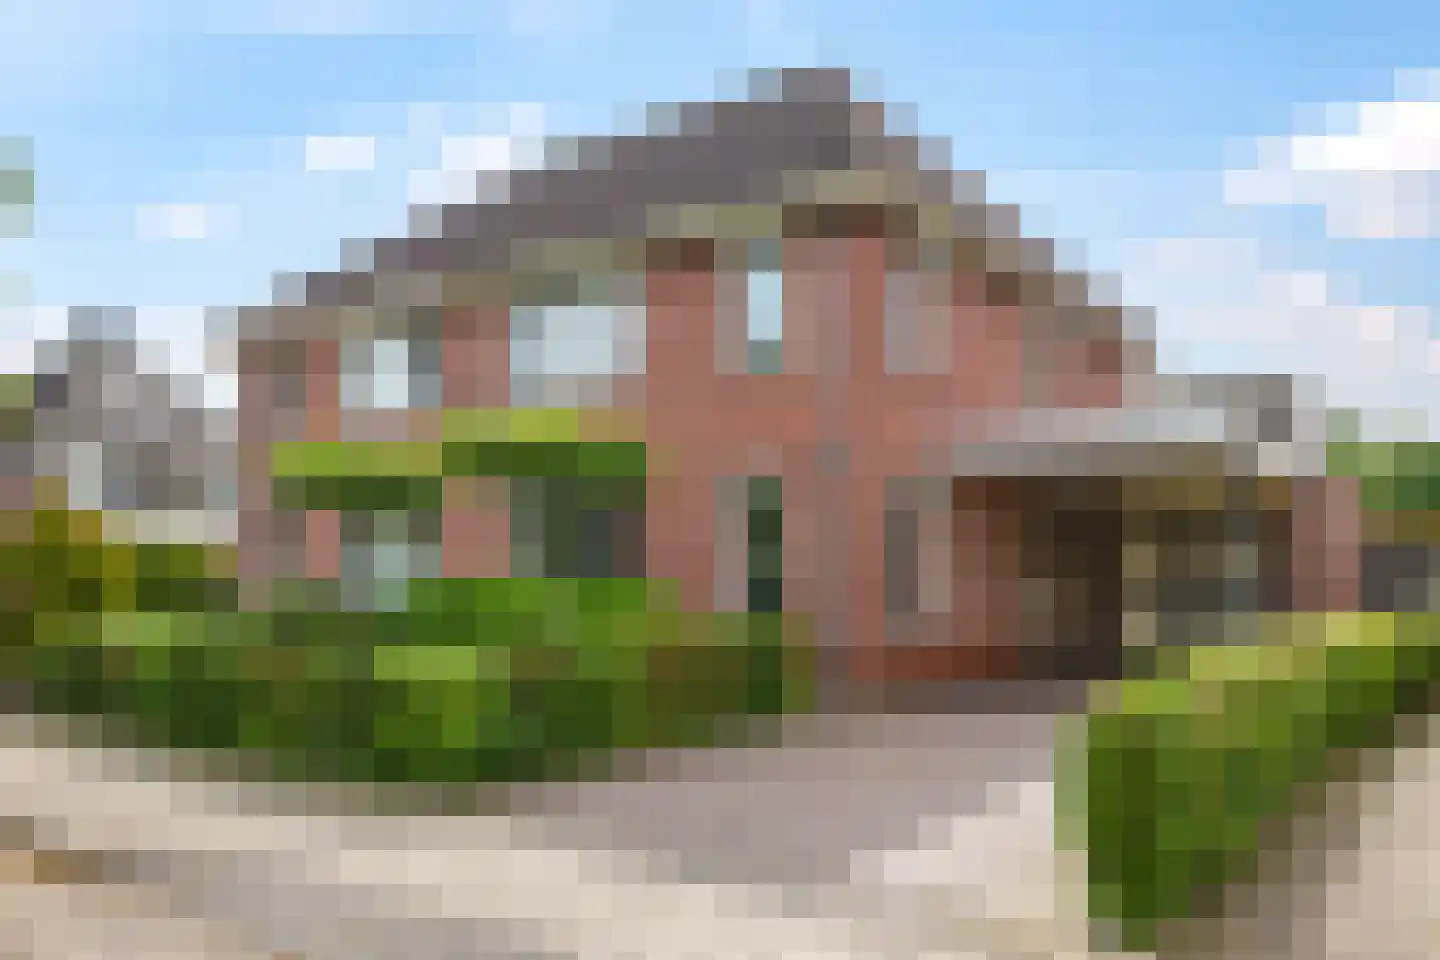
- Available
Kleine Geer 23
6685CL Haalderen
€ 329.000 k.k.
€ 4.634/m²
- Living area
- 71 m²
- Land area
- —
- Bedrooms
- 2
Searching in 14 houses in Haalderen
Type to search. Use arrow down and arrow up to navigate through results and press Enter to open.
Hidden search suggestions.
View current properties in Haalderen or search targeted on street, postal code and property characteristics.
View the current housing stock in Haalderen and quickly filter by price, living area, rooms and more. There are currently 14 houses in this place within our selection. View also 11 sold houses in Haalderen for extra insight into the local housing market.
6685CL Haalderen
€ 329.000 k.k.
€ 4.634/m²
6685CD Haalderen
€ 535.000 k.k.
€ 3.794/m²
6685AS Haalderen
€ 400.000 k.k.
€ 4.878/m²
6685AZ Haalderen
€ 350.000 k.k.
€ 3.535/m²
6685AM Haalderen
€ 345.000 k.k.
€ 4.207/m²
6685AV Haalderen
€ 300.000 k.k.
€ 3.659/m²
6685AV Haalderen
€ 395.000 k.k.
€ 4.072/m²
6685AG Haalderen
€ 345.000 k.k.
€ 3.833/m²
6685AW Haalderen
€ 500.000 k.k.
€ 4.237/m²
6685AX Haalderen
€ 415.000 k.k.
€ 3.915/m²
6685CH Haalderen
€ 550.000 k.k.
€ 3.767/m²
6685AB Haalderen
€ 475.000 k.k.
€ 3.571/m²
6685CB Haalderen
€ 429.500 k.k.
€ 0/m²
6685AC Haalderen
€ 850.000 k.k.
€ 4.521/m²
Get free quotes from real estate agents with local market knowledge. Compare more than 85 real estate agents in Haalderen.
Selling a home in Haalderen? Compare all real estate agents in Haalderen or view the top 10 real estate agents in Haalderen for extra context for your choice.
Real estate agents make sharper offers when they know you're comparing — ask for quotes for sale or purchase.
Practical answers about housing supply, sales and comparing real estate agents in Haalderen.
The costs of a real estate agent in Haalderen depend on commission, setup costs, property presentation and the chosen service. Compare the 85 real estate agents in Haalderen via the real estate agent page and request multiple quotes to compare rates and approach well.
Within our selection, we are currently showing 14 houses in Haalderen. View also the sold houses in Haalderen to compare the current offering with recent transactions.
Take into account not only price and living area but also maintenance, energy label, location, outdoor space and sales status. This way you compare houses in Haalderen on more than just the asking price.
A local real estate agent knows the neighborhoods, recent transactions and demand in Haalderen. By comparing 85 real estate agents in the region you get a better insight into prices, sales strategy and expected yield; the top 10 in Haalderen provides a useful starting point.
Yes, when making a sales plan, a valuation in Haalderen is wise. You gain insight into a realistic asking price and can then compare offers from real estate agents specifically.
View current location data on residents, WOZ development, housing stock, energy consumption, business activity and safety in Haalderen. In 2026 were there 2.069 residents. The average WOZ value in 2025 is EUR 396.000.
These figures help to better assess and compare the housing stock in Haalderen with recent sold homes. Orient yourself then on suitable top real estate agents in Haalderen for sales advice in this region.
Residents
2.069
Last year: 2026
Average WOZ
EUR 396.000
Last year: 2025
Average income per person.
EUR 30.400
Source: AllNumbers
Crimes (current year)
30
Total registered
| Year | Residents |
|---|---|
| 2021 | 2.052 |
| 2022 | 2.060 |
| 2023 | 2.065 |
| 2024 | 2.070 |
| 2025 | 2.065 |
| 2026 | 2.069 |
| Year | Average WOZ |
|---|---|
| 2021 | EUR 309.000 |
| 2022 | EUR 313.000 |
| 2023 | EUR 360.000 |
| 2024 | EUR 383.000 |
| 2025 | EUR 396.000 |
Hoger
350
Praktisch
480
Middelbaar
820
Europa
95
Nederland
1.820
Buiten Europa
145
Label A
218
Label B
186
Label C
139
Label F
98
Label G
65
Label D
52
Label E
33
Label A+++
13
Label A+
4
Label A++++
4
Label A++
1
Label A+++++
0
| Year | Gas (m3) | Electricity (kWh) |
|---|---|---|
| 2020 | 1.340 | 3.200 |
| 2021 | 1.520 | 3.220 |
| 2022 | 1.210 | 3.110 |
| 2023 | 970 | 3.020 |
| 2024 | 940 | 3.160 |
Hoekwoning
Gas: 870 • Electricity: 2.430
Huurwoning
Gas: 850 • Electricity: 1.960
Koopwoning
Gas: 1.020 • Electricity: 3.460
Appartement
Gas: 850 • Electricity: 1.940
Tussenwoning
Gas: 780 • Electricity: 2.360
Vrijstaande woning
Gas: 1.320 • Electricity: 4.350
Twee-onder-één-kap woning
Gas: 990 • Electricity: 3.330
Total number of company establishments: 235
| Period | Crimes |
|---|---|
| jan 2026 | 6 |
| jul 2025 | 2 |
| jun 2025 | 1 |
| mei 2025 | 4 |
| mrt 2025 | 2 |
| mrt 2026 | 5 |
| nov 2024 | 2 |
| nov 2025 | 3 |
| okt 2024 | 4 |
| okt 2025 | 1 |
| sep 2024 | 7 |
| sep 2025 | 3 |
These figures give an indicative picture of safety trends in the living environment of Haalderen.
Short answers based on current local statistics, handy for a quick comparison of the living environment.
Haalderen telt in 2026 ongeveer 2.069 inwoners.
De gemiddelde WOZ-waarde in Haalderen is in 2025 circa € 396.000.
Het gemiddelde inkomen per inwoner in Haalderen ligt rond € 30.400 per jaar.
Voor het huidige jaar gaat het om ongeveer 30 geregistreerde misdrijven. Gebruik deze cijfers als indicatie en vergelijk trends per periode.
In Haalderen komt vooral "Tussenwoningen" veel voor, met ongeveer 264 woningen.