- Sold subject to confirmation
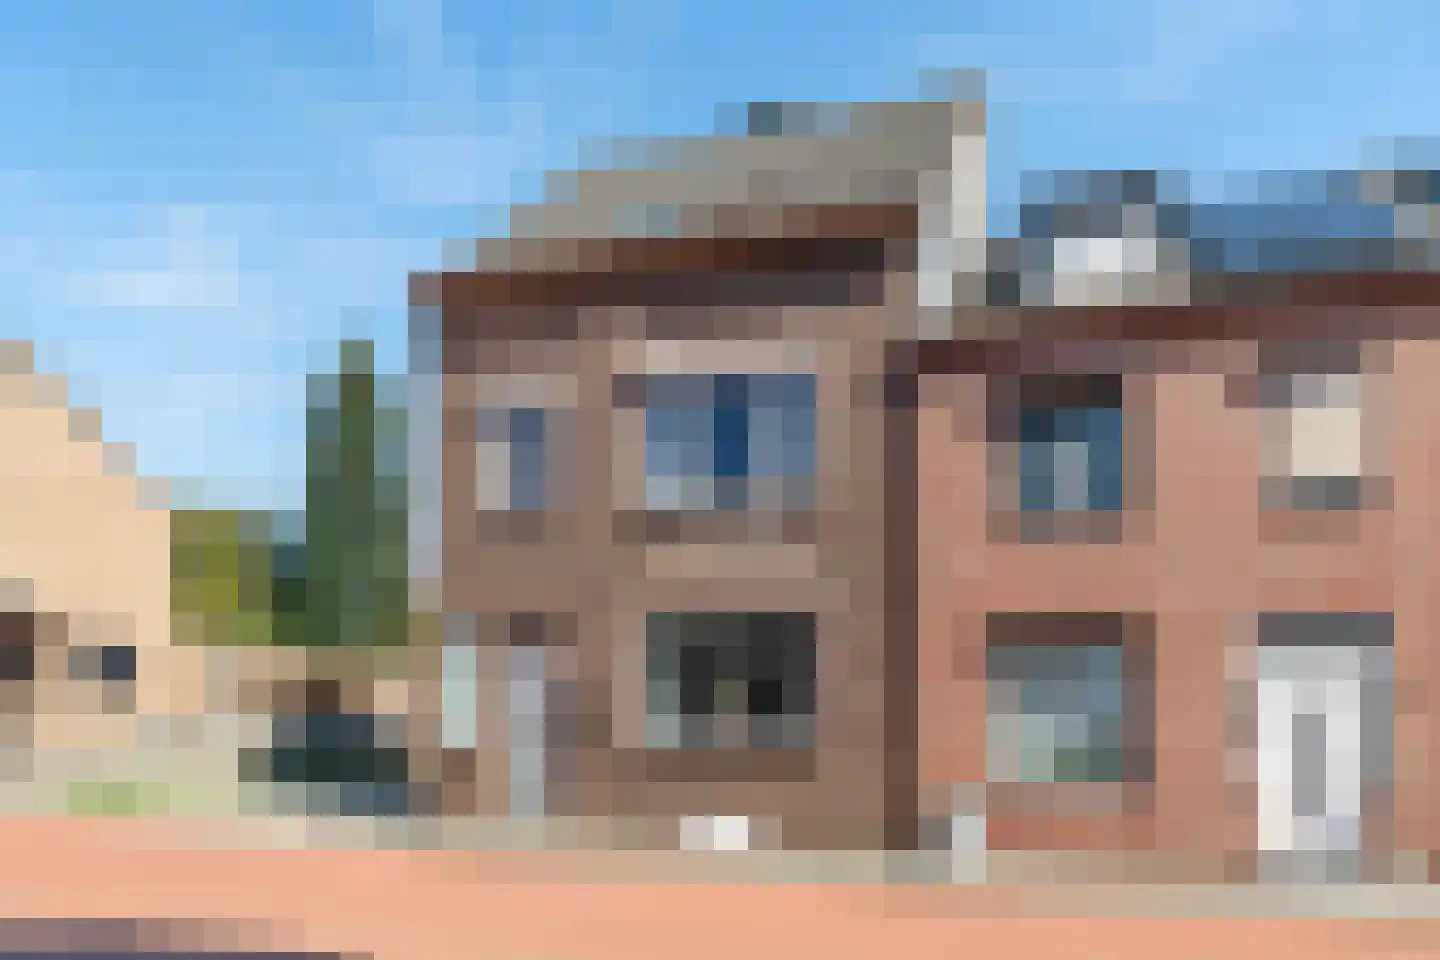
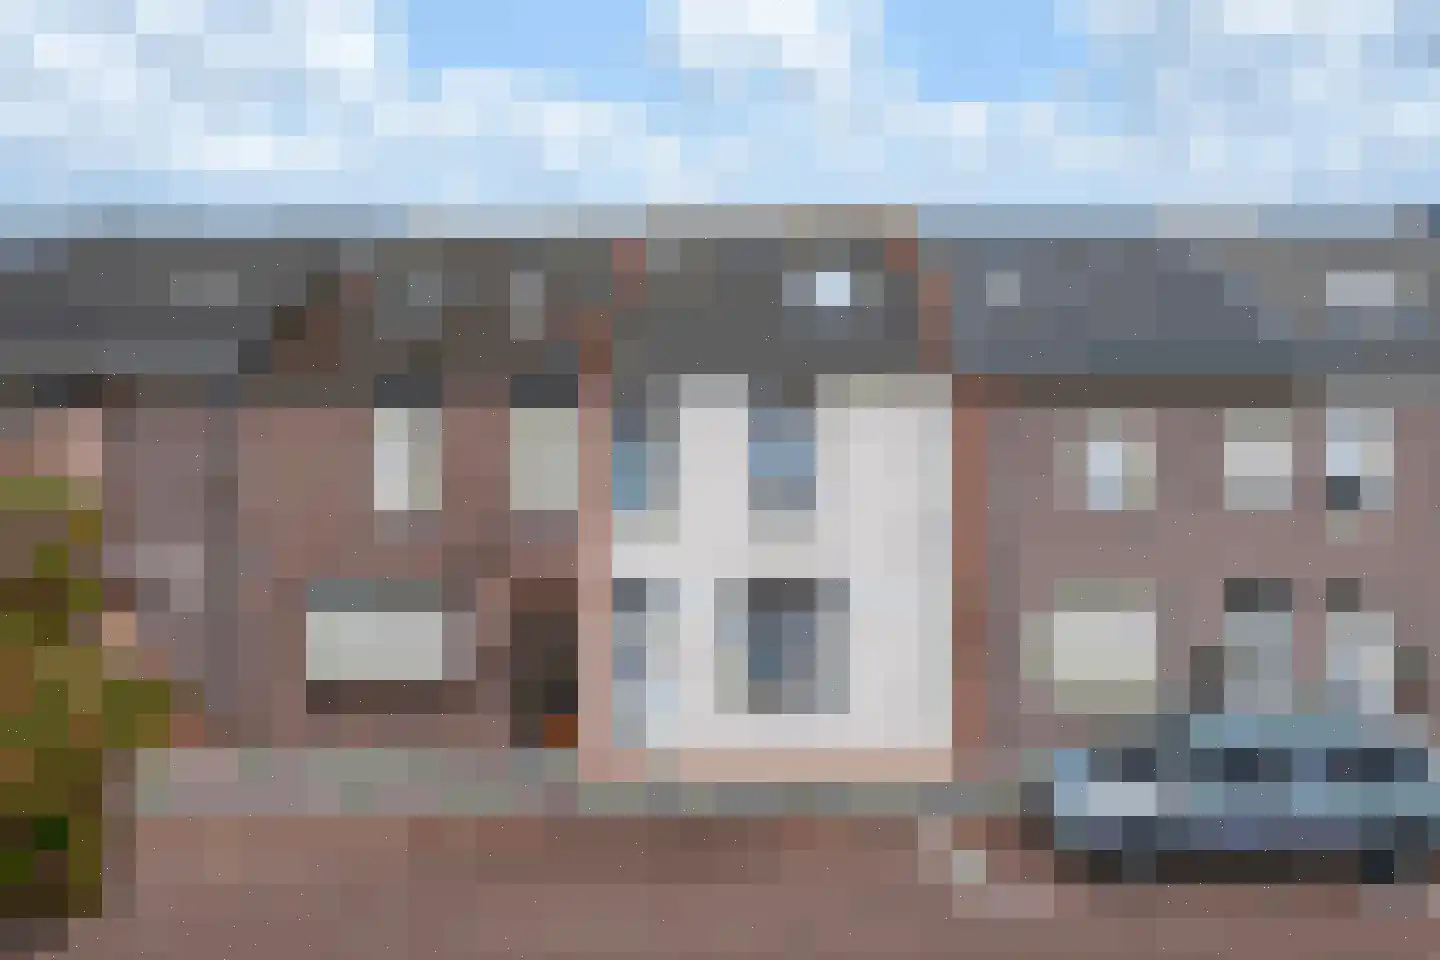
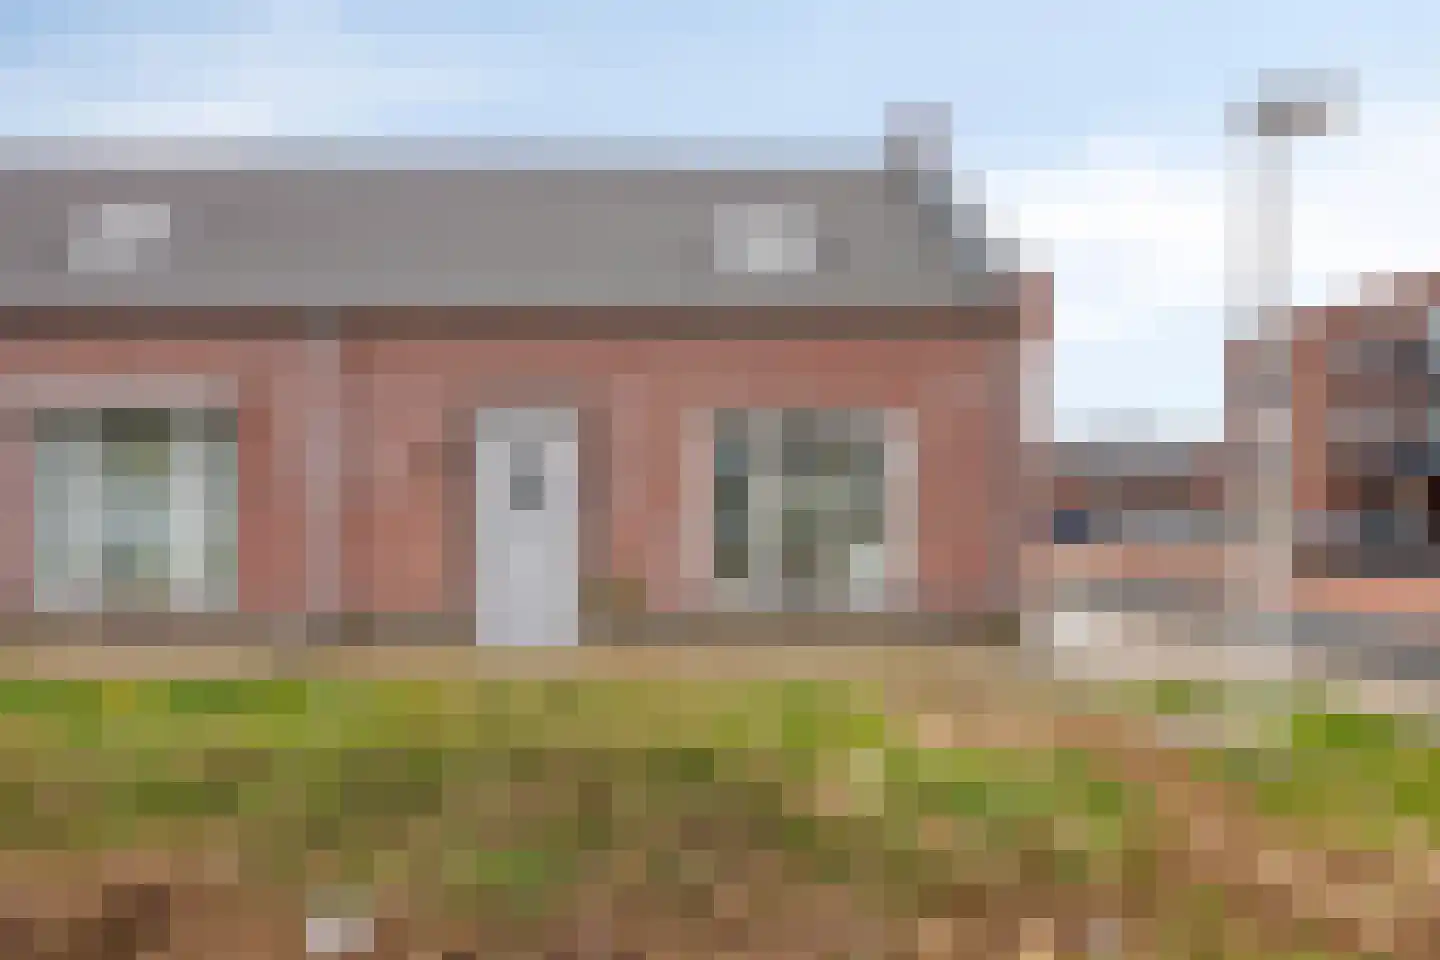
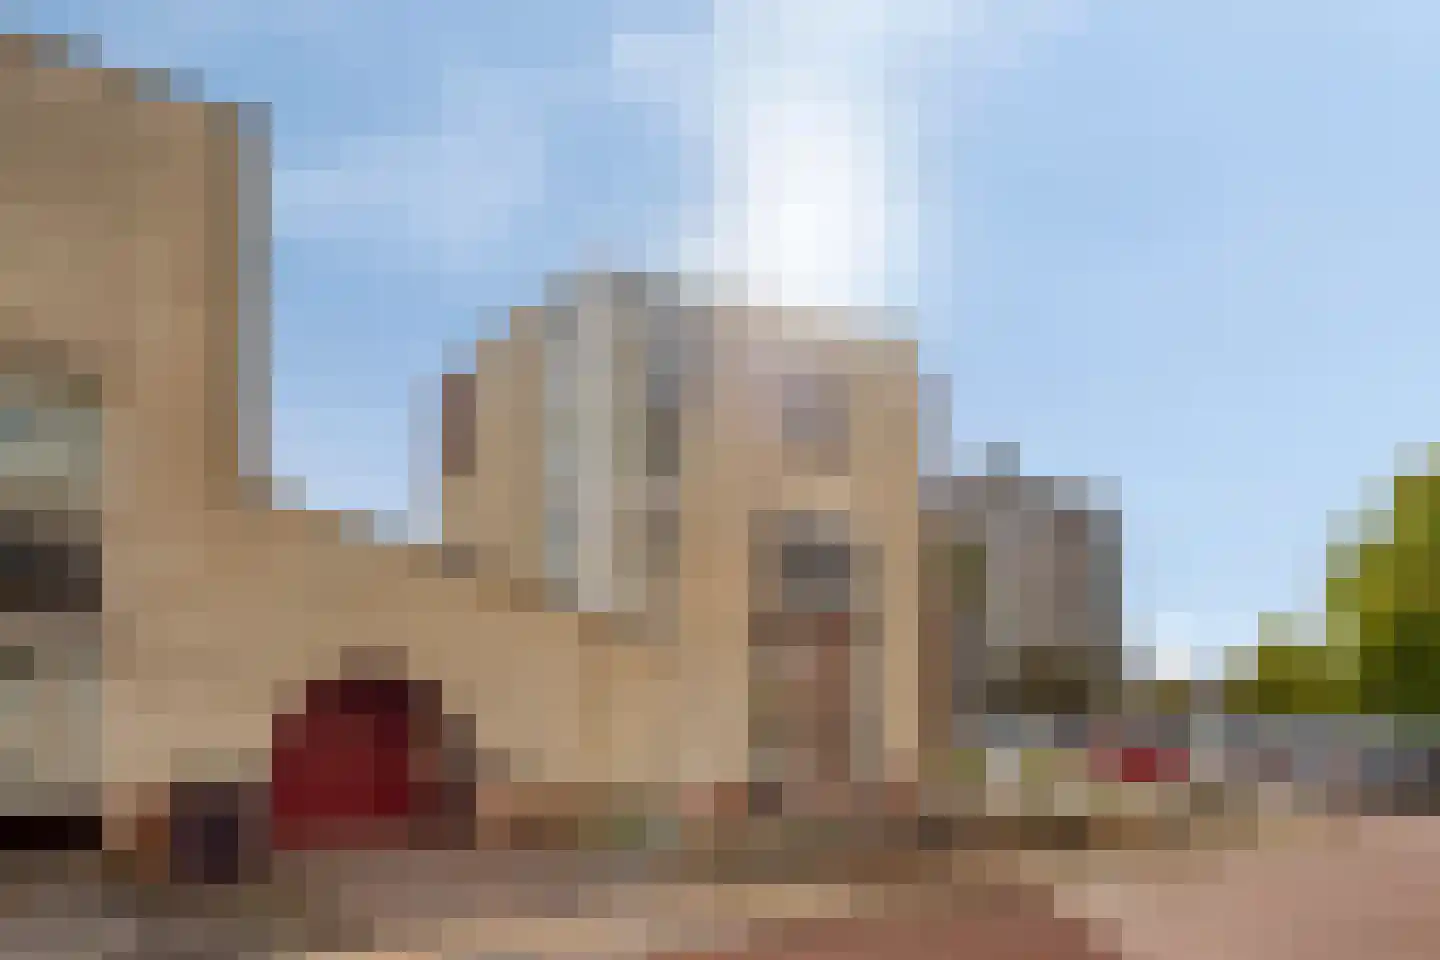
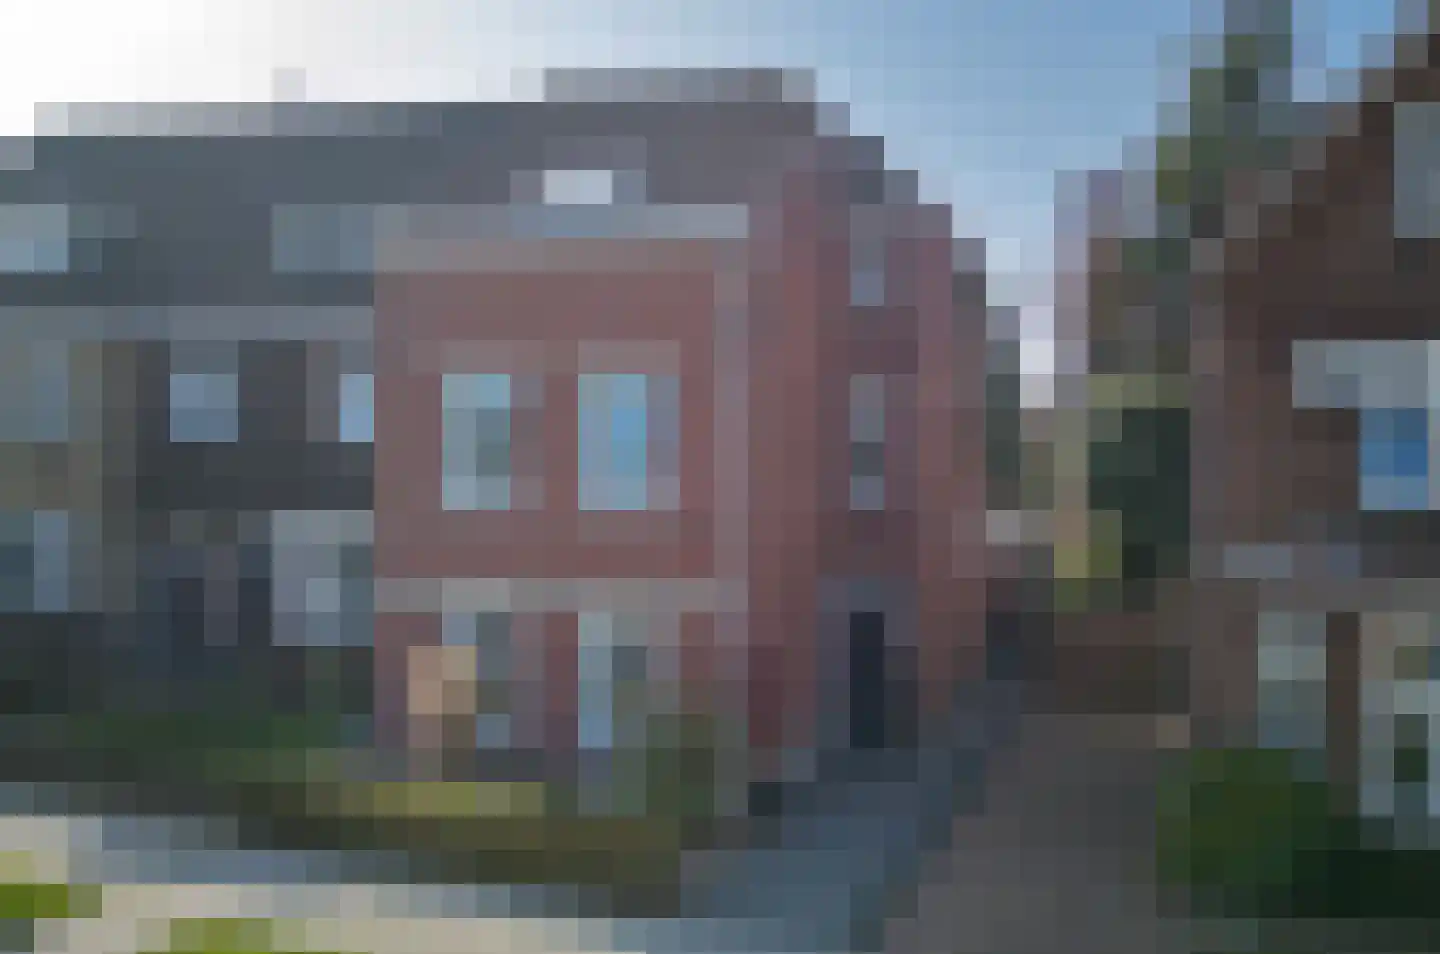
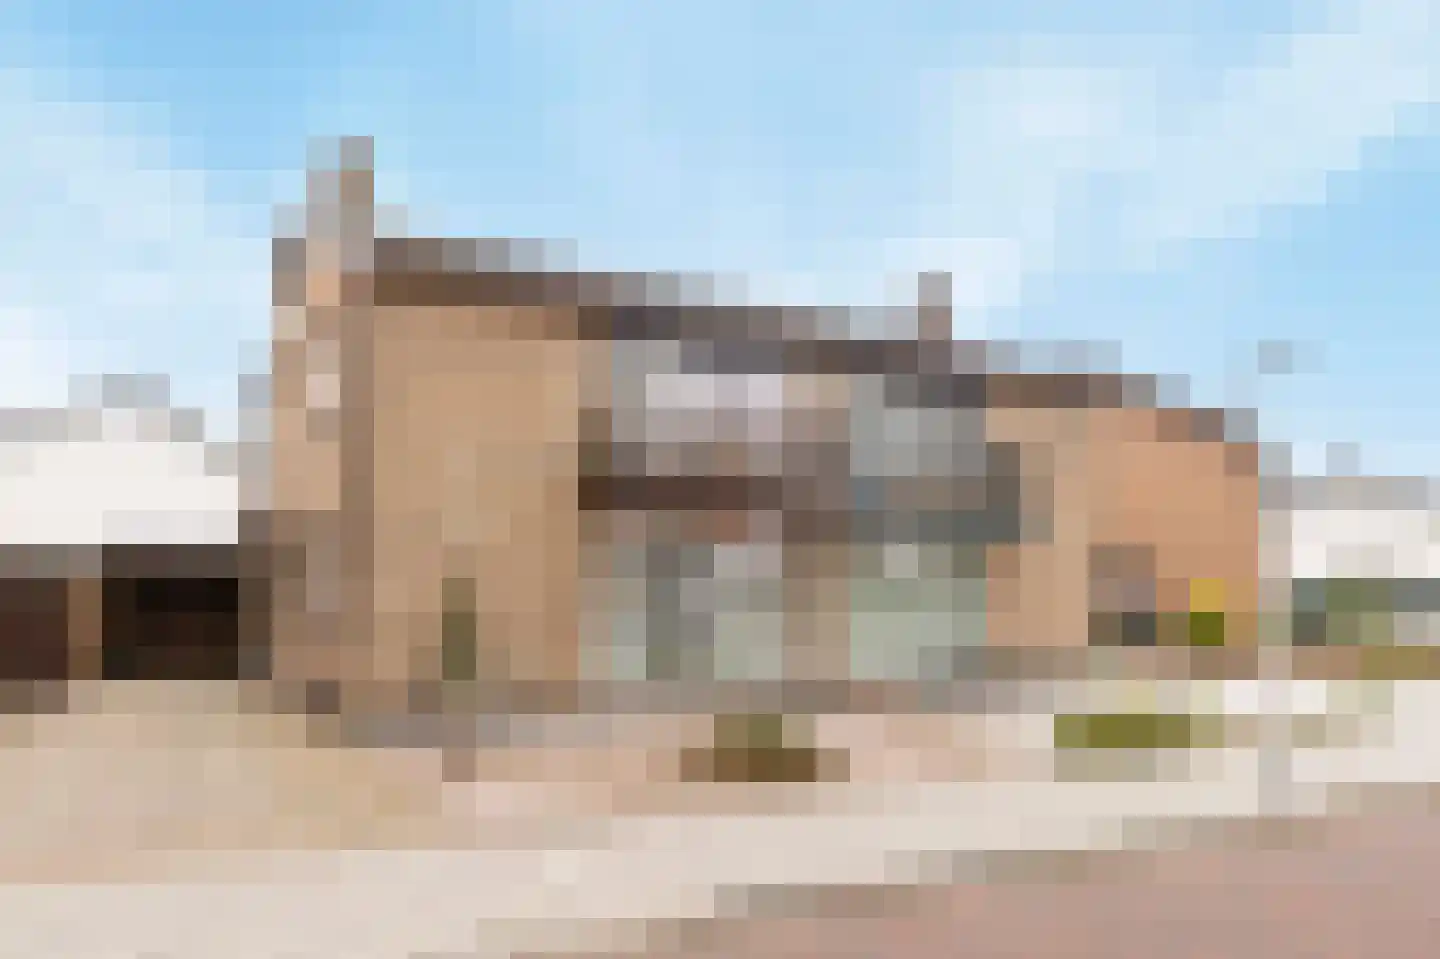
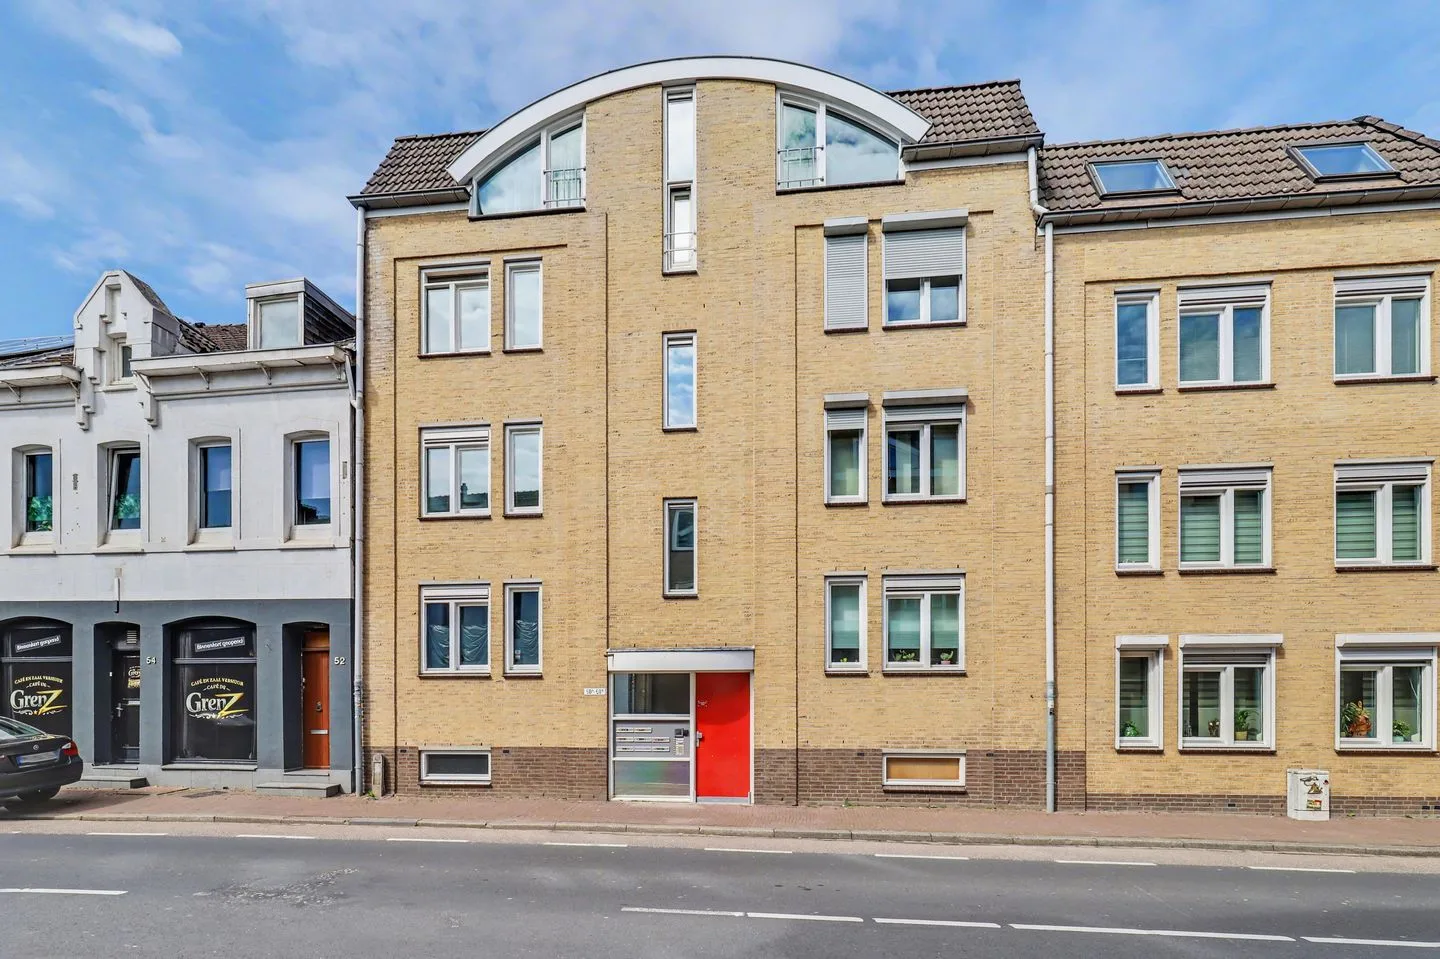
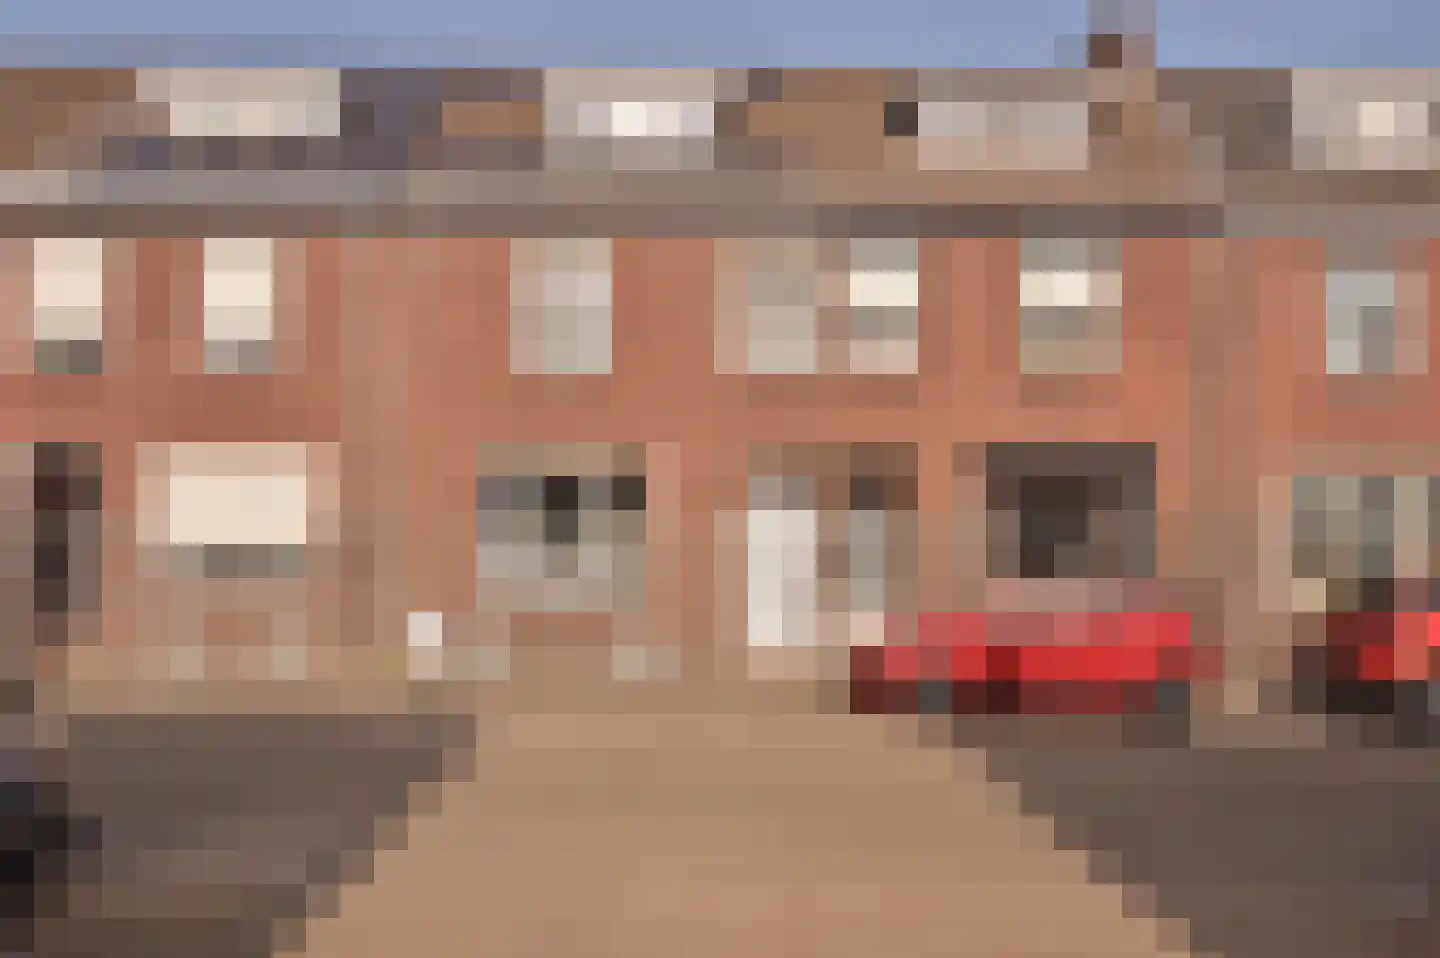
Singelweg 60
6467CG Kerkrade
€ 525.000 k.k.
€ 3.261/m²
C
Save as favorite
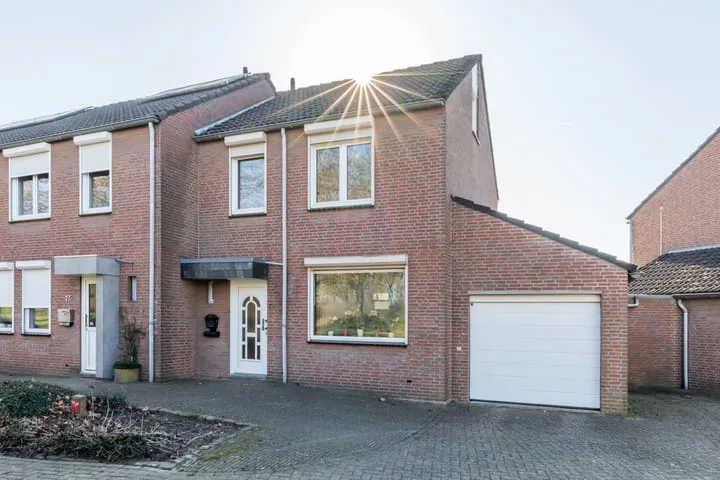
- Living area
- 161 m²
- Land area
- 373 m²
- Bedrooms
- 5