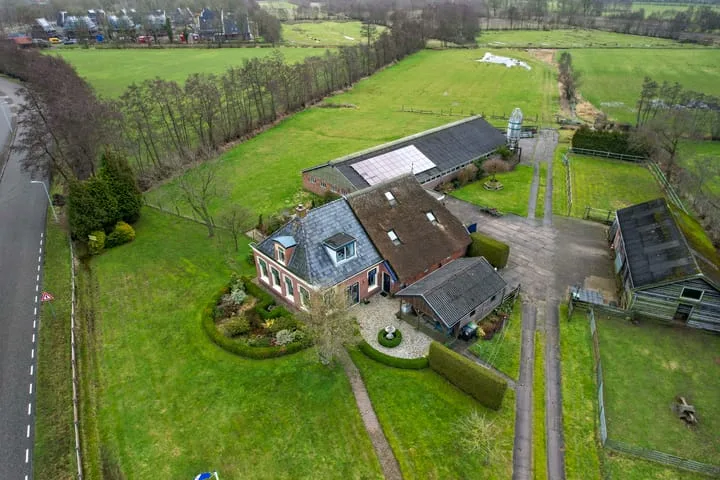
Housing offer in Kollum

Searching in 47 houses in Kollum

Connected to: Vastgoed Nederland NVM Makelaars

View the current housing stock in Kollum and quickly filter by price, living area, rooms and more. There are currently 47 houses in this place within our selection. View also 35 sold houses in Kollum for extra insight into the local housing market.

Selection

Search and filter homes

Set your preferences and discover homes that suit you.

Total supply 244.545
Filters

Set price, area and other characteristics. Adjust a filter or click on Show homes. Location changes directly above.

Reset filters

You search for

  • Place Kollum

Selling a home in Kollum? Compare realtor offers

Get free quotes from real estate agents with local market knowledge. Compare more than 16 real estate agents in Kollum.

Free request a quote

  • Quotes in Kollum
  • Non-binding
  • Personal
  • Compare free rates

Selling a home in Kollum? Compare all real estate agents in Kollum or view the top 10 real estate agents in Kollum for extra context for your choice.

Compare multiple quotes

Real estate agents make sharper offers when they know you're comparing — ask for quotes for sale or purchase.

Frequently asked questions about homes in Kollum

Practical answers about housing supply, sales and comparing real estate agents in Kollum.

Residential and neighborhood statistics in Kollum

View current location data on residents, WOZ development, housing stock, energy consumption, business activity and safety in Kollum. In 2026 were there 5.874 residents. The average WOZ value in 2025 is EUR 296.000.

These figures help to better assess and compare the housing stock in Kollum with recent sold homes. Orient yourself then on suitable top real estate agents in Kollum for sales advice in this region.

Residents

5.874

Last year: 2026

Average WOZ

EUR 296.000

Last year: 2025

Average income per person.

EUR 28.800

Source: AllNumbers

Crimes (current year)

130

Total registered

Demographics and WOZ development

Inhabitants per year

Inhabitants per year in Kollum
Year Residents
2021 5.715
2022 5.750
2023 5.805
2024 5.790
2025 5.815
2026 5.874

Annual WOZ value

WOZ value per year in Kollum
Year Average WOZ
2021 EUR 197.000
2022 EUR 230.000
2023 EUR 271.000
2024 EUR 286.000
2025 EUR 296.000

Composition of residents

Age build-up

65+: 1.560 0-15: 910 15-25: 665 25-45: 1.335 45-65: 1.415

Education level

Hoger

920

Praktisch

1.240

Middelbaar

1.980

Origin of residents (2025)

Europa

105

Nederland

5.405

Buiten Europa

305

Housing stock and construction periods

Types of homes

Hoekwoningen 313
Appartementen 480
Tussenwoningen 538
Vrijstaande woningen 812
Twee-onder-één-kap woningen 575

Construction period of buildings

Voor 1700 6
1700 tot 1900 172
1900 tot 1925 105
1925 tot 1950 127
1950 tot 1970 580
1970 tot 1980 427
1980 tot 1990 301
1990 tot 2000 323
2000 tot 2010 155
2010 tot 2020 134
2020 en later 71

Energy and sustainability

Energy label distribution

Label C

690

Label B

591

Label A

557

Label D

287

Label G

252

Label E

168

Label F

87

Label A+++

47

Label A+

33

Label A++++

12

Label A++

3

Label A+++++

0

Average energy consumption per year

Average energy consumption per year in Kollum
Year Gas (m3) Electricity (kWh)
2020 1.350 2.510
2021 1.490 2.580
2022 1.170 2.350
2023 960 2.270
2024 940 2.380

Consumption per house type

Hoekwoning

Gas: 990 • Electricity: 1.990

Huurwoning

Gas: 780 • Electricity: 1.590

Koopwoning

Gas: 1.070 • Electricity: 2.690

Appartement

Gas: 700 • Electricity: 1.640

Tussenwoning

Gas: 950 • Electricity: 1.950

Vrijstaande woning

Gas: 1.180 • Electricity: 2.970

Twee-onder-één-kap woning

Gas: 880 • Electricity: 2.240

Business activity in Kollum (2025)

Handel en HORECA 155
Nijverheid en energie 130
Zakelijke dienstverlening 140
Overheid, onderwijs en zorg 95
Landbouw, bosbouw en visserij 35
Vervoer, informatie en communicatie 25
Financiele diensten en onroerendgoed 25
Cultuur, recreatie en overige diensten 70

Total number of company establishments: 680

Recent crime statistics

Recent crime statistics in Kollum
Period Crimes
jan 2026 12
jul 2025 14
jun 2025 10
mei 2025 15
mrt 2025 7
mrt 2026 11
nov 2024 9
nov 2025 12
okt 2024 8
okt 2025 20
sep 2024 11
sep 2025 11

These figures give an indicative picture of safety trends in the living environment of Kollum.

Frequently asked questions about living in Kollum

Short answers based on current local statistics, handy for a quick comparison of the living environment.

Hoeveel inwoners heeft Kollum?

Kollum telt in 2026 ongeveer 5.874 inwoners.

Wat is de gemiddelde WOZ-waarde in Kollum?

De gemiddelde WOZ-waarde in Kollum is in 2025 circa € 296.000.

Wat is het gemiddelde inkomen per inwoner in Kollum?

Het gemiddelde inkomen per inwoner in Kollum ligt rond € 28.800 per jaar.

Hoe veilig is wonen in Kollum?

Voor het huidige jaar gaat het om ongeveer 130 geregistreerde misdrijven. Gebruik deze cijfers als indicatie en vergelijk trends per periode.

Welke woningtypen komen het meest voor in Kollum?

In Kollum komt vooral "Vrijstaande woningen" veel voor, met ongeveer 812 woningen.

Receive free, non-binding quotes

Compare multiple real estate agents and choose the best match.