- Sold
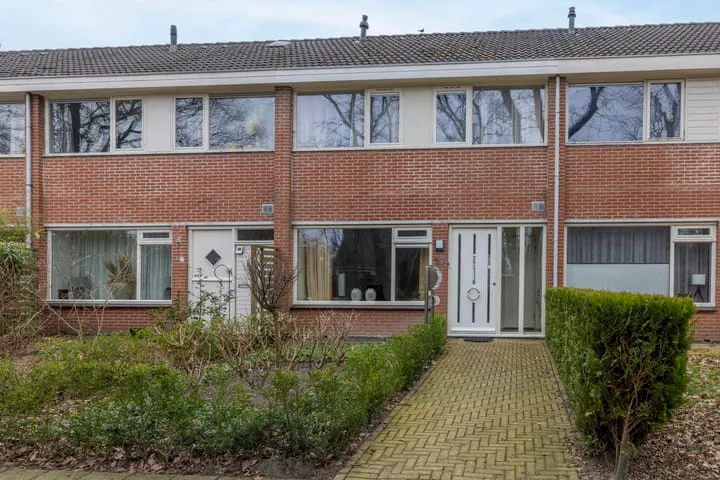
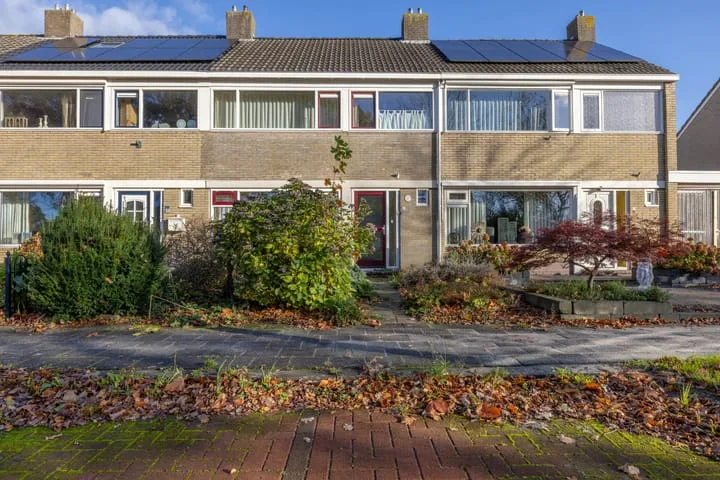
Willem Lodewijkstrjitte 13
9288BJ Kootstertille
€ 265.000 k.k.
€ 2.265/m²
C
Save as favorite
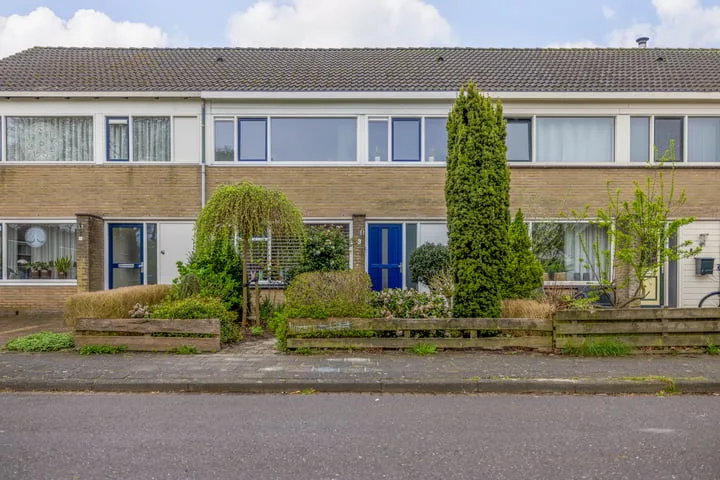
- Living area
- 117 m²
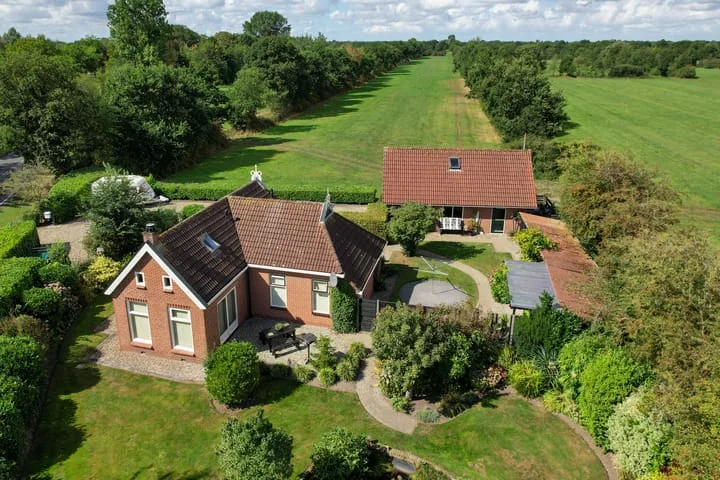
- Land area
- 190 m²
- Bedrooms
- 4