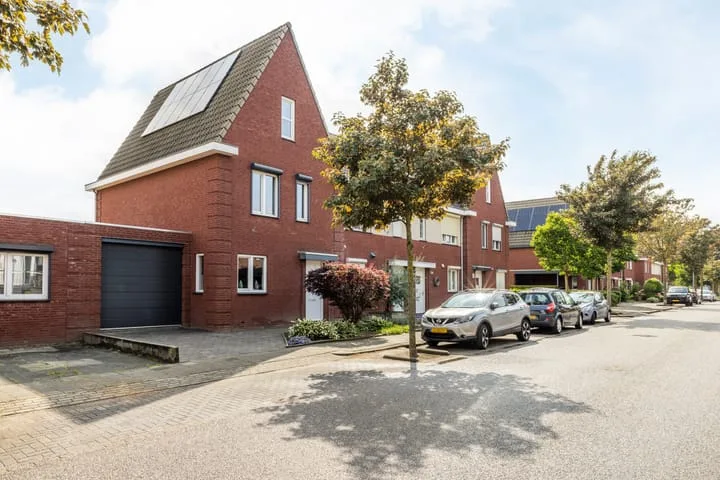
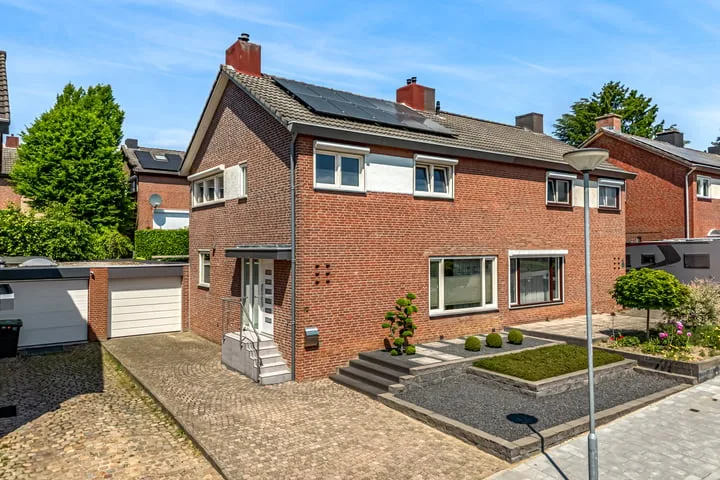
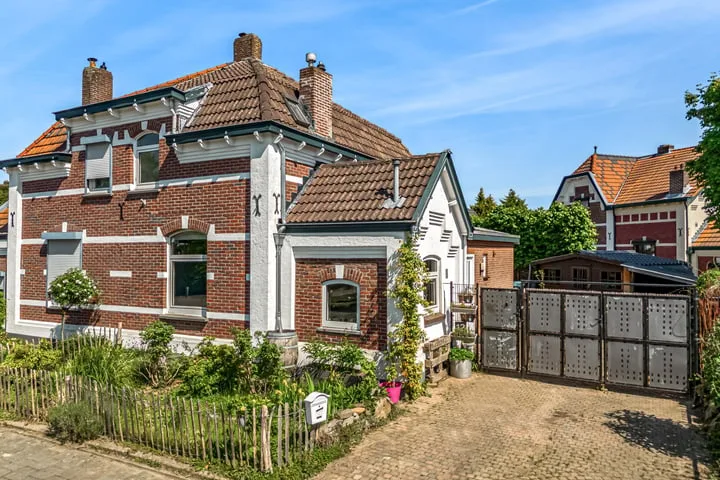
- Sold
Don Boscolaan 60
6374TE Landgraaf
€ 269.000 k.k.
€ 3.164/m²
- Living area
- 85 m²
- Land area
- 349 m²
- Bedrooms
- 2
View 296 sold houses in Landgraaf
Type to search. Use arrow down and arrow up to navigate through results and press Enter to open.
Hidden search suggestions.
Compare sold homes in Landgraaf or view the current offering in this location directly.
On this page you will find recently sold homes in Landgraaf. Use this overview to better estimate selling prices, popular neighborhoods, and the local housing supply before you choose a real estate agent. Also view the current housing supply with 466 houses in Landgraaf.
6374TE Landgraaf
€ 269.000 k.k.
€ 3.164/m²
6373GX Landgraaf
€ 349.000 k.k.
€ 2.726/m²
6373NW Landgraaf
€ 175.000 k.k.
€ 2.430/m²
6371JB Landgraaf
€ 398.000 k.k.
€ 2.487/m²
6374VS Landgraaf
€ 369.000 k.k.
€ 2.838/m²
6372GT Landgraaf
€ 175.000 k.k.
€ 2.058/m²
6373HX Landgraaf
€ 325.000 k.k.
€ 2.355/m²
6374LC Landgraaf
€ 549.000 k.k.
€ 4.007/m²
6373GH Landgraaf
€ 448.000 k.k.
€ 2.333/m²
6373VJ Landgraaf
€ 259.000 k.k.
€ 2.590/m²
6374JT Landgraaf
€ 229.000 k.k.
€ 2.008/m²
6371CB Landgraaf
€ 725.000 k.k.
€ 3.280/m²
6373XC Landgraaf
€ 379.000 k.k.
€ 2.310/m²
6374AP Landgraaf
€ 429.000 k.k.
€ 2.523/m²
6373KV Landgraaf
€ 379.000 k.k.
€ 3.132/m²
6372HV Landgraaf
€ 335.000 k.k.
€ 2.938/m²
6372XX Landgraaf
€ 950.000 k.k.
€ 3.429/m²
6374XV Landgraaf
€ 369.000 k.k.
€ 2.527/m²
6371LJ Landgraaf
€ 262.500 k.k.
€ 2.822/m²
6374JS Landgraaf
€ 324.000 k.k.
€ 2.700/m²
6372VH Landgraaf
€ 475.000 k.k.
€ 3.958/m²
6372HD Landgraaf
€ 250.000 k.k.
€ 2.604/m²
6371LX Landgraaf
€ 464.000 k.k.
€ 3.596/m²
6372CN Landgraaf
€ 145.000 k.k.
€ 3.085/m²
6373BA Landgraaf
€ 525.000 k.k.
€ 2.323/m²
6374MP Landgraaf
€ 369.000 k.k.
€ 2.774/m²
6372MK Landgraaf
€ 239.000 k.k.
€ 2.655/m²
6372TN Landgraaf
€ 260.000 k.k.
€ 2.407/m²
Get free quotes from realtors with local market knowledge in Landgraaf.
Selling a home in Landgraaf? Compare real estate agents who know the local housing market. Also check out all real estate agents in Landgraaf or the top 10 real estate agents in Landgraaf for extra context for your choice.
By comparing brokers and requesting quotes
Short answers about housing prices, sold homes and comparing real estate agents in Landgraaf.
The costs of a real estate agent in Landgraaf vary per office, property type and sales approach. Therefore, compare multiple quotes and also look at the real estate agents in Landgraaf to better compare rates, presentation and local experience.
On this page we currently show 296 sold houses in Landgraaf from our selection. This helps you to better assess recent transactions and the local housing market.
Houses sold in Landgraaf give insight into asking prices, house types and neighborhoods where recent transactions have taken place. Compare this also with the current housing stock in Landgraaf to better understand the market.
You can use sold homes as a first market indication, but a local real estate agent can better take into account finishing, location, maintenance and current demand in Landgraaf.
Compare realtors in Landgraaf on local sales experience, reviews, expected yield, commission and marketing approach. The top 10 realtors in Landgraaf helps to quickly discover strong offices.
View current location data on residents, WOZ development, housing stock, energy consumption, business activity and safety in Landgraaf. In 2026 were there 36.844 residents. The average WOZ value in 2025 is EUR 265.000.
These figures help to better assess and compare the housing stock in Landgraaf with recent sold homes. Orient yourself then on suitable top real estate agents in Landgraaf for sales advice in this region.
Residents
36.844
Last year: 2026
Average WOZ
EUR 265.000
Last year: 2025
Average income per person.
EUR 31.800
Source: AllNumbers
Crimes (current year)
1.375
Total registered
| Year | Residents |
|---|---|
| 2022 | 37.023 |
| 2023 | 37.175 |
| 2024 | 37.112 |
| 2025 | 36.839 |
| 2026 | 36.844 |
| Year | Average WOZ |
|---|---|
| 2021 | EUR 197.000 |
| 2022 | EUR 212.000 |
| 2023 | EUR 248.000 |
| 2024 | EUR 247.000 |
| 2025 | EUR 265.000 |
Hoger
23
Praktisch
34
Middelbaar
43
Europa
5.824
Nederland
27.859
Buiten Europa
3.156
Label C
4.932
Label A
3.139
Label B
2.575
Label D
2.345
Label F
2.076
Label G
1.573
Label E
1.278
Label A+
371
Label A+++
140
Label A++
120
Label A++++
22
Label A+++++
3
| Year | Gas (m3) | Electricity (kWh) |
|---|---|---|
| 2020 | 1.250 | 2.830 |
| 2021 | 1.430 | 2.870 |
| 2022 | 1.100 | 2.740 |
| 2023 | 910 | 2.660 |
| 2024 | 890 | 2.710 |
Hoekwoning
Gas: 950 • Electricity: 2.710
Huurwoning
Gas: 760 • Electricity: 2.080
Koopwoning
Gas: 1.000 • Electricity: 3.000
Appartement
Gas: 670 • Electricity: 1.900
Tussenwoning
Gas: 860 • Electricity: 2.630
Vrijstaande woning
Gas: 1.340 • Electricity: 3.890
Twee-onder-één-kap woning
Gas: 1.040 • Electricity: 2.920
Total number of company establishments: 3.090
| Period | Crimes |
|---|---|
| jan 2026 | 120 |
| jul 2025 | 128 |
| jun 2025 | 150 |
| mei 2025 | 124 |
| mrt 2025 | 114 |
| mrt 2026 | 106 |
| nov 2024 | 115 |
| nov 2025 | 103 |
| okt 2024 | 107 |
| okt 2025 | 108 |
| sep 2024 | 117 |
| sep 2025 | 104 |
These figures give an indicative picture of safety trends in the living environment of Landgraaf.
Short answers based on current local statistics, handy for a quick comparison of the living environment.
Landgraaf telt in 2026 ongeveer 36.844 inwoners.
De gemiddelde WOZ-waarde in Landgraaf is in 2025 circa € 265.000.
Het gemiddelde inkomen per inwoner in Landgraaf ligt rond € 31.800 per jaar.
Voor het huidige jaar gaat het om ongeveer 1.375 geregistreerde misdrijven. Gebruik deze cijfers als indicatie en vergelijk trends per periode.
In Landgraaf komt vooral "Tussenwoningen" veel voor, met ongeveer 5.704 woningen.