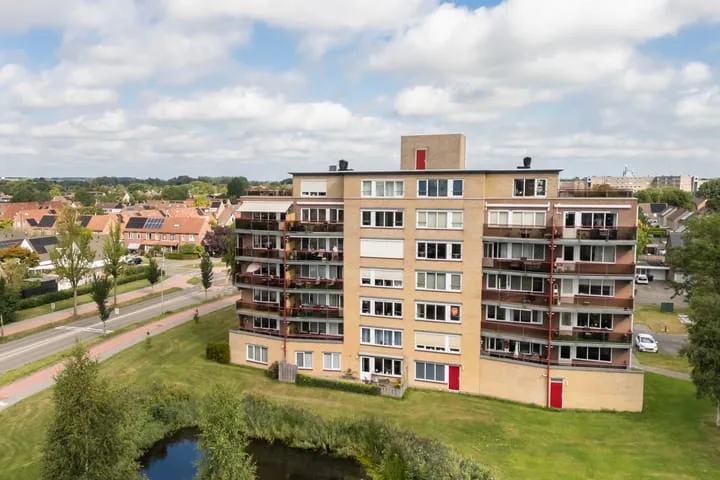
- Sold
Julianalaan 20
8932AA Leeuwarden
€ 350.000 k.k.
€ 2.187/m²
- Living area
- 160 m²
- Land area
- 328 m²
- Bedrooms
- 6
View 1.055 sold houses in Leeuwarden
Type to search. Use arrow down and arrow up to navigate through results and press Enter to open.
Hidden search suggestions.
Compare sold homes in Leeuwarden or view the current offering in this location directly.
On this page you will find recently sold homes in Leeuwarden. Use this overview to better estimate selling prices, popular neighborhoods, and the local housing supply before you choose a real estate agent. Also view the current housing supply with 1.527 houses in Leeuwarden.
8932AA Leeuwarden
€ 350.000 k.k.
€ 2.187/m²
8933DW Leeuwarden
€ 339.500 k.k.
€ 2.631/m²
8921HN Leeuwarden
€ 210.000 k.k.
€ 2.258/m²
8921HJ Leeuwarden
€ 199.000 k.k.
€ 2.426/m²
8932JW Leeuwarden
€ 229.000 k.k.
€ 2.898/m²
8926KR Leeuwarden
€ 219.500 k.k.
€ 3.181/m²
8916AN Leeuwarden
€ 259.500 k.k.
€ 3.370/m²
8932ME Leeuwarden
€ 449.000 k.k.
€ 4.045/m²
8921PL Leeuwarden
€ 299.000 k.k.
€ 3.020/m²
8922GS Leeuwarden
€ 225.000 k.k.
€ 2.586/m²
8922GK Leeuwarden
€ 275.000 k.k.
€ 2.644/m²
8921VM Leeuwarden
€ 287.500 k.k.
€ 2.963/m²
8921VE Leeuwarden
€ 325.000 k.k.
€ 2.685/m²
8933EJ Leeuwarden
€ 245.000 k.k.
€ 2.951/m²
8941BP Leeuwarden
€ 599.000 k.k.
€ 3.915/m²
8922AL Leeuwarden
€ 225.000 k.k.
€ 2.960/m²
8932NS Leeuwarden
€ 295.000 k.k.
€ 3.390/m²
8939BP Leeuwarden
€ 610.000 k.k.
€ 0/m²
8933BN Leeuwarden
€ 595.000 k.k.
€ 0/m²
8917AC Leeuwarden
€ 245.000 k.k.
€ 0/m²
8925GS Leeuwarden
€ 299.000 k.k.
€ 0/m²
8921TV Leeuwarden
€ 197.500 k.k.
€ 0/m²
8939EG Leeuwarden
€ 350.000 k.k.
€ 0/m²
8921HD Leeuwarden
€ 295.000 k.k.
€ 2.201/m²
8912CL Leeuwarden
€ 439.500 k.k.
€ 0/m²
8935JN Leeuwarden
€ 340.000 k.k.
€ 0/m²
8941ZX Leeuwarden
€ 525.000 k.k.
€ 0/m²
8933BL Leeuwarden
€ 395.000 k.k.
€ 0/m²
Bekijk recente verkopen en ontvang gratis offertes van lokale verkoopmakelaars in Leeuwarden.
Recent verkocht in Leeuwarden? Lees de verkoopgerichte gids huis verkopen in Leeuwarden, vergelijk verkoopmakelaars in Leeuwarden of bekijk de beste verkoopmakelaars in Leeuwarden voor referentie bij jouw keuze.
Makelaars maken scherpere voorstellen als ze weten dat je vergelijkt — vraag offertes aan voor verkoop of aankoop.
Short answers about housing prices, sold homes and comparing real estate agents in Leeuwarden.
The costs of a real estate agent in Leeuwarden vary per office, property type and sales approach. Therefore, compare multiple quotes and also look at the real estate agents in Leeuwarden to better compare rates, presentation and local experience.
On this page we currently show 1.055 sold houses in Leeuwarden from our selection. This helps you to better assess recent transactions and the local housing market.
Houses sold in Leeuwarden give insight into asking prices, house types and neighborhoods where recent transactions have taken place. Compare this also with the current housing stock in Leeuwarden to better understand the market.
Je kunt verkochte woningen gebruiken als eerste marktindicatie, maar een lokale makelaar kan beter rekening houden met afwerking, ligging, onderhoud en actuele vraag in Leeuwarden. Plan de volgende stap via de gids huis verkopen in Leeuwarden.
Vergelijk makelaars in Leeuwarden op lokale verkoopervaring, reviews, verwachte opbrengst, courtage en marketingaanpak. Bekijk verkoopmakelaars in Leeuwarden of de top 10 makelaars in Leeuwarden om snel sterke kantoren te ontdekken.
View current location data on residents, WOZ development, housing stock, energy consumption, business activity and safety in Leeuwarden. In 2025 were there 92.305 residents. The average WOZ value in 2025 is EUR 231.856.
These figures help to better assess and compare the housing stock in Leeuwarden with recent sold homes. Orient yourself then on suitable top real estate agents in Leeuwarden for sales advice in this region.
Residents
92.305
Last year: 2025
Average WOZ
EUR 231.856
Last year: 2025
Average income per person.
EUR 29.253
Source: AllNumbers
Crimes (current year)
6.497
Total registered
| Year | Residents |
|---|---|
| 2021 | 87.170 |
| 2022 | 88.035 |
| 2023 | 89.220 |
| 2024 | 91.125 |
| 2025 | 92.305 |
| Year | Average WOZ |
|---|---|
| 2021 | EUR 159.463 |
| 2022 | EUR 178.137 |
| 2023 | EUR 206.426 |
| 2024 | EUR 219.395 |
| 2025 | EUR 231.856 |
Hoger
22.610
Praktisch
17.660
Middelbaar
31.550
Europa
7.600
Nederland
67.760
Buiten Europa
16.935
Label A
13.887
Label C
12.288
Label B
6.802
Label F
4.296
Label D
3.948
Label G
3.635
Label E
3.488
Label A+
1.262
Label A+++
1.174
Label A++
583
Label A++++
149
Label A+++++
8
| Year | Gas (m3) | Electricity (kWh) |
|---|---|---|
| 2020 | 1.015 | 2.132 |
| 2021 | 1.125 | 2.180 |
| 2022 | 864 | 2.065 |
| 2023 | 746 | 1.971 |
| 2024 | 729 | 2.005 |
Hoekwoning
Gas: 968 • Electricity: 2.331
Huurwoning
Gas: 637 • Electricity: 1.708
Koopwoning
Gas: 899 • Electricity: 2.302
Appartement
Gas: 539 • Electricity: 1.578
Tussenwoning
Gas: 858 • Electricity: 2.187
Vrijstaande woning
Gas: 1.345 • Electricity: 3.057
Twee-onder-één-kap woning
Gas: 1.091 • Electricity: 2.563
Total number of company establishments: 11.435
| Period | Crimes |
|---|---|
| jan 2025 | 507 |
| jan 2026 | 444 |
| jul 2025 | 528 |
| jun 2025 | 554 |
| mei 2025 | 550 |
| mrt 2025 | 540 |
| nov 2024 | 484 |
| nov 2025 | 518 |
| okt 2024 | 554 |
| okt 2025 | 618 |
| sep 2024 | 542 |
| sep 2025 | 573 |
These figures give an indicative picture of safety trends in the living environment of Leeuwarden.
Short answers based on current local statistics, handy for a quick comparison of the living environment.
Leeuwarden telt in 2025 ongeveer 92.305 inwoners.
De gemiddelde WOZ-waarde in Leeuwarden is in 2025 circa € 231.856.
Het gemiddelde inkomen per inwoner in Leeuwarden ligt rond € 29.253 per jaar.
Voor het huidige jaar gaat het om ongeveer 6.497 geregistreerde misdrijven. Gebruik deze cijfers als indicatie en vergelijk trends per periode.
In Leeuwarden komt vooral "Appartementen" veel voor, met ongeveer 24.726 woningen.