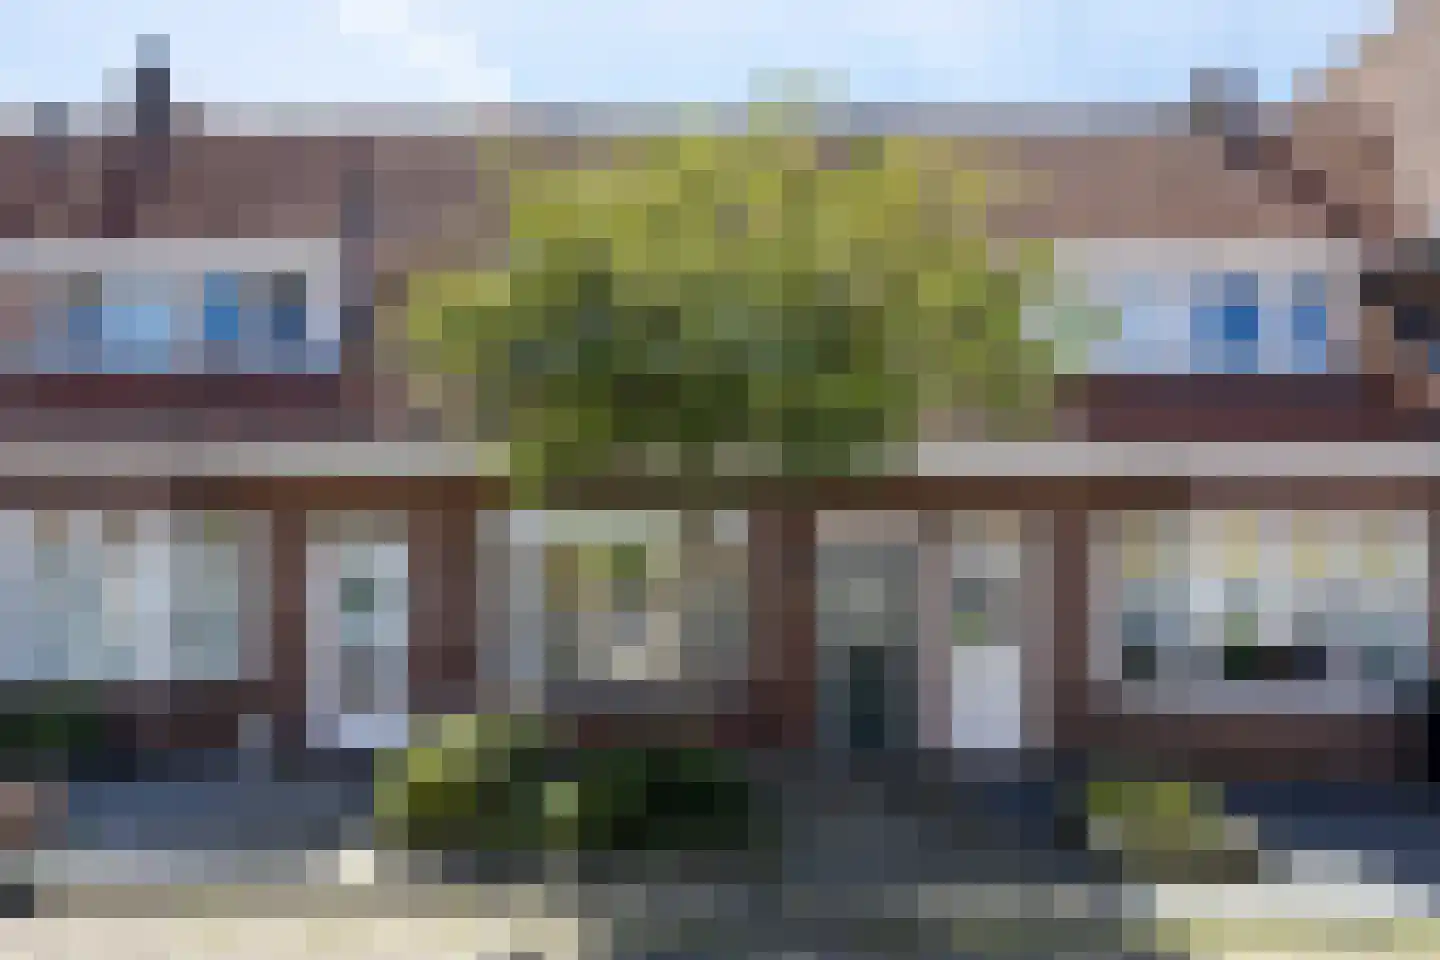
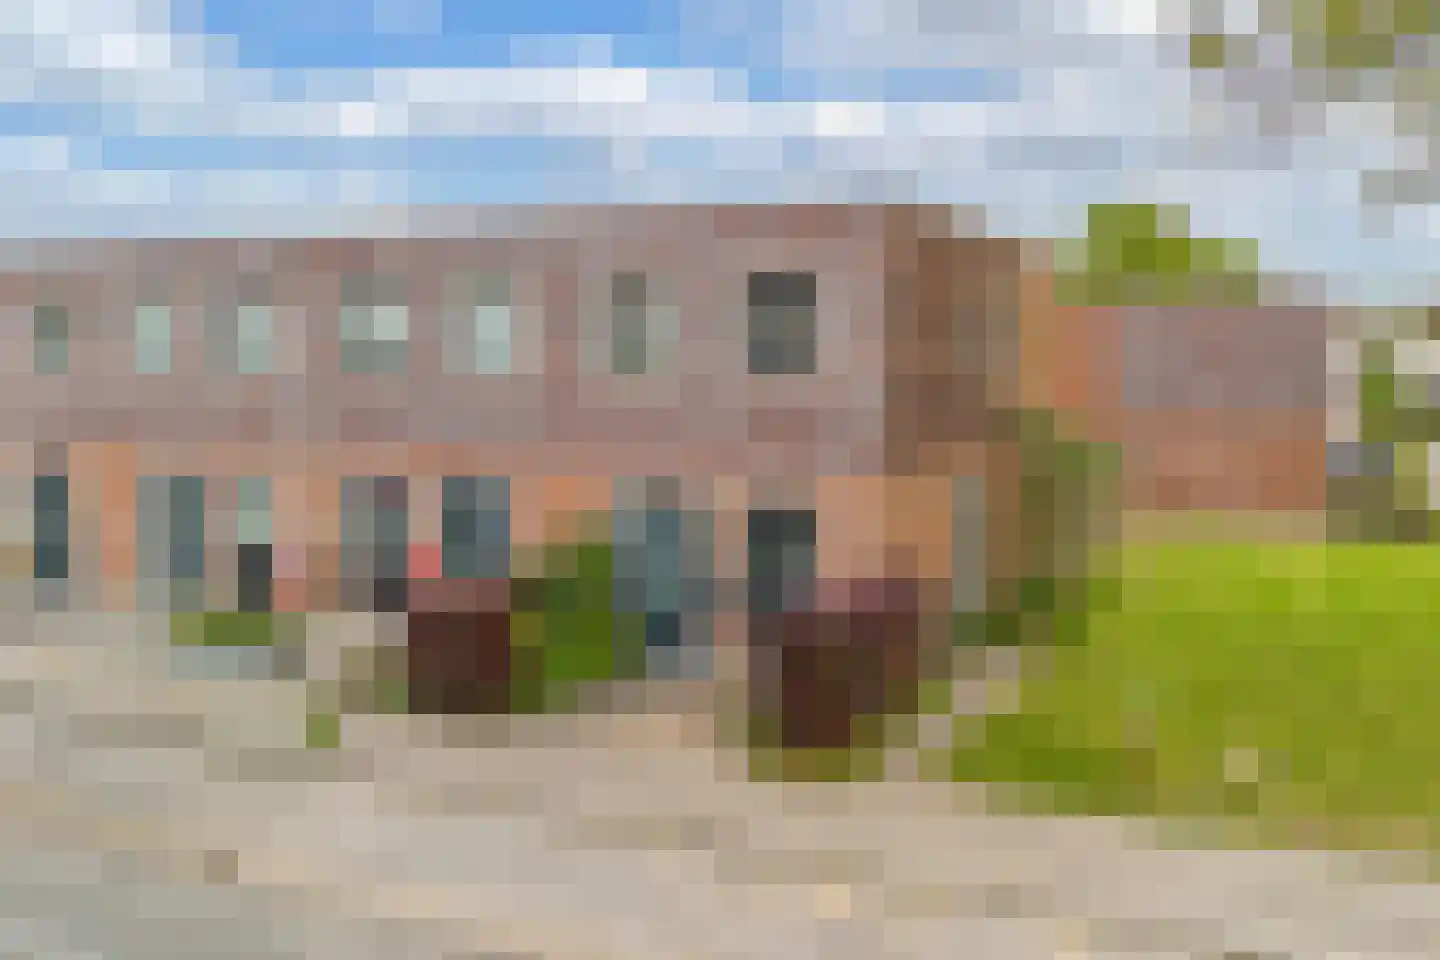
- Available
Herenwaltje 6 4
8911HN Leeuwarden
€ 630 p/m
€ 39/m²
- Living area
- 16 m²
- Land area
- —
- Bedrooms
- 1
Searching in 1.537 houses in Leeuwarden
Type to search. Use arrow down and arrow up to navigate through results and press Enter to open.
Hidden search suggestions.
View current properties in Leeuwarden or search targeted on street, postal code and property characteristics.
View the current housing stock in Leeuwarden and quickly filter by price, living area, rooms and more. There are currently 1.537 houses in this place within our selection. View also 1.029 sold houses in Leeuwarden for extra insight into the local housing market.
8911HN Leeuwarden
€ 630 p/m
€ 39/m²
8911DS Leeuwarden
€ 375.000 k.k.
€ 5.208/m²
8911DS Leeuwarden
€ 495.000 k.k.
€ 5.756/m²
8918CT Leeuwarden
€ 1.093 p/m
€ 15/m²
8921VT Leeuwarden
€ 259.000 k.k.
€ 2.643/m²
8932PG Leeuwarden
€ 778 p/m
€ 27/m²
8911DC Leeuwarden
€ 375.000 k.k.
€ 4.360/m²
8915DB Leeuwarden
€ 350.000 k.k.
€ 2.555/m²
8913AR Leeuwarden
€ 275.000 k.k.
€ 3.618/m²
8939AN Leeuwarden
€ 650.000 k.k.
€ 3.779/m²
8911GW Leeuwarden
€ 225.000 k.k.
€ 4.018/m²
8921GE Leeuwarden
€ 279.000 k.k.
€ 3.875/m²
8933DT Leeuwarden
€ 340.000 k.k.
€ 3.178/m²
8911GP Leeuwarden
€ 269.000 k.k.
€ 4.559/m²
8939BT Leeuwarden
€ 795.000 k.k.
€ 4.274/m²
8918LA Leeuwarden
€ 289.000 k.k.
€ 3.853/m²
8923CL Leeuwarden
€ 450.000 k.k.
€ 3.147/m²
8932DS Leeuwarden
€ 275.000 k.k.
€ 3.873/m²
8932JR Leeuwarden
€ 267.500 k.k.
€ 2.758/m²
8926NR Leeuwarden
€ 309.000 k.k.
€ 2.915/m²
8913GD Leeuwarden
€ 365.000 k.k.
€ 3.476/m²
8918GN Leeuwarden
€ 249.000 k.k.
€ 2.075/m²
8915CM Leeuwarden
€ 185.000 k.k.
€ 3.364/m²
8939BL Leeuwarden
€ 495.000 k.k.
€ 4.125/m²
8932LA Leeuwarden
€ 395.000 k.k.
€ 3.835/m²
8918LL Leeuwarden
€ 370.000 k.k.
€ 3.978/m²
8917AL Leeuwarden
€ 925.000 k.k.
€ 3.642/m²
8931BJ Leeuwarden
€ 675.000 k.k.
€ 4.193/m²
Get free quotes from real estate agents with local market knowledge. Compare more than 45 real estate agents in Leeuwarden.
Selling a home in Leeuwarden? View the sales-oriented guide sell a house in Leeuwarden, compare all real estate agents in Leeuwarden or view the top 10 real estate agents in Leeuwarden for extra context to your choice.
Real estate agents make sharper offers when they know you're comparing — ask for quotes for sale or purchase.
Practical answers about housing supply, sales and comparing real estate agents in Leeuwarden.
The costs of a real estate agent in Leeuwarden depend on commission, setup costs, property presentation and the chosen service. Compare the 45 real estate agents in Leeuwarden via the real estate agent page and request multiple quotes to compare rates and approach well.
Within our selection, we are currently showing 1.537 houses in Leeuwarden. View also the sold houses in Leeuwarden to compare the current offering with recent transactions.
Take into account not only price and living area but also maintenance, energy label, location, outdoor space and sales status. This way you compare houses in Leeuwarden on more than just the asking price.
A local real estate agent knows the neighborhoods, recent transactions and demand in Leeuwarden. By comparing 45 real estate agents in the region you get a better insight into prices, sales strategy and expected yield; the top 10 in Leeuwarden provides a useful starting point.
Yes, when making a sales plan, a valuation in Leeuwarden is wise. You gain insight into a realistic asking price and can then compare offers from real estate agents specifically.
View current location data on residents, WOZ development, housing stock, energy consumption, business activity and safety in Leeuwarden. In 2026 were there 92.685 residents. The average WOZ value in 2025 is EUR 231.856.
These figures help to better assess and compare the housing stock in Leeuwarden with recent sold homes. Orient yourself then on suitable top real estate agents in Leeuwarden for sales advice in this region.
Residents
92.685
Last year: 2026
Average WOZ
EUR 231.856
Last year: 2025
Average income per person.
EUR 29.253
Source: AllNumbers
Crimes (current year)
6.497
Total registered
| Year | Residents |
|---|---|
| 2021 | 87.170 |
| 2022 | 88.035 |
| 2023 | 89.220 |
| 2024 | 91.125 |
| 2025 | 92.305 |
| 2026 | 92.685 |
| Year | Average WOZ |
|---|---|
| 2021 | EUR 159.463 |
| 2022 | EUR 178.137 |
| 2023 | EUR 206.426 |
| 2024 | EUR 219.395 |
| 2025 | EUR 231.856 |
Hoger
22.610
Praktisch
17.660
Middelbaar
31.550
Europa
7.600
Nederland
67.760
Buiten Europa
16.935
Label A
13.887
Label C
12.288
Label B
6.802
Label F
4.296
Label D
3.948
Label G
3.635
Label E
3.488
Label A+
1.262
Label A+++
1.174
Label A++
583
Label A++++
149
Label A+++++
8
| Year | Gas (m3) | Electricity (kWh) |
|---|---|---|
| 2020 | 1.015 | 2.132 |
| 2021 | 1.125 | 2.180 |
| 2022 | 864 | 2.065 |
| 2023 | 746 | 1.971 |
| 2024 | 729 | 2.005 |
Hoekwoning
Gas: 968 • Electricity: 2.331
Huurwoning
Gas: 637 • Electricity: 1.708
Koopwoning
Gas: 899 • Electricity: 2.302
Appartement
Gas: 539 • Electricity: 1.578
Tussenwoning
Gas: 858 • Electricity: 2.187
Vrijstaande woning
Gas: 1.345 • Electricity: 3.057
Twee-onder-één-kap woning
Gas: 1.091 • Electricity: 2.563
Total number of company establishments: 11.435
| Period | Crimes |
|---|---|
| jan 2026 | 442 |
| jul 2025 | 528 |
| jun 2025 | 554 |
| mei 2025 | 550 |
| mrt 2025 | 540 |
| mrt 2026 | 571 |
| nov 2024 | 484 |
| nov 2025 | 518 |
| okt 2024 | 554 |
| okt 2025 | 618 |
| sep 2024 | 542 |
| sep 2025 | 573 |
These figures give an indicative picture of safety trends in the living environment of Leeuwarden.
Short answers based on current local statistics, handy for a quick comparison of the living environment.
Leeuwarden telt in 2026 ongeveer 92.685 inwoners.
De gemiddelde WOZ-waarde in Leeuwarden is in 2025 circa € 231.856.
Het gemiddelde inkomen per inwoner in Leeuwarden ligt rond € 29.253 per jaar.
Voor het huidige jaar gaat het om ongeveer 6.497 geregistreerde misdrijven. Gebruik deze cijfers als indicatie en vergelijk trends per periode.
In Leeuwarden komt vooral "Appartementen" veel voor, met ongeveer 24.726 woningen.