- Sold
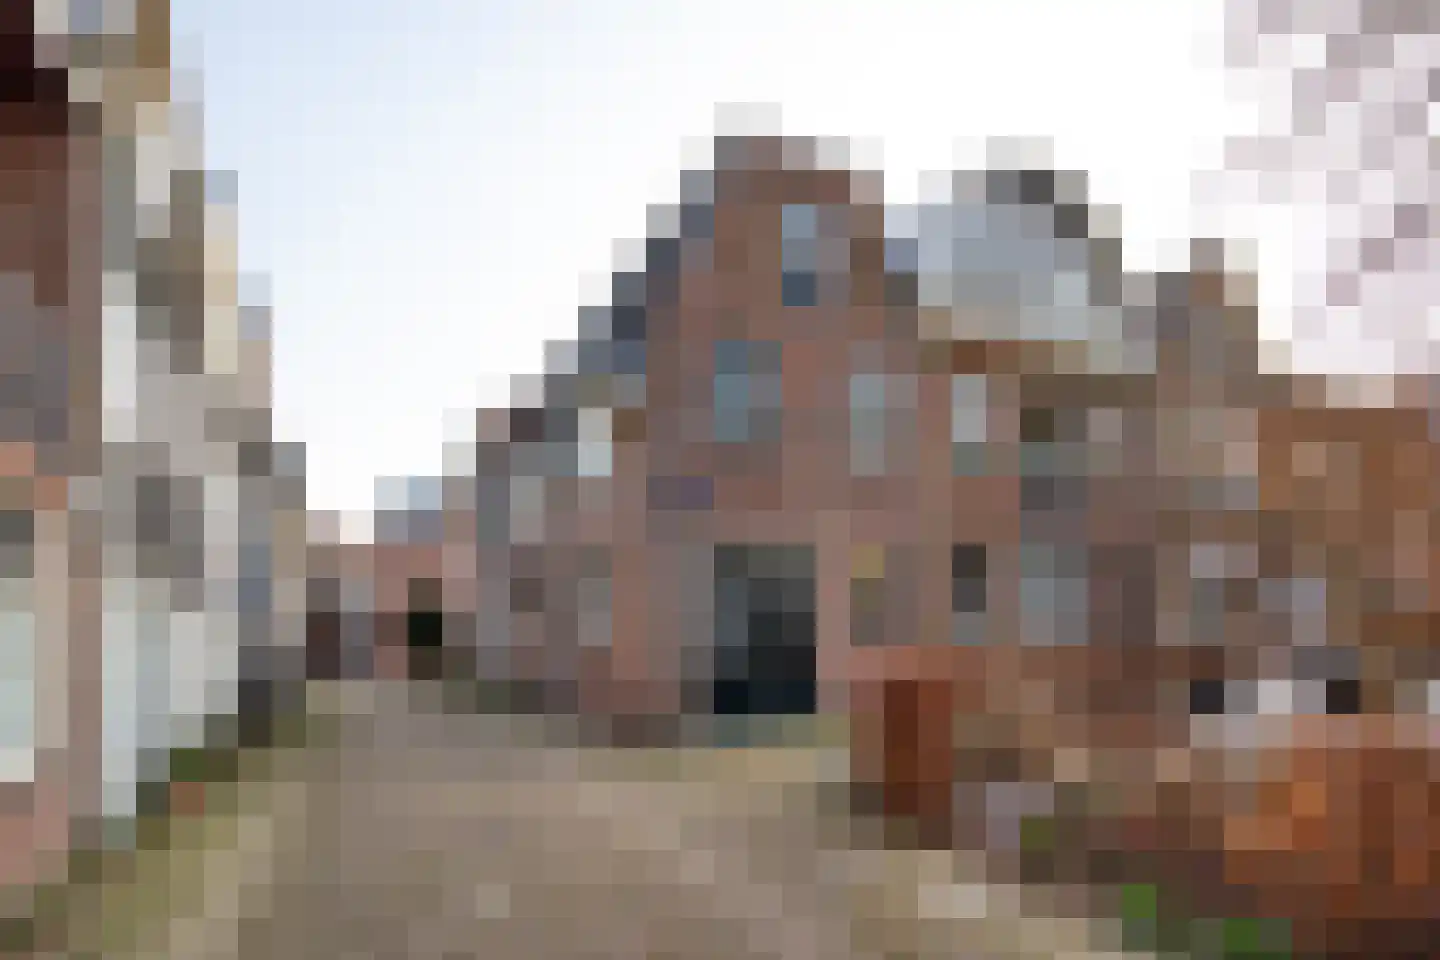
Rijn en Schiekade 143
2311AW Leiden
€ 600.000 k.k.
€ 8.955/m²
A
Save as favorite
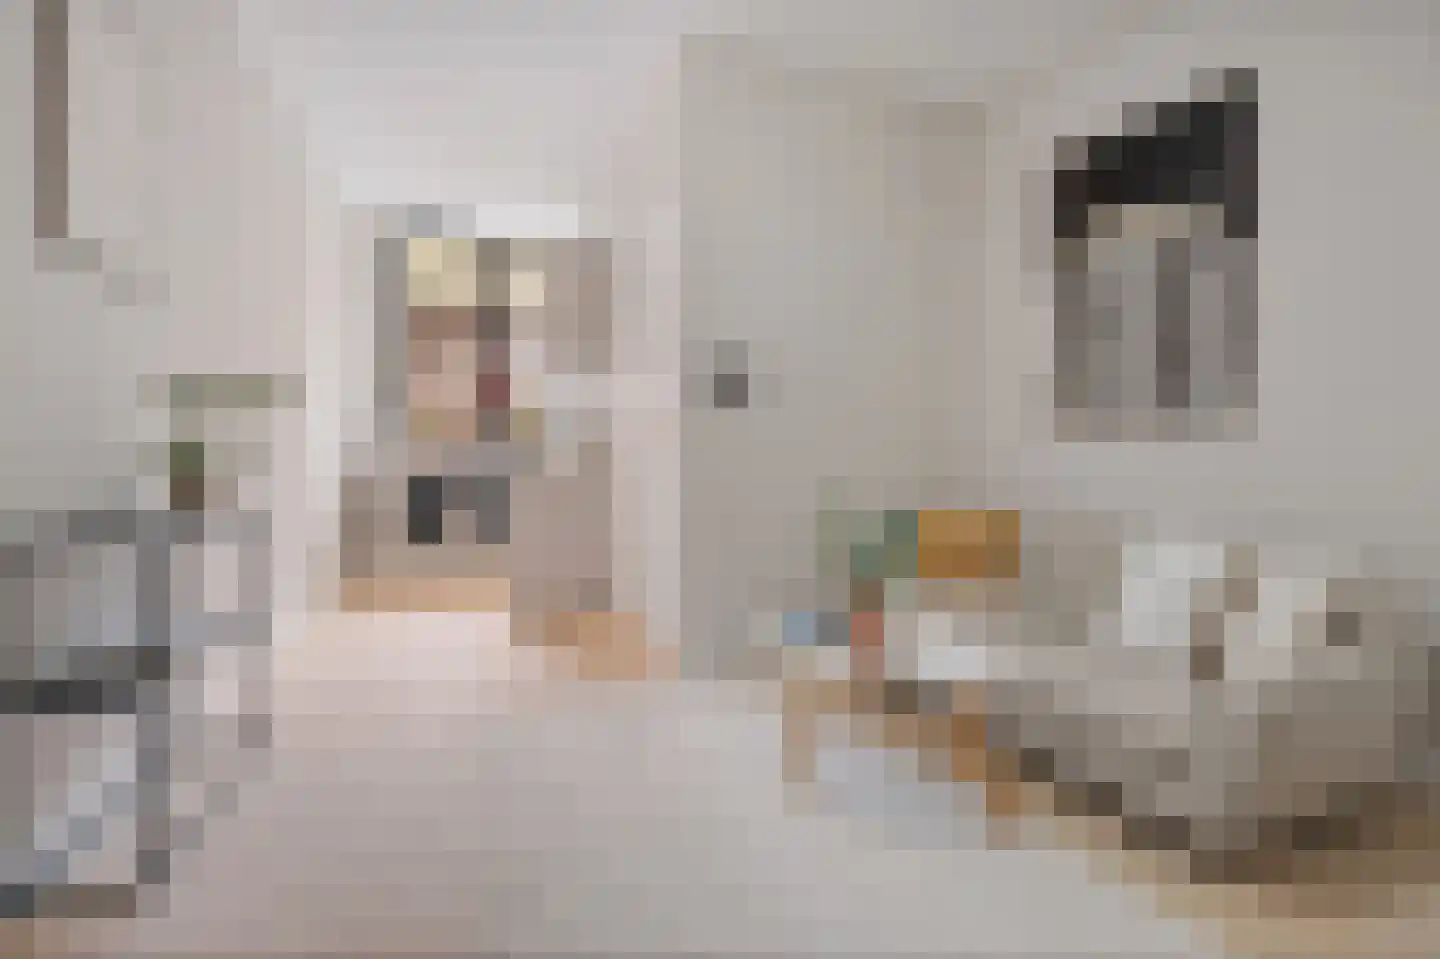
- Living area
- 67 m²
- Land area
- 100 m²
- Bedrooms
- 2