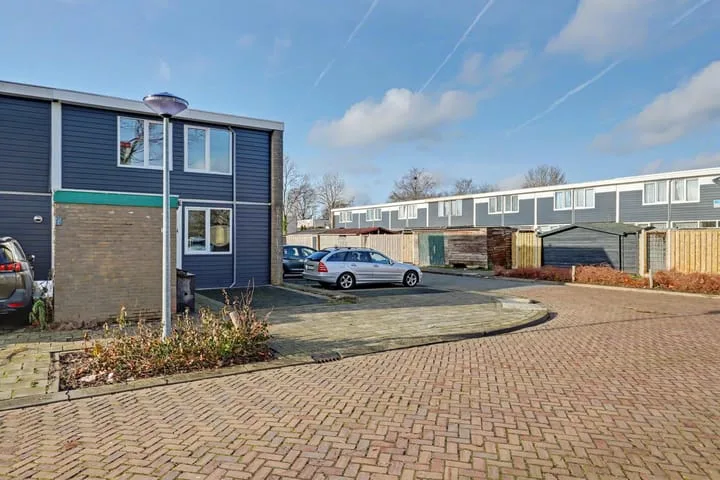
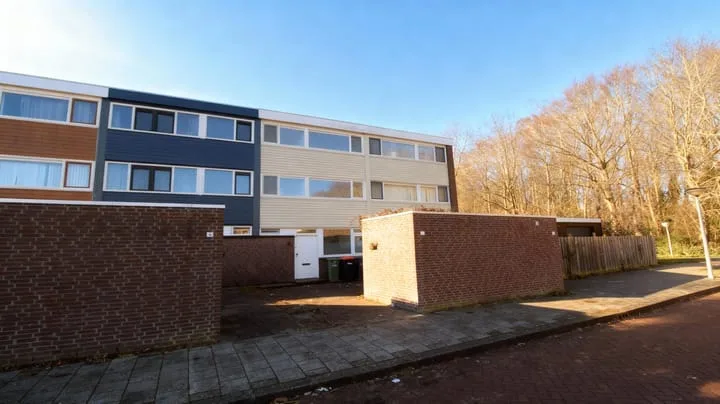
- Sold
Texelstroom 43
8223XK Lelystad
€ 295.000 k.k.
€ 2.657/m²
- Living area
- 111 m²
- Land area
- 104 m²
- Bedrooms
- 5
View 868 sold houses in Lelystad
Type to search. Use arrow down and arrow up to navigate through results and press Enter to open.
Hidden search suggestions.
Compare sold homes in Lelystad or view the current offering in this location directly.
On this page you will find recently sold homes in Lelystad. Use this overview to better estimate selling prices, popular neighborhoods, and the local housing supply before you choose a real estate agent. Also view the current housing supply with 1.215 houses in Lelystad.
8223XK Lelystad
€ 295.000 k.k.
€ 2.657/m²
8224ZM Lelystad
€ 275.000 k.k.
€ 2.669/m²
8244CH Lelystad
€ 355.000 k.k.
€ 3.317/m²
8232MR Lelystad
€ 335.000 k.k.
€ 3.681/m²
8245BG Lelystad
€ 625.000 k.k.
€ 3.434/m²
8245CV Lelystad
€ 485.000 k.k.
€ 3.818/m²
8245CN Lelystad
€ 650.000 k.k.
€ 3.385/m²
8224JS Lelystad
€ 375.000 k.k.
€ 3.865/m²
8245HD Lelystad
€ 619.500 k.k.
€ 5.900/m²
8232ND Lelystad
€ 365.000 k.k.
€ 3.348/m²
8219CD Lelystad
€ 795.000 k.k.
€ 5.482/m²
8232ME Lelystad
€ 350.000 k.k.
€ 3.804/m²
8231KH Lelystad
€ 289.500 k.k.
€ 2.895/m²
8231EN Lelystad
€ 325.000 k.k.
€ 2.954/m²
8245HC Lelystad
€ 325.000 k.k.
€ 5.508/m²
8223DW Lelystad
€ 300.000 k.k.
€ 2.631/m²
8245EA Lelystad
€ 595.000 k.k.
€ 3.940/m²
8226LK Lelystad
€ 339.000 k.k.
€ 3.110/m²
8245GN Lelystad
€ 335.000 k.k.
€ 3.941/m²
8244PD Lelystad
€ 235.000 k.k.
€ 5.222/m²
8225DW Lelystad
€ 369.500 k.k.
€ 3.269/m²
8231VK Lelystad
Price upon request
8232RJ Lelystad
€ 400.000 k.k.
€ 3.703/m²
8231AP Lelystad
€ 500.000 k.k.
€ 3.571/m²
8243WK Lelystad
€ 335.000 k.k.
€ 3.941/m²
8232KT Lelystad
€ 325.000 k.k.
€ 3.186/m²
8245HW Lelystad
€ 495.000 k.k.
€ 3.367/m²
8225LA Lelystad
€ 365.000 k.k.
€ 3.201/m²
Get free quotes from realtors with local market knowledge in Lelystad.
Selling a home in Lelystad? Compare real estate agents who know the local housing market. Also check out all real estate agents in Lelystad or the top 10 real estate agents in Lelystad for extra context for your choice.
By comparing brokers and requesting quotes
Short answers about housing prices, sold homes and comparing real estate agents in Lelystad.
The costs of a real estate agent in Lelystad vary per office, property type and sales approach. Therefore, compare multiple quotes and also look at the real estate agents in Lelystad to better compare rates, presentation and local experience.
On this page we currently show 868 sold houses in Lelystad from our selection. This helps you to better assess recent transactions and the local housing market.
Verkochte woningen in Lelystad geven inzicht in vraagprijzen, woningtypes en buurten waar recent transacties hebben plaatsgevonden. Vergelijk dit ook met het actuele woningaanbod in Lelystad om de markt beter te duiden.
Je kunt verkochte woningen gebruiken als eerste marktindicatie, maar een lokale makelaar kan beter rekening houden met afwerking, ligging, onderhoud en actuele vraag in Lelystad.
Vergelijk makelaars in Lelystad op lokale verkoopervaring, reviews, verwachte opbrengst, courtage en marketingaanpak. De top 10 makelaars in Lelystad helpt om snel sterke kantoren te ontdekken.
View current location data on residents, WOZ development, housing stock, energy consumption, business activity and safety in Lelystad. In 2026 were there 85.758 residents. The average WOZ value in 2025 is EUR 350.000.
These figures help to better assess and compare the housing stock in Lelystad with recent sold homes. Orient yourself then on suitable top real estate agents in Lelystad for sales advice in this region.
Residents
85.758
Last year: 2026
Average WOZ
EUR 350.000
Last year: 2025
Average income per person.
EUR 31.800
Source: AllNumbers
Crimes (current year)
3.662
Total registered
| Year | Residents |
|---|---|
| 2022 | 81.214 |
| 2023 | 83.033 |
| 2024 | 84.080 |
| 2025 | 84.713 |
| 2026 | 85.758 |
| Year | Average WOZ |
|---|---|
| 2021 | EUR 228.000 |
| 2022 | EUR 259.000 |
| 2023 | EUR 326.000 |
| 2024 | EUR 342.000 |
| 2025 | EUR 350.000 |
Hoger
25
Praktisch
30
Middelbaar
44
Europa
8.972
Nederland
50.785
Buiten Europa
24.956
Label C
13.774
Label A
11.377
Label B
8.074
Label D
1.321
Label A+++
1.073
Label A+
927
Label A++
831
Label E
161
Label A++++
98
Label F
55
Label G
25
Label A+++++
21
| Year | Gas (m3) | Electricity (kWh) |
|---|---|---|
| 2020 | 950 | 2.940 |
| 2021 | 1.080 | 2.990 |
| 2022 | 840 | 2.840 |
| 2023 | 710 | 2.690 |
| 2024 | 700 | 2.770 |
Hoekwoning
Gas: 790 • Electricity: 2.720
Huurwoning
Gas: 670 • Electricity: 2.150
Koopwoning
Gas: 740 • Electricity: 3.030
Appartement
Gas: 500 • Electricity: 1.900
Tussenwoning
Gas: 720 • Electricity: 2.600
Vrijstaande woning
Gas: 990 • Electricity: 4.240
Twee-onder-één-kap woning
Gas: 630 • Electricity: 3.460
Total number of company establishments: 10.950
| Period | Crimes |
|---|---|
| jan 2025 | 278 |
| jan 2026 | 260 |
| jul 2025 | 323 |
| jun 2025 | 322 |
| mei 2025 | 301 |
| mrt 2025 | 270 |
| nov 2024 | 332 |
| nov 2025 | 312 |
| okt 2024 | 293 |
| okt 2025 | 298 |
| sep 2024 | 358 |
| sep 2025 | 334 |
These figures give an indicative picture of safety trends in the living environment of Lelystad.
Short answers based on current local statistics, handy for a quick comparison of the living environment.
Lelystad telt in 2026 ongeveer 85.758 inwoners.
De gemiddelde WOZ-waarde in Lelystad is in 2025 circa € 350.000.
Het gemiddelde inkomen per inwoner in Lelystad ligt rond € 31.800 per jaar.
Voor het huidige jaar gaat het om ongeveer 3.662 geregistreerde misdrijven. Gebruik deze cijfers als indicatie en vergelijk trends per periode.
In Lelystad komt vooral "Tussenwoningen" veel voor, met ongeveer 17.317 woningen.