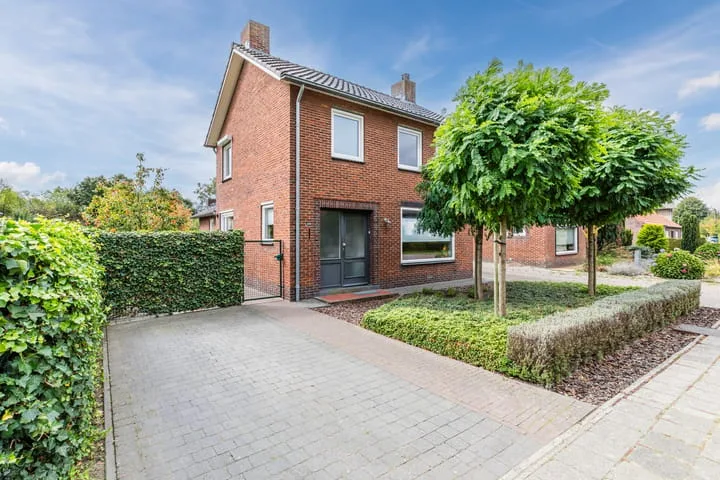
- Sold
Clausstraat 1
6031DE Nederweert
€ 887.500 k.k.
€ 4.438/m²
- Living area
- 200 m²
- Land area
- 695 m²
- Bedrooms
- 4
View 71 sold houses in Nederweert
Type to search. Use arrow down and arrow up to navigate through results and press Enter to open.
Hidden search suggestions.
Compare sold homes in Nederweert or view the current offering in this location directly.
On this page you will find recently sold homes in Nederweert. Use this overview to better estimate selling prices, popular neighborhoods, and the local housing supply before you choose a real estate agent. Also view the current housing supply with 86 houses in Nederweert.
6031DE Nederweert
€ 887.500 k.k.
€ 4.438/m²
6031EE Nederweert
€ 500.000 k.k.
€ 3.759/m²
6031XZ Nederweert
€ 489.000 k.k.
€ 4.327/m²
6031WB Nederweert
€ 350.000 k.k.
€ 3.181/m²
6031XP Nederweert
€ 575.000 k.k.
€ 3.685/m²
6031JP Nederweert
€ 590.000 k.k.
€ 4.013/m²
6031AG Nederweert
€ 459.000 k.k.
€ 3.923/m²
6031DE Nederweert
€ 485.000 k.k.
€ 3.255/m²
6031VM Nederweert
€ 775.000 k.k.
€ 3.638/m²
6031BH Nederweert
€ 315.000 k.k.
€ 4.090/m²
6031AS Nederweert
€ 395.000 k.k.
€ 3.185/m²
6031TA Nederweert
€ 550.000 k.k.
€ 2.350/m²
6031CV Nederweert
€ 469.000 k.k.
€ 4.114/m²
6031BB Nederweert
€ 450.000 k.k.
€ 2.662/m²
6031WB Nederweert
€ 375.000 k.k.
€ 3.989/m²
6031VZ Nederweert
€ 399.000 k.k.
€ 4.113/m²
6031MZ Nederweert
€ 595.000 k.k.
€ 3.164/m²
6031AH Nederweert
€ 325.000 k.k.
€ 2.927/m²
6031BC Nederweert
€ 285.000 k.k.
€ 3.904/m²
6031JE Nederweert
€ 435.000 k.k.
€ 3.686/m²
6031AS Nederweert
€ 359.000 k.k.
€ 0/m²
6031TC Nederweert
€ 575.000 k.k.
€ 2.662/m²
6031XT Nederweert
€ 455.000 k.k.
€ 2.808/m²
6031PH Nederweert
€ 519.000 k.k.
€ 4.152/m²
6031ER Nederweert
€ 395.000 k.k.
€ 3.376/m²
6031HP Nederweert
€ 735.000 k.k.
€ 3.567/m²
6031JR Nederweert
€ 575.000 k.k.
€ 4.831/m²
6031AK Nederweert
€ 385.000 k.k.
€ 2.483/m²
Bekijk recente verkopen en ontvang gratis offertes van lokale makelaars. Vergelijk meer dan 19 makelaars in Nederweert.
Zelf je woning verkopen in Nederweert? Vergelijk verkoopmakelaars in Nederweert of bekijk de beste verkoopmakelaars in Nederweert als referentie bij jouw keuze.
Makelaars maken scherpere voorstellen als ze weten dat je vergelijkt — vraag offertes aan voor verkoop of aankoop.
Short answers about housing prices, sold homes and comparing real estate agents in Nederweert.
De kosten van een makelaar in Nederweert verschillen per kantoor, woningtype en verkoopaanpak. In Nederweert kun je 19 real estate agents vergelijken; bekijk daarom ook de makelaars in Nederweert om tarieven, presentatie en lokale ervaring beter naast elkaar te zetten.
On this page we currently show 71 sold houses in Nederweert from our selection. This helps you to better assess recent transactions and the local housing market.
Houses sold in Nederweert give insight into asking prices, house types and neighborhoods where recent transactions have taken place. Compare this also with the current housing stock in Nederweert to better understand the market.
You can use sold homes as a first market indication, but a local real estate agent can better take into account finishing, location, maintenance and current demand in Nederweert.
Vergelijk de 19 real estate agents in Nederweert op lokale verkoopervaring, reviews, verwachte opbrengst, courtage en marketingaanpak. Bekijk verkoopmakelaars in Nederweert of de top 10 makelaars in Nederweert om snel sterke kantoren te ontdekken.
View current location data on residents, WOZ development, housing stock, energy consumption, business activity and safety in Nederweert. In 2026 were there 10.541 residents. The average WOZ value in 2025 is EUR 393.232.
These figures help to better assess and compare the housing stock in Nederweert with recent sold homes. Orient yourself then on suitable top real estate agents in Nederweert for sales advice in this region.
Residents
10.541
Last year: 2026
Average WOZ
EUR 393.232
Last year: 2025
Average income per person.
EUR 27.420
Source: AllNumbers
Crimes (current year)
248
Total registered
| Year | Residents |
|---|---|
| 2021 | 10.410 |
| 2022 | 10.510 |
| 2023 | 10.635 |
| 2024 | 10.595 |
| 2025 | 10.605 |
| 2026 | 10.541 |
| Year | Average WOZ |
|---|---|
| 2021 | EUR 296.408 |
| 2022 | EUR 307.872 |
| 2023 | EUR 361.351 |
| 2024 | EUR 364.267 |
| 2025 | EUR 393.232 |
Hoger
2.090
Praktisch
2.490
Middelbaar
3.160
Europa
775
Nederland
9.175
Buiten Europa
650
Label A
1.473
Label B
1.099
Label C
1.039
Label D
549
Label F
328
Label G
232
Label E
128
Label A+
94
Label A+++
86
Label A++
51
Label A++++
6
Label A+++++
5
| Year | Gas (m3) | Electricity (kWh) |
|---|---|---|
| 2020 | 1.357 | 3.248 |
| 2021 | 1.507 | 3.278 |
| 2022 | 1.173 | 3.081 |
| 2023 | 961 | 2.933 |
| 2024 | 929 | 3.032 |
Hoekwoning
Gas: 943 • Electricity: 2.709
Huurwoning
Gas: 766 • Electricity: 2.173
Koopwoning
Gas: 1.073 • Electricity: 3.327
Appartement
Gas: 535 • Electricity: 1.857
Tussenwoning
Gas: 862 • Electricity: 2.626
Vrijstaande woning
Gas: 1.281 • Electricity: 4.030
Twee-onder-één-kap woning
Gas: 1.014 • Electricity: 2.873
Total number of company establishments: 1.475
| Period | Crimes |
|---|---|
| jan 2026 | 16 |
| jul 2025 | 21 |
| jun 2025 | 20 |
| mei 2025 | 16 |
| mrt 2025 | 26 |
| mrt 2026 | 18 |
| nov 2024 | 27 |
| nov 2025 | 13 |
| okt 2024 | 29 |
| okt 2025 | 19 |
| sep 2024 | 27 |
| sep 2025 | 20 |
These figures give an indicative picture of safety trends in the living environment of Nederweert.
Short answers based on current local statistics, handy for a quick comparison of the living environment.
Nederweert telt in 2026 ongeveer 10.541 inwoners.
De gemiddelde WOZ-waarde in Nederweert is in 2025 circa € 393.232.
Het gemiddelde inkomen per inwoner in Nederweert ligt rond € 27.420 per jaar.
Voor het huidige jaar gaat het om ongeveer 248 geregistreerde misdrijven. Gebruik deze cijfers als indicatie en vergelijk trends per periode.
In Nederweert komt vooral "Vrijstaande woningen" veel voor, met ongeveer 1.346 woningen.