- Available
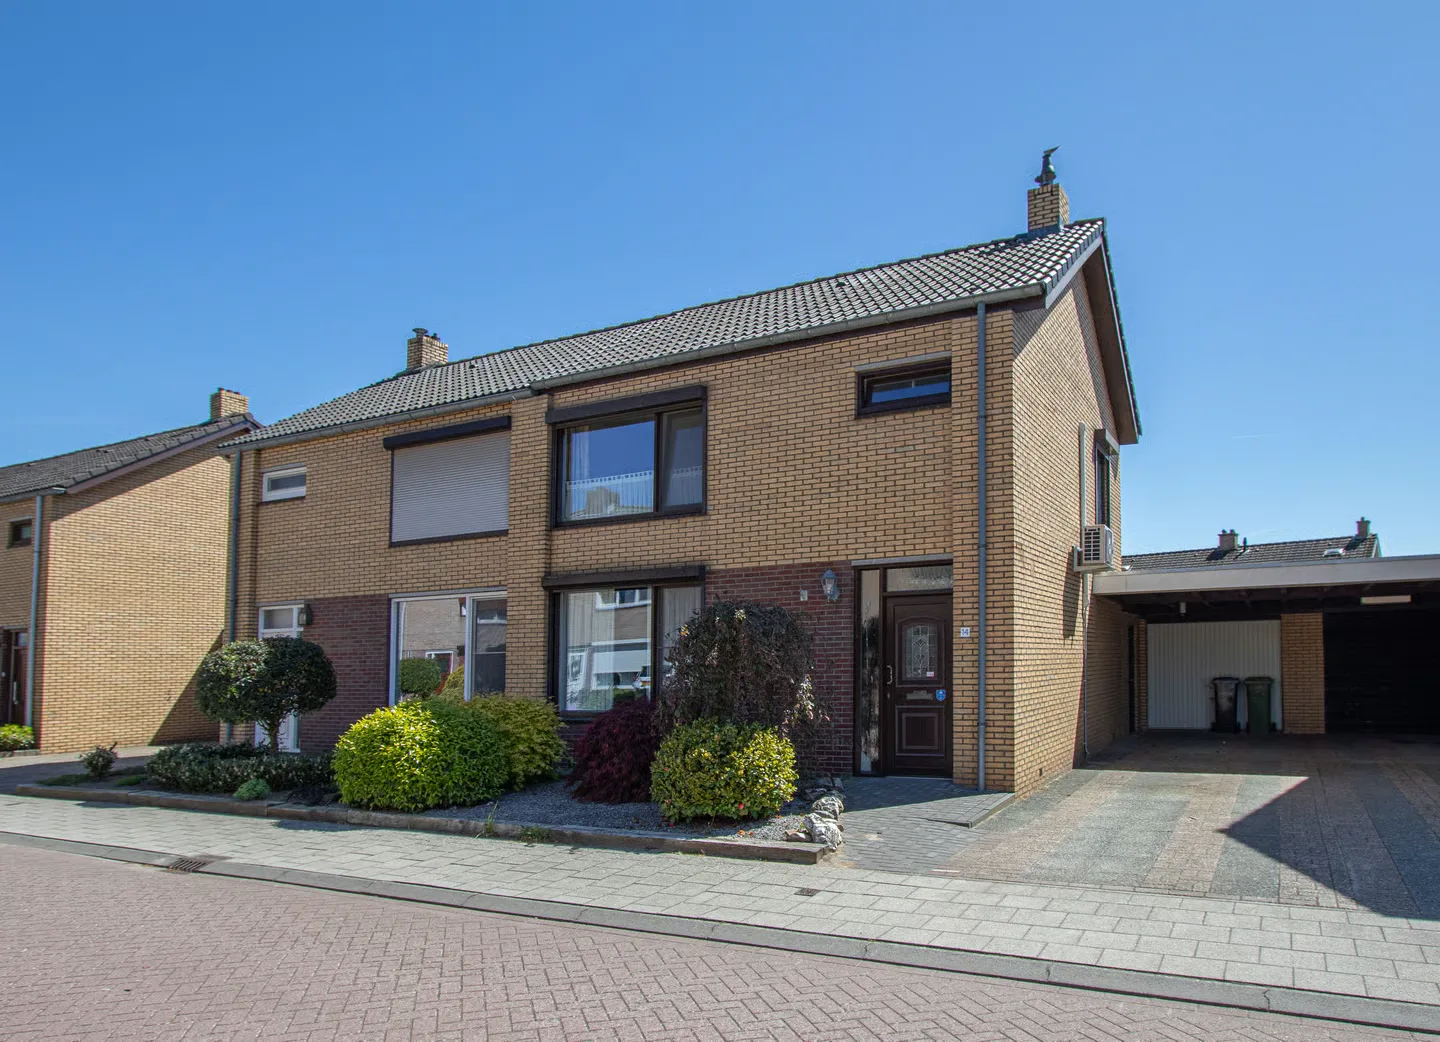
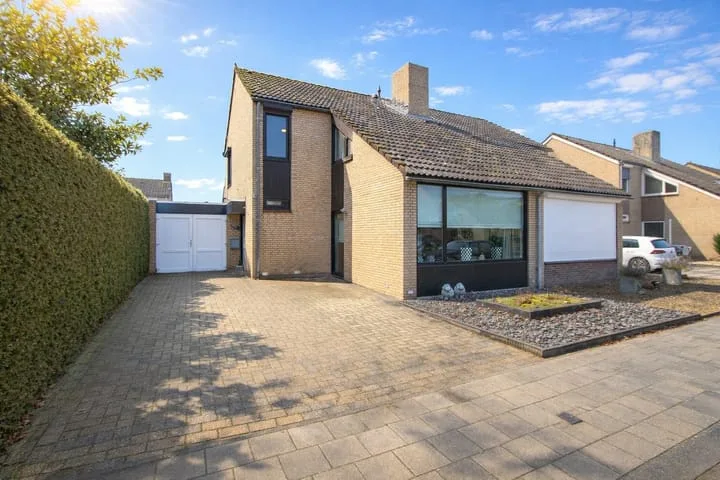
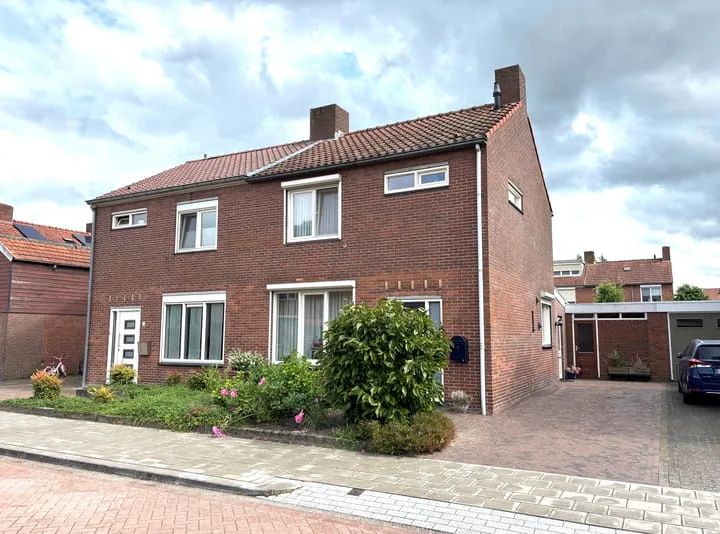
Berkenlaan 5
6086CP Neer
€ 325.000 k.k.
€ 3.186/m²
C
Save as favorite
- Living area
- 102 m²
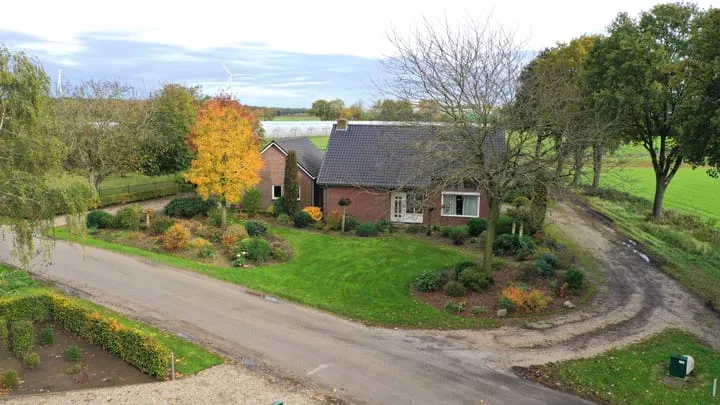
- Land area
- 243 m²
- Bedrooms
- 3