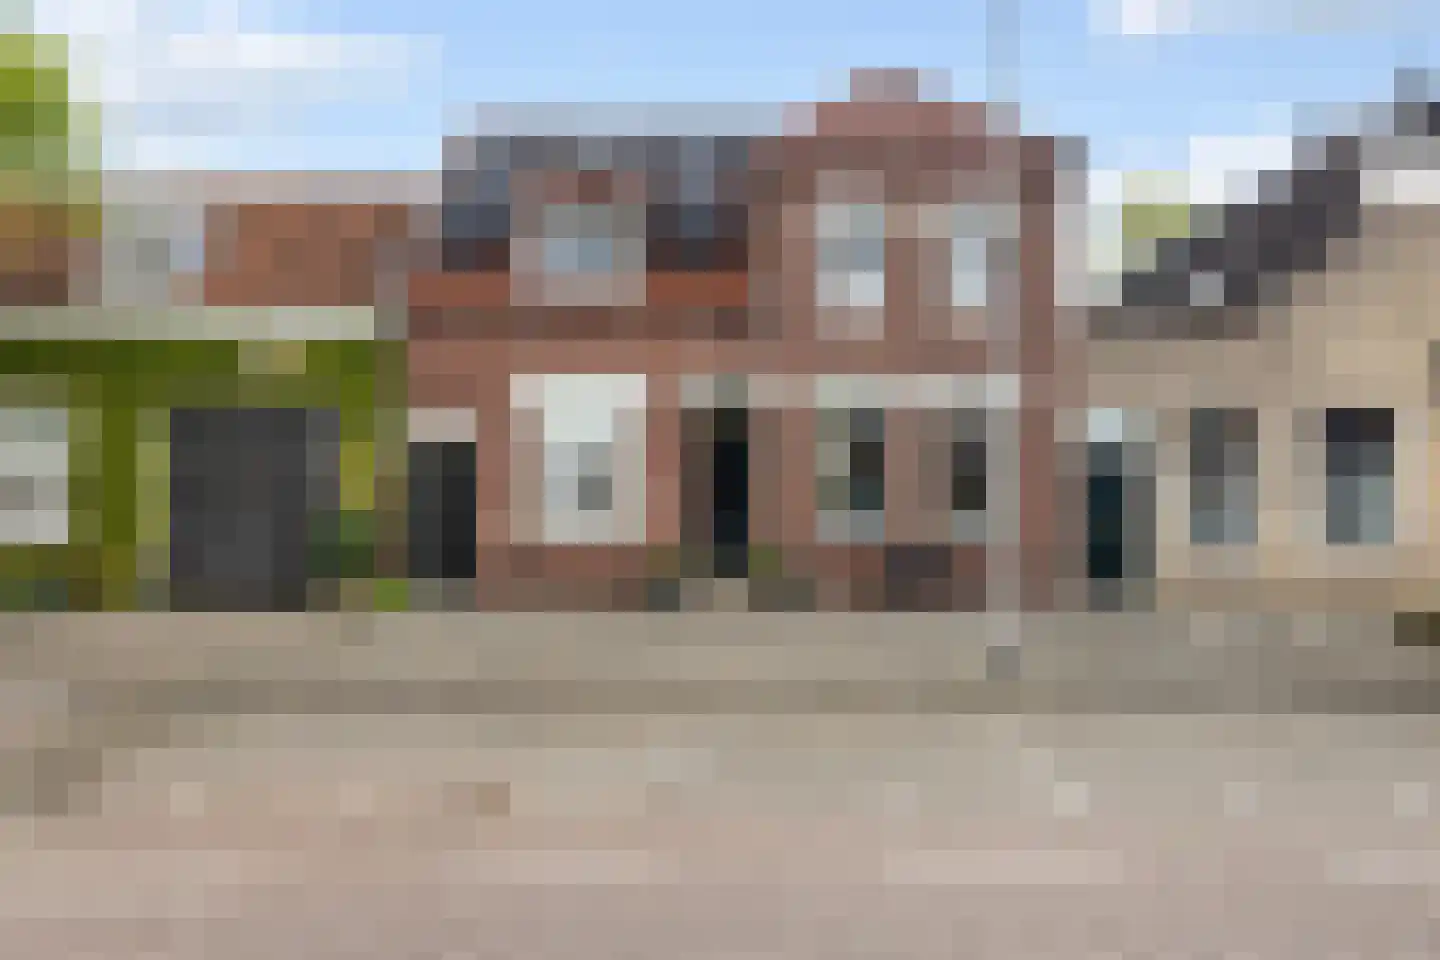
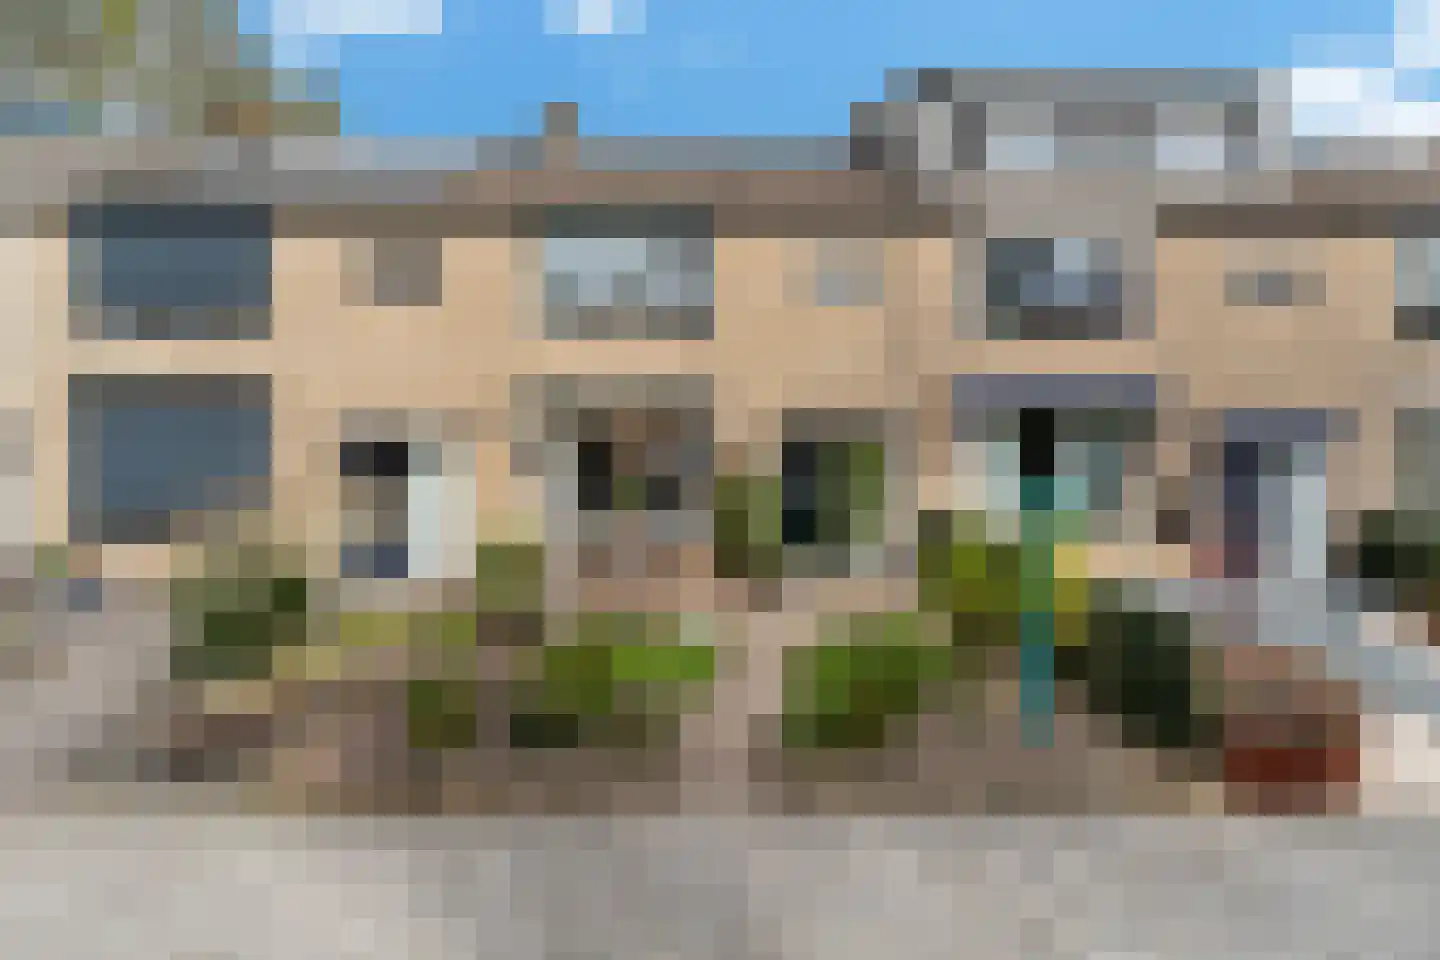
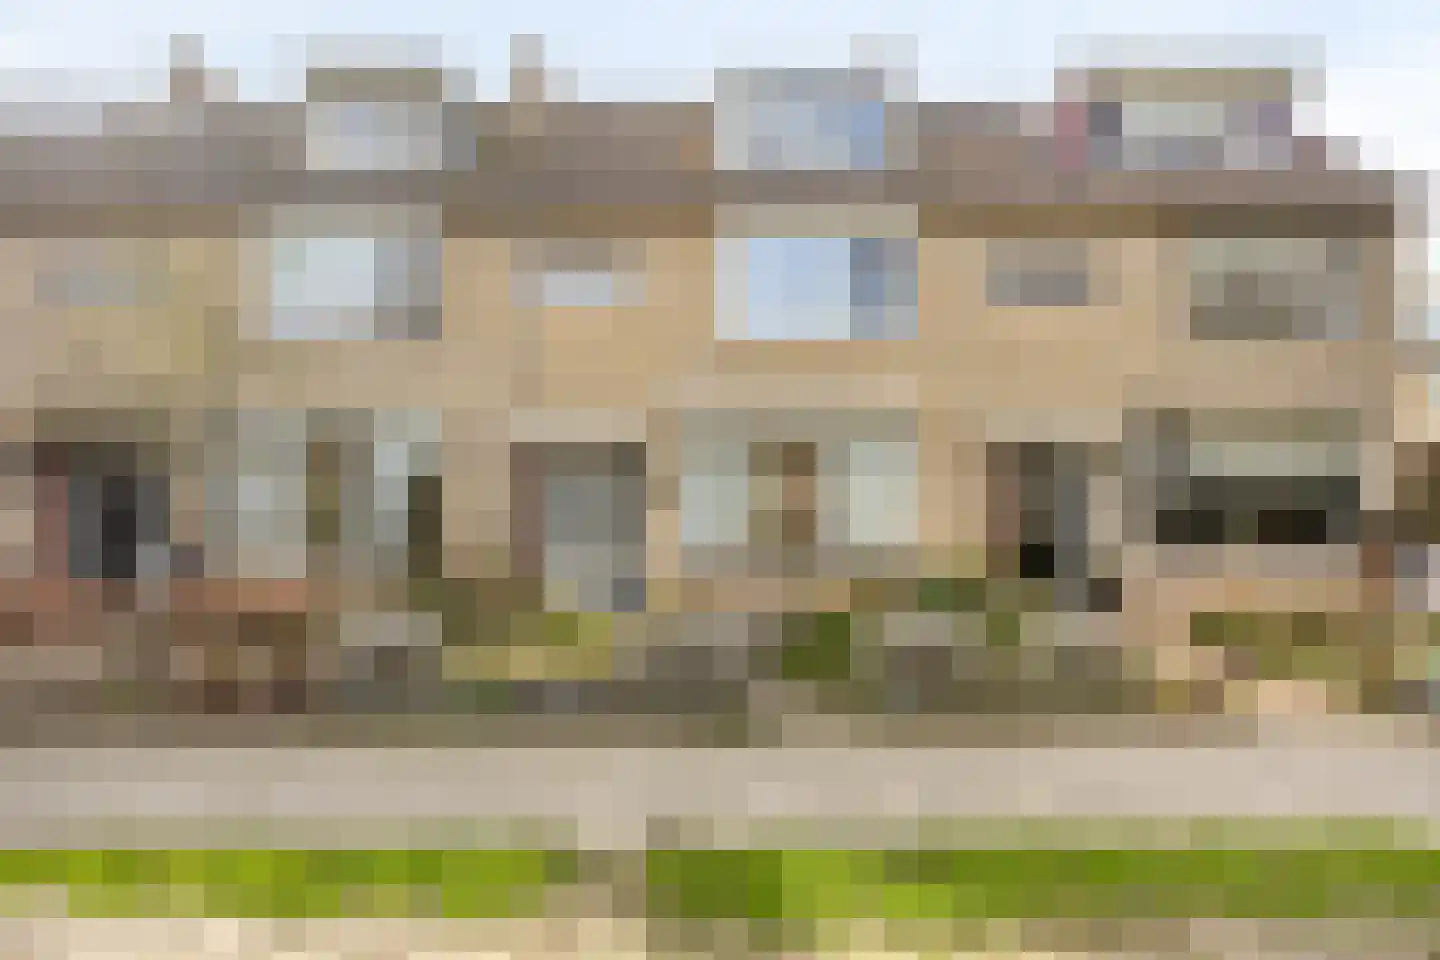
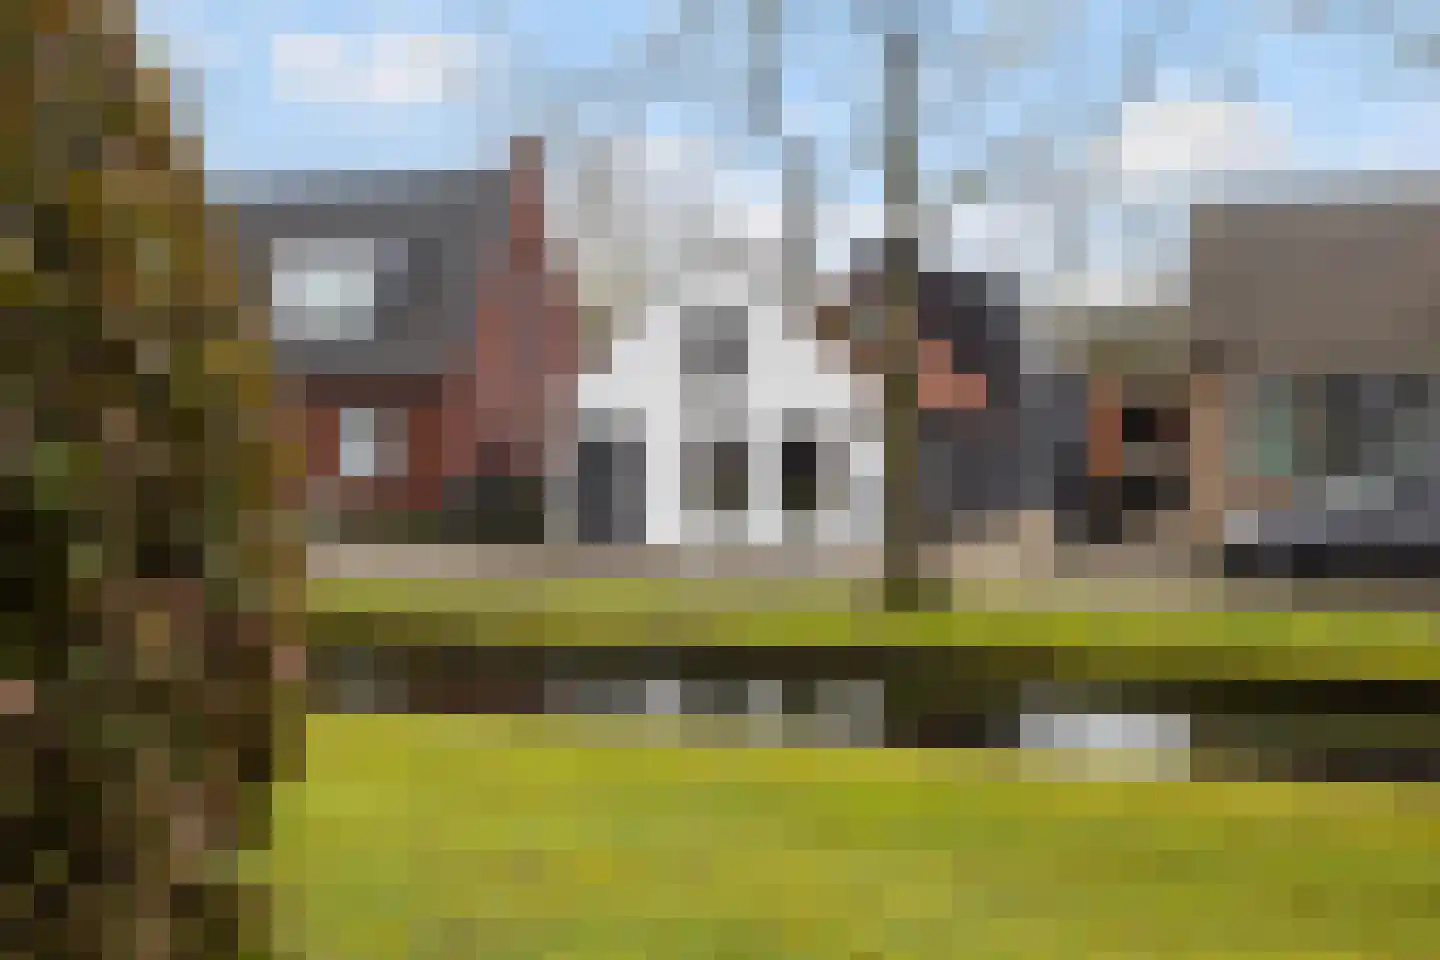
Housing offer in Nieuw-Beijerland

Found: 49 houses in Nieuw-Beijerland within your selection

Connected to: Vastgoed Nederland NVM Makelaars

View the current housing stock in Nieuw-Beijerland and quickly filter by price, living area, rooms and more. There are currently 49 houses in this place within our selection. View also 34 sold houses in Nieuw-Beijerland for extra insight into the local housing market.

Selection

Search and filter homes

Set your preferences and discover homes that suit you.

Total supply 241.061
Filters

Set price, area and other characteristics. Adjust a filter or click on Show homes. Location changes directly above.

Reset filters

You search for

  • Place Nieuw-Beijerland

Selling a home in Nieuw-Beijerland? Compare realtor offers

Get free quotes from realtors with local market knowledge in Nieuw-Beijerland.

Free request a quote

  • Quotes in Nieuw-Beijerland
  • Non-binding
  • Personal
  • Gratis tarieven vergelijken

Selling a home in Nieuw-Beijerland? Compare real estate agents who know the local housing market. Also check out all real estate agents in Nieuw-Beijerland or the top 10 real estate agents in Nieuw-Beijerland for extra context for your choice.

Save an average of €5000,-

By comparing brokers and requesting quotes

Frequently asked questions about homes in Nieuw-Beijerland

Practical answers about housing supply, sales and comparing real estate agents in Nieuw-Beijerland.

Residential and neighborhood statistics in Nieuw-Beijerland

View current location data on residents, WOZ development, housing stock, energy consumption, business activity and safety in Nieuw-Beijerland. In 2025 were there 4.480 residents. The average WOZ value in 2025 is EUR 412.000.

These figures help to better assess and compare the housing stock in Nieuw-Beijerland with recent sold homes. Orient yourself then on suitable top real estate agents in Nieuw-Beijerland for sales advice in this region.

Residents

4.480

Last year: 2025

Average WOZ

EUR 412.000

Last year: 2025

Average income per person.

EUR 35.300

Source: AllNumbers

Crimes (current year)

98

Total registered

Demographics and WOZ development

Inhabitants per year

Inhabitants per year in Nieuw-Beijerland
Year Residents
2021 4.190
2022 4.285
2023 4.410
2024 4.475
2025 4.480

Annual WOZ value

WOZ value per year in Nieuw-Beijerland
Year Average WOZ
2021 EUR 286.000
2022 EUR 320.000
2023 EUR 379.000
2024 EUR 407.000
2025 EUR 412.000

Composition of residents

Age build-up

65+: 880 0-15: 885 15-25: 625 25-45: 980 45-65: 1.110

Education level

Hoger

800

Praktisch

800

Middelbaar

1.570

Origin of residents (2025)

Europa

135

Nederland

4.090

Buiten Europa

255

Housing stock and construction periods

Types of homes

Hoekwoningen 349
Appartementen 128
Tussenwoningen 625
Vrijstaande woningen 392
Twee-onder-één-kap woningen 206

Construction period of buildings

Voor 1700 4
1700 tot 1900 21
1900 tot 1925 104
1925 tot 1950 110
1950 tot 1970 501
1970 tot 1980 206
1980 tot 1990 222
1990 tot 2000 227
2000 tot 2010 105
2010 tot 2020 114
2020 en later 132

Energy and sustainability

Energy label distribution

Label A

445

Label C

400

Label B

276

Label D

196

Label G

130

Label A++++

83

Label F

63

Label E

44

Label A+

36

Label A+++

24

Label A++

5

Label A+++++

0

Average energy consumption per year

Average energy consumption per year in Nieuw-Beijerland
Year Gas (m3) Electricity (kWh)
2020 1.270 3.150
2021 1.400 3.240
2022 1.060 3.080
2023 870 2.960
2024 820 3.080

Consumption per house type

Hoekwoning

Gas: 810 • Electricity: 2.680

Huurwoning

Gas: 730 • Electricity: 1.960

Koopwoning

Gas: 900 • Electricity: 3.190

Appartement

Gas: 660 • Electricity: 2.390

Tussenwoning

Gas: 720 • Electricity: 2.400

Vrijstaande woning

Gas: 1.230 • Electricity: 4.180

Twee-onder-één-kap woning

Gas: 910 • Electricity: 3.280

Business activity in Nieuw-Beijerland (2025)

Handel en HORECA 75
Nijverheid en energie 90
Zakelijke dienstverlening 115
Overheid, onderwijs en zorg 60
Landbouw, bosbouw en visserij 30
Vervoer, informatie en communicatie 25
Financiele diensten en onroerendgoed 40
Cultuur, recreatie en overige diensten 50

Total number of company establishments: 485

Recent crime statistics

Recent crime statistics in Nieuw-Beijerland
Period Crimes
jan 2025 10
jan 2026 6
jul 2025 8
jun 2025 8
mei 2025 12
mrt 2025 8
nov 2024 4
nov 2025 7
okt 2024 3
okt 2025 6
sep 2024 6
sep 2025 4

These figures give an indicative picture of safety trends in the living environment of Nieuw-Beijerland.

Frequently asked questions about living in Nieuw-Beijerland

Short answers based on current local statistics, handy for a quick comparison of the living environment.

Hoeveel inwoners heeft Nieuw-Beijerland?

Nieuw-Beijerland telt in 2025 ongeveer 4.480 inwoners.

Wat is de gemiddelde WOZ-waarde in Nieuw-Beijerland?

De gemiddelde WOZ-waarde in Nieuw-Beijerland is in 2025 circa € 412.000.

Wat is het gemiddelde inkomen per inwoner in Nieuw-Beijerland?

Het gemiddelde inkomen per inwoner in Nieuw-Beijerland ligt rond € 35.300 per jaar.

Hoe veilig is wonen in Nieuw-Beijerland?

Voor het huidige jaar gaat het om ongeveer 98 geregistreerde misdrijven. Gebruik deze cijfers als indicatie en vergelijk trends per periode.

Welke woningtypen komen het meest voor in Nieuw-Beijerland?

In Nieuw-Beijerland komt vooral "Tussenwoningen" veel voor, met ongeveer 625 woningen.

Gratis vrijblijvende offertes ontvangen

Vergelijk meerdere makelaars en kies de beste match.