
Residents
4.390
Last year: 2025
2441AX Nieuwveen • Zuid-Holland
For this property, no detailed description is available yet.
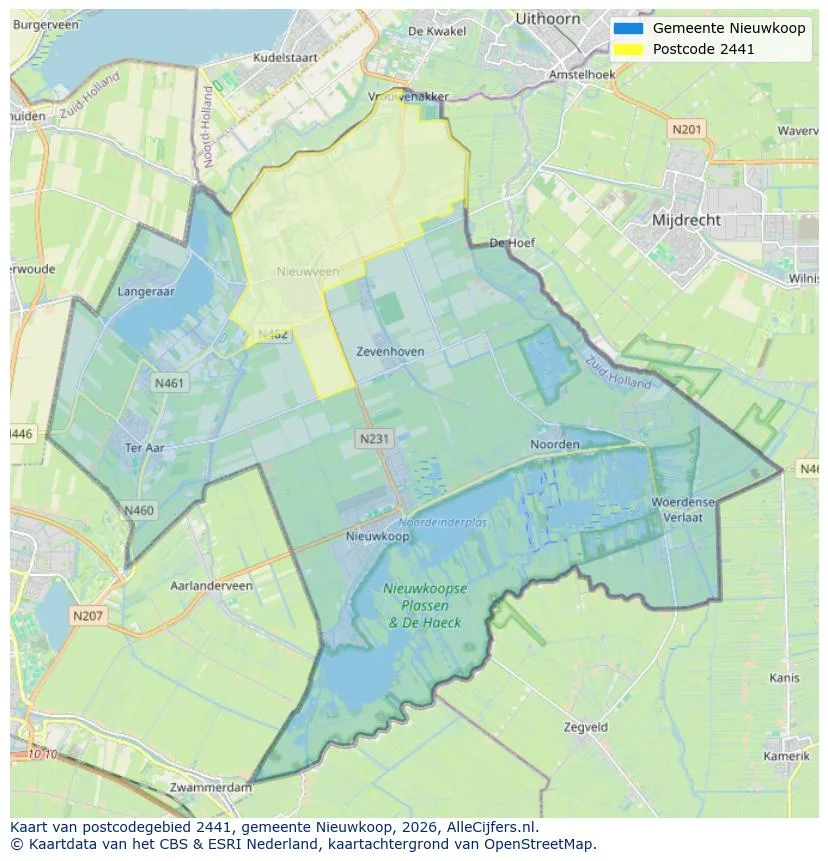
Geographic orientation and real estate agent density in Nieuwveen
View current location data on residents, WOZ development, housing stock, energy consumption, business activity and safety in Nieuwveen. In 2025 were there 4.390 residents. The average WOZ value in 2025 is EUR 481.000.
Residents
4.390
Last year: 2025
Average WOZ
EUR 481.000
Last year: 2025
Average income per person.
EUR 35.900
Source: AllNumbers
Crimes (current year)
132
Total registered
| Year | Residents |
|---|---|
| 2021 | 4.270 |
| 2022 | 4.313 |
| 2023 | 4.395 |
| 2024 | 4.380 |
| 2025 | 4.390 |
| Year | Average WOZ |
|---|---|
| 2021 | EUR 328.000 |
| 2022 | EUR 367.000 |
| 2023 | EUR 437.000 |
| 2024 | EUR 470.000 |
| 2025 | EUR 481.000 |
Hoger
780
Praktisch
980
Middelbaar
1.620
Europa
325
Nederland
3.715
Buiten Europa
350
Label C
415
Label A
393
Label B
271
Label D
182
Label G
155
Label A+++
94
Label F
91
Label E
76
Label A++
65
Label A+
55
Label A++++
15
Label A+++++
2
| Year | Gas (m3) | Electricity (kWh) |
|---|---|---|
| 2020 | 1.290 | 3.290 |
| 2021 | 1.400 | 3.370 |
| 2022 | 1.070 | 3.140 |
| 2023 | 900 | 3.030 |
| 2024 | 860 | 3.050 |
Hoekwoning
Gas: 870 • Electricity: 2.760
Huurwoning
Gas: 770 • Electricity: 2.280
Koopwoning
Gas: 950 • Electricity: 3.280
Appartement
Gas: 670 • Electricity: 1.880
Tussenwoning
Gas: 700 • Electricity: 2.650
Vrijstaande woning
Gas: 1.190 • Electricity: 4.090
Twee-onder-één-kap woning
Gas: 1.020 • Electricity: 2.950
Total number of company establishments: 640
| Period | Crimes |
|---|---|
| jan 2025 | 10 |
| jan 2026 | 6 |
| jul 2025 | 11 |
| jun 2025 | 11 |
| mei 2025 | 10 |
| mrt 2025 | 8 |
| nov 2024 | 10 |
| nov 2025 | 7 |
| okt 2024 | 4 |
| okt 2025 | 14 |
| sep 2024 | 14 |
| sep 2025 | 20 |
These figures give an indicative picture of safety trends in the living environment of Nieuwveen.
Short answers based on current local statistics, handy for a quick comparison of the living environment.
Nieuwveen telt in 2025 ongeveer 4.390 inwoners.
De gemiddelde WOZ-waarde in Nieuwveen is in 2025 circa € 481.000.
Het gemiddelde inkomen per inwoner in Nieuwveen ligt rond € 35.900 per jaar.
Voor het huidige jaar gaat het om ongeveer 132 geregistreerde misdrijven. Gebruik deze cijfers als indicatie en vergelijk trends per periode.
In Nieuwveen komt vooral "Tussenwoningen" veel voor, met ongeveer 583 woningen.
View more homes in this location.

2441CW Nieuwveen
€ 795.000 k.k.
€ 4.760/m²

2441AE Nieuwveen
€ 795.000 k.k.
€ 7.361/m²

2441KB Nieuwveen
€ 875.000 k.k.
€ 5.682/m²

2441CP Nieuwveen
€ 695.000 k.k.
€ 5.516/m²

2441CN Nieuwveen
€ 1.090.000 k.k.
€ 4.888/m²

2441HD Nieuwveen
€ 499.000 k.k.
€ 3.809/m²

2441BK Nieuwveen
€ 450.000 k.k.
€ 3.659/m²

2441HC Nieuwveen
€ 509.000 k.k.
€ 3.976/m²
