- Available
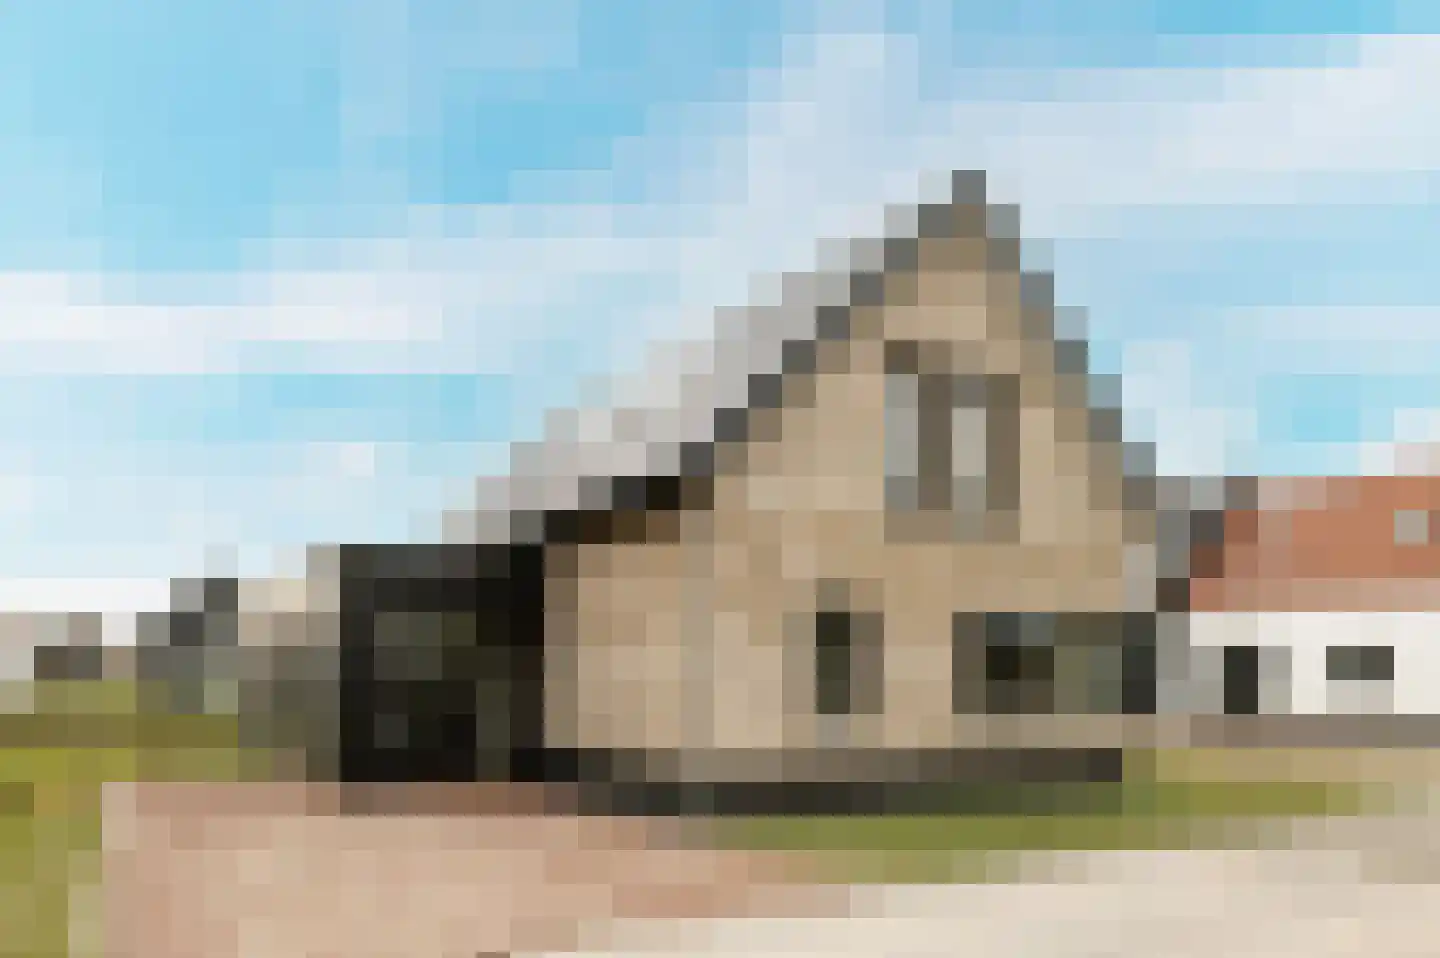
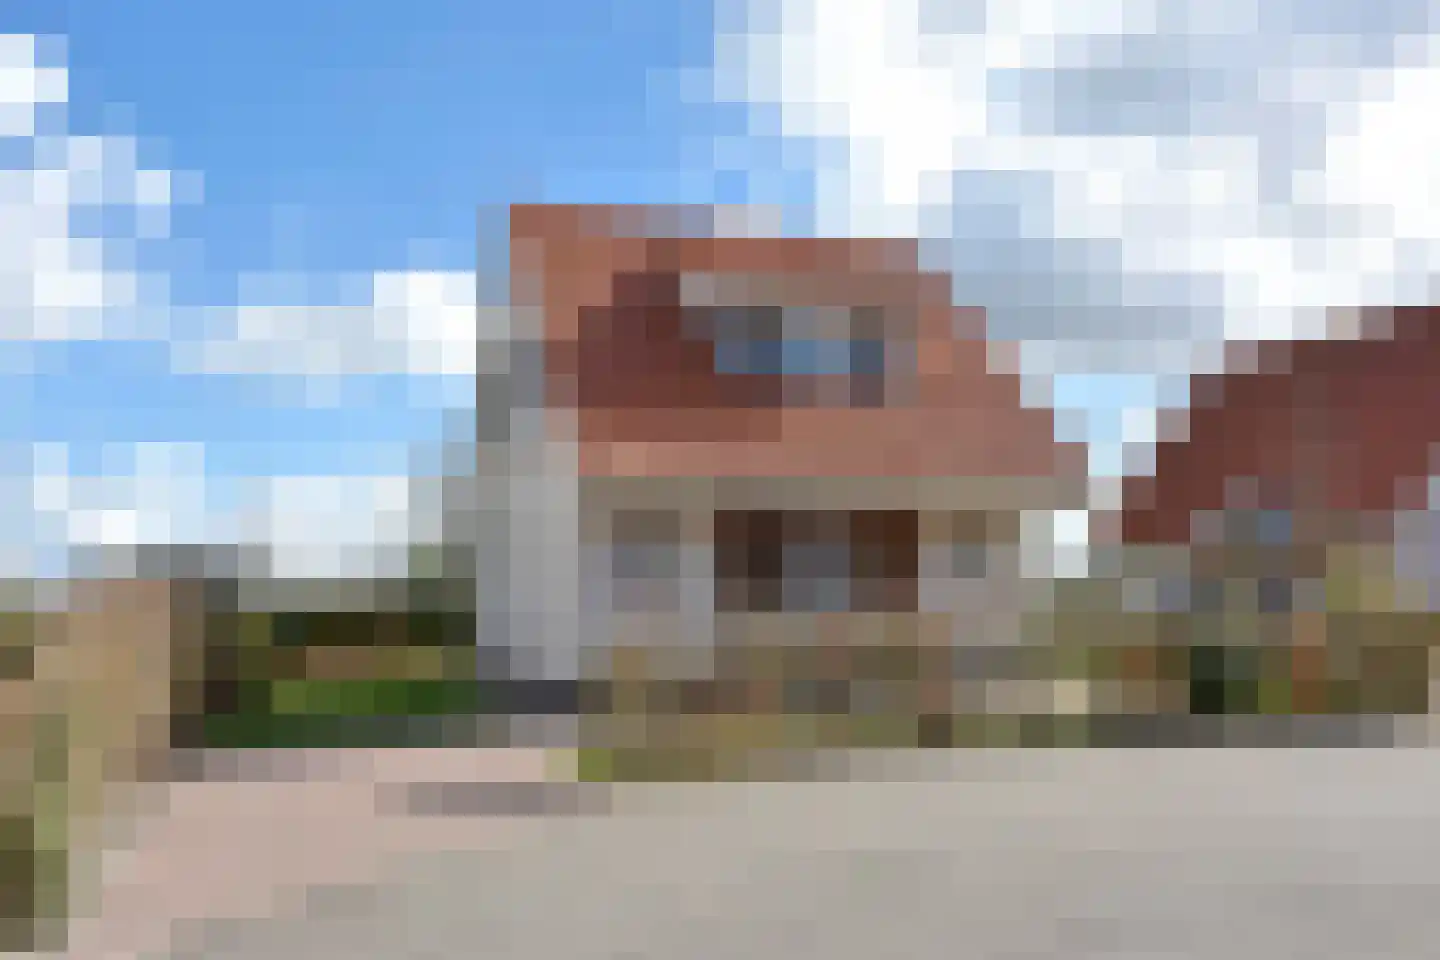
Baanstpoldersedijk 4 231
4504PR Nieuwvliet
€ 339.000 k.k.
- Living area
- 94 m²
- Land area
- 483 m²
- Bedrooms
- 3
Searching in 112 houses in Nieuwvliet
Type to search. Use arrow down and arrow up to navigate through results and press Enter to open.
Hidden search suggestions.
View current properties in Nieuwvliet or search targeted on street, postal code and property characteristics.
View the current housing stock in Nieuwvliet and quickly filter by price, living area, rooms and more. There are currently 112 houses in this place within our selection. View also 23 sold houses in Nieuwvliet for extra insight into the local housing market.
4504PR Nieuwvliet
€ 339.000 k.k.
4504PN Nieuwvliet
€ 519.000 k.k.
4504PN Nieuwvliet
€ 259.000 k.k.
4504PN Nieuwvliet
€ 595.000 k.k.
4504RW Nieuwvliet
€ 369.000 k.k.
4504RS Nieuwvliet
€ 269.000 k.k.
4504RA Nieuwvliet
€ 775.000 k.k.
4504PN Nieuwvliet
€ 340.000 k.k.
4504RA Nieuwvliet
€ 469.500 k.k.
4504PN Nieuwvliet
€ 249.000 k.k.
4504RT Nieuwvliet
€ 249.000 k.k.
4504PB Nieuwvliet
€ 449.000 k.k.
4504RA Nieuwvliet
€ 610.000 k.k.
4504SH Nieuwvliet
€ 498.000 k.k.
€ 3.773/m²
4504RX Nieuwvliet
€ 349.000 k.k.
4504RX Nieuwvliet
€ 349.000 k.k.
4504RT Nieuwvliet
€ 249.000 k.k.
4504AN Nieuwvliet
€ 475.000 k.k.
€ 1.963/m²
4504SH Nieuwvliet
€ 739.500 k.k.
€ 4.802/m²
4504PN Nieuwvliet
€ 325.000 k.k.
4504PN Nieuwvliet
€ 309.000 k.k.
4504AP Nieuwvliet
€ 665.000 k.k.
€ 4.784/m²
4504PN Nieuwvliet
€ 204.000 k.k.
4504RP Nieuwvliet
€ 449.000 k.k.
€ 4.677/m²
4504RP Nieuwvliet
€ 425.000 k.k.
€ 4.670/m²
4504PN Nieuwvliet
€ 395.000 k.k.
€ 4.702/m²
4504PN Nieuwvliet
€ 349.000 k.k.
€ 4.915/m²
4504RD Nieuwvliet
€ 359.000 k.k.
€ 3.701/m²
Get free quotes from real estate agents with local market knowledge. Compare more than 16 real estate agents in Nieuwvliet.
Selling a home in Nieuwvliet? Compare all real estate agents in Nieuwvliet or view the top 10 real estate agents in Nieuwvliet for extra context for your choice.
Real estate agents make sharper offers when they know you're comparing — ask for quotes for sale or purchase.
Practical answers about housing supply, sales and comparing real estate agents in Nieuwvliet.
The costs of a real estate agent in Nieuwvliet depend on commission, setup costs, property presentation and the chosen service. Compare the 16 real estate agents in Nieuwvliet via the real estate agent page and request multiple quotes to compare rates and approach well.
Within our selection, we are currently showing 112 houses in Nieuwvliet. View also the sold houses in Nieuwvliet to compare the current offering with recent transactions.
Take into account not only price and living area but also maintenance, energy label, location, outdoor space and sales status. This way you compare houses in Nieuwvliet on more than just the asking price.
A local real estate agent knows the neighborhoods, recent transactions and demand in Nieuwvliet. By comparing 16 real estate agents in the region you get a better insight into prices, sales strategy and expected yield; the top 10 in Nieuwvliet provides a useful starting point.
Yes, when making a sales plan, a valuation in Nieuwvliet is wise. You gain insight into a realistic asking price and can then compare offers from real estate agents specifically.
View current location data on residents, WOZ development, housing stock, energy consumption, business activity and safety in Nieuwvliet. In 2025 were there 395 residents. The average WOZ value in 2025 is EUR 368.000.
These figures help to better assess and compare the housing stock in Nieuwvliet with recent sold homes. Orient yourself then on suitable top real estate agents in Nieuwvliet for sales advice in this region.
Residents
395
Last year: 2025
Average WOZ
EUR 368.000
Last year: 2025
Average income per person.
EUR 32.000
Source: AllNumbers
Crimes (current year)
22
Total registered
| Year | Residents |
|---|---|
| 2021 | 395 |
| 2022 | 405 |
| 2023 | 405 |
| 2024 | 395 |
| 2025 | 395 |
| Year | Average WOZ |
|---|---|
| 2021 | EUR 264.000 |
| 2022 | EUR 299.000 |
| 2023 | EUR 330.000 |
| 2024 | EUR 356.000 |
| 2025 | EUR 368.000 |
Hoger
60
Praktisch
160
Middelbaar
90
Europa
125
Nederland
250
Buiten Europa
15
Label A
590
Label C
465
Label B
364
Label G
125
Label A+
125
Label D
109
Label F
50
Label A+++
45
Label E
24
Label A++++
22
Label A++
4
Label A+++++
0
| Year | Gas (m3) | Electricity (kWh) |
|---|---|---|
| 2020 | 1.280 | 2.330 |
| 2021 | 1.530 | 2.520 |
| 2022 | 1.160 | 2.380 |
| 2023 | 1.010 | 2.120 |
| 2024 | 950 | 2.180 |
Hoekwoning
Gas: 870 • Electricity: 1.620
Huurwoning
Gas: 1.060 • Electricity: 1.970
Koopwoning
Gas: 1.010 • Electricity: 2.290
Appartement
Gas: 1.480 • Electricity: 2.800
Tussenwoning
Gas: 830 • Electricity: 1.370
Vrijstaande woning
Gas: 1.070 • Electricity: 2.420
Twee-onder-één-kap woning
Gas: 850 • Electricity: 1.340
Total number of company establishments: 115
| Period | Crimes |
|---|---|
| jan 2026 | 0 |
| jul 2025 | 3 |
| jun 2025 | 1 |
| mei 2025 | 4 |
| mrt 2025 | 0 |
| mrt 2026 | 1 |
| nov 2024 | 2 |
| nov 2025 | 1 |
| okt 2024 | 6 |
| okt 2025 | 1 |
| sep 2024 | 0 |
| sep 2025 | 3 |
These figures give an indicative picture of safety trends in the living environment of Nieuwvliet.
Short answers based on current local statistics, handy for a quick comparison of the living environment.
Nieuwvliet telt in 2025 ongeveer 395 inwoners.
De gemiddelde WOZ-waarde in Nieuwvliet is in 2025 circa € 368.000.
Het gemiddelde inkomen per inwoner in Nieuwvliet ligt rond € 32.000 per jaar.
Voor het huidige jaar gaat het om ongeveer 22 geregistreerde misdrijven. Gebruik deze cijfers als indicatie en vergelijk trends per periode.
In Nieuwvliet komt vooral "Vrijstaande woningen" veel voor, met ongeveer 223 woningen.