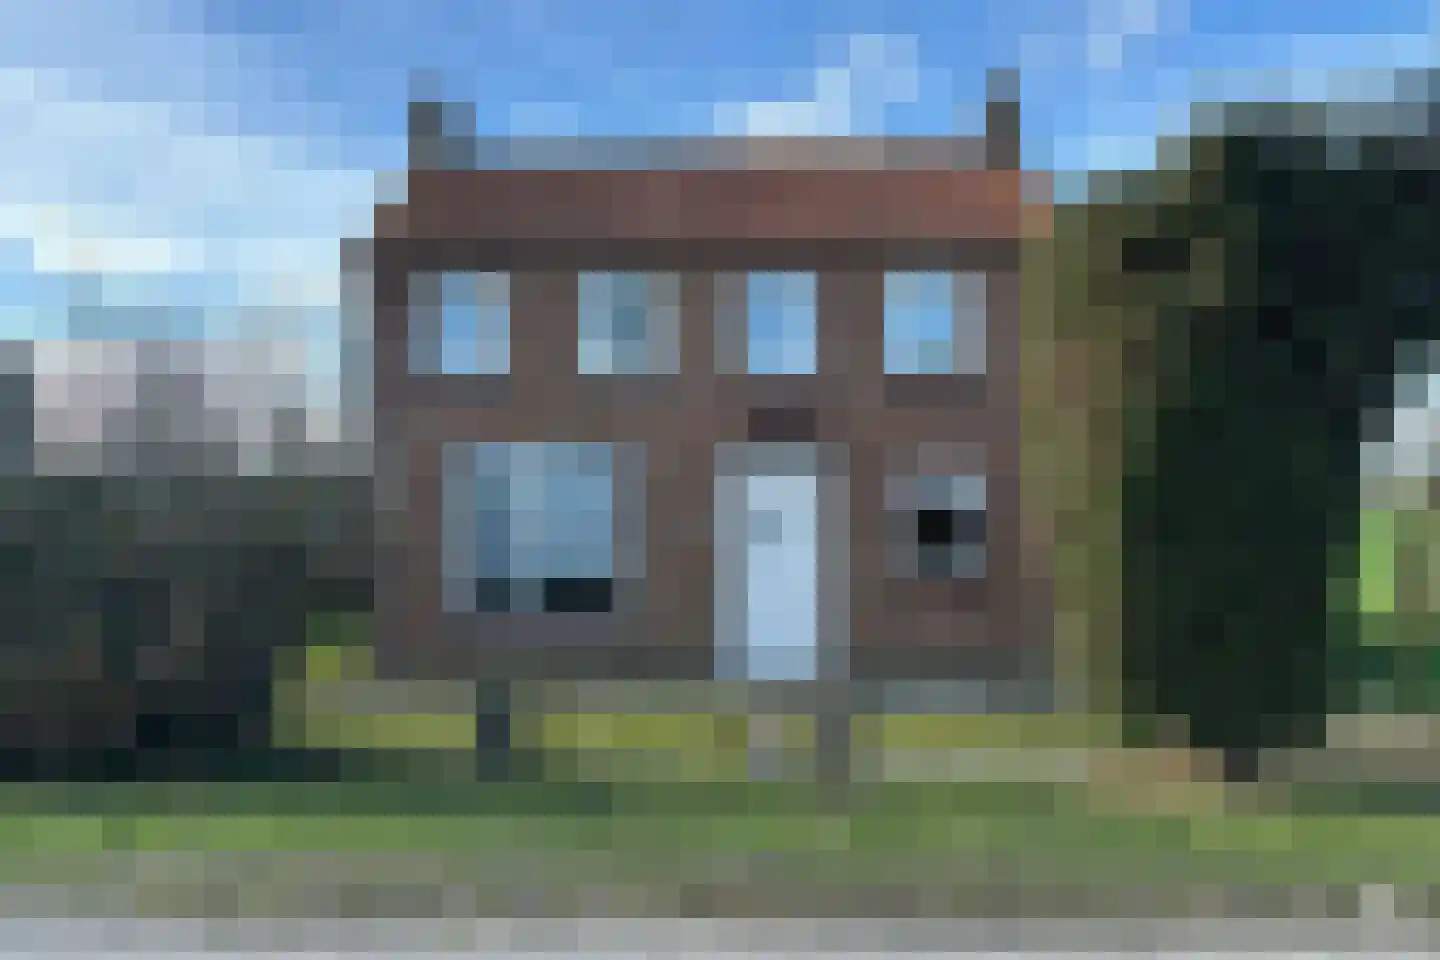
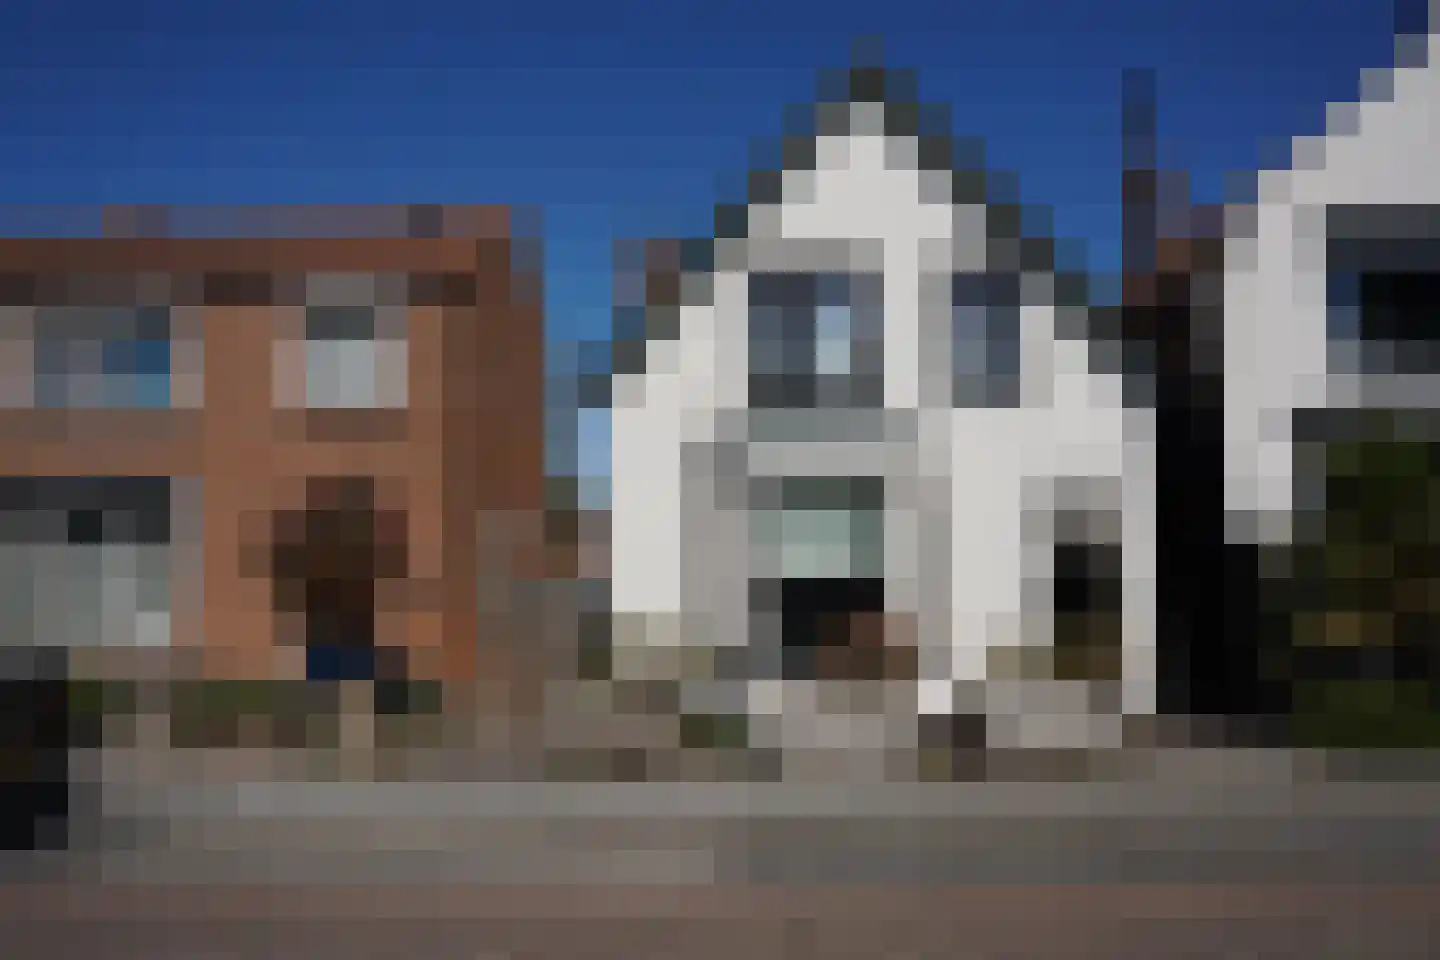
- Sold
Schorrebloem 41
4504RL Nieuwvliet
€ 212.500 k.k.
€ 3.863/m²
- Living area
- 55 m²
- Land area
- —
- Bedrooms
- 3
View 25 sold houses in Nieuwvliet
Type to search. Use arrow down and arrow up to navigate through results and press Enter to open.
Hidden search suggestions.
Compare sold homes in Nieuwvliet or view the current offering in this location directly.
On this page you will find recently sold homes in Nieuwvliet. Use this overview to better estimate selling prices, popular neighborhoods, and the local housing supply before you choose a real estate agent. Also view the current housing supply with 114 houses in Nieuwvliet.
4504RL Nieuwvliet
€ 212.500 k.k.
€ 3.863/m²
4504PN Nieuwvliet
€ 425.000 k.k.
€ 4.569/m²
4504AA Nieuwvliet
€ 239.000 k.k.
€ 1.625/m²
4504RM Nieuwvliet
€ 235.000 k.k.
€ 3.309/m²
4504PN Nieuwvliet
€ 375.000 k.k.
€ 4.573/m²
4504PG Nieuwvliet
€ 365.000 k.k.
€ 5.289/m²
4504AL Nieuwvliet
€ 285.000 k.k.
€ 3.392/m²
4504PH Nieuwvliet
€ 290.000 k.k.
€ 3.866/m²
4504AR Nieuwvliet
€ 285.000 k.k.
€ 4.830/m²
4504SC Nieuwvliet
€ 350.000 k.k.
€ 3.888/m²
4504PN Nieuwvliet
€ 325.000 k.k.
€ 0/m²
4504SC Nieuwvliet
€ 285.000 k.k.
€ 3.239/m²
4504AR Nieuwvliet
€ 450.000 k.k.
€ 0/m²
4504PN Nieuwvliet
€ 225.000 k.k.
€ 0/m²
4504PR Nieuwvliet
€ 299.000 k.k.
€ 3.215/m²
4504PN Nieuwvliet
€ 349.000 k.k.
€ 6.017/m²
4504AB Nieuwvliet
€ 409.000 k.k.
€ 1.850/m²
4504RR Nieuwvliet
€ 379.000 k.k.
€ 5.191/m²
4504RC Nieuwvliet
€ 365.000 k.k.
€ 3.762/m²
4504PN Nieuwvliet
€ 395.000 k.k.
€ 4.885/m²
4504PR Nieuwvliet
€ 375.000 k.k.
€ 3.989/m²
4504PN Nieuwvliet
€ 350.000 k.k.
€ 4.022/m²
4504PN Nieuwvliet
€ 195.000 k.k.
€ 3.823/m²
4504AN Nieuwvliet
€ 349.000 k.k.
€ 1.994/m²
4504PG Nieuwvliet
€ 425.000 k.k.
€ 4.829/m²
Get free quotes from realtors with local market knowledge in Nieuwvliet.
Selling a home in Nieuwvliet? Compare real estate agents who know the local housing market. Also check out all real estate agents in Nieuwvliet or the top 10 real estate agents in Nieuwvliet for extra context for your choice.
By comparing brokers and requesting quotes
Short answers about housing prices, sold homes and comparing real estate agents in Nieuwvliet.
The costs of a real estate agent in Nieuwvliet vary per office, property type and sales approach. Therefore, compare multiple quotes and also look at the real estate agents in Nieuwvliet to better compare rates, presentation and local experience.
On this page we currently show 25 sold houses in Nieuwvliet from our selection. This helps you to better assess recent transactions and the local housing market.
Houses sold in Nieuwvliet give insight into asking prices, house types and neighborhoods where recent transactions have taken place. Compare this also with the current housing stock in Nieuwvliet to better understand the market.
You can use sold homes as a first market indication, but a local real estate agent can better take into account finishing, location, maintenance and current demand in Nieuwvliet.
Compare realtors in Nieuwvliet on local sales experience, reviews, expected yield, commission and marketing approach. The top 10 realtors in Nieuwvliet helps to quickly discover strong offices.
View current location data on residents, WOZ development, housing stock, energy consumption, business activity and safety in Nieuwvliet. In 2025 were there 395 residents. The average WOZ value in 2025 is EUR 368.000.
These figures help to better assess and compare the housing stock in Nieuwvliet with recent sold homes. Orient yourself then on suitable top real estate agents in Nieuwvliet for sales advice in this region.
Residents
395
Last year: 2025
Average WOZ
EUR 368.000
Last year: 2025
Average income per person.
EUR 32.000
Source: AllNumbers
Crimes (current year)
22
Total registered
| Year | Residents |
|---|---|
| 2021 | 395 |
| 2022 | 405 |
| 2023 | 405 |
| 2024 | 395 |
| 2025 | 395 |
| Year | Average WOZ |
|---|---|
| 2021 | EUR 264.000 |
| 2022 | EUR 299.000 |
| 2023 | EUR 330.000 |
| 2024 | EUR 356.000 |
| 2025 | EUR 368.000 |
Hoger
60
Praktisch
160
Middelbaar
90
Europa
125
Nederland
250
Buiten Europa
15
Label A
590
Label C
465
Label B
364
Label G
125
Label A+
125
Label D
109
Label F
50
Label A+++
45
Label E
24
Label A++++
22
Label A++
4
Label A+++++
0
| Year | Gas (m3) | Electricity (kWh) |
|---|---|---|
| 2020 | 1.280 | 2.330 |
| 2021 | 1.530 | 2.520 |
| 2022 | 1.160 | 2.380 |
| 2023 | 1.010 | 2.120 |
| 2024 | 950 | 2.180 |
Hoekwoning
Gas: 870 • Electricity: 1.620
Huurwoning
Gas: 1.060 • Electricity: 1.970
Koopwoning
Gas: 1.010 • Electricity: 2.290
Appartement
Gas: 1.480 • Electricity: 2.800
Tussenwoning
Gas: 830 • Electricity: 1.370
Vrijstaande woning
Gas: 1.070 • Electricity: 2.420
Twee-onder-één-kap woning
Gas: 850 • Electricity: 1.340
Total number of company establishments: 115
| Period | Crimes |
|---|---|
| jan 2026 | 0 |
| jul 2025 | 3 |
| jun 2025 | 1 |
| mei 2025 | 4 |
| mrt 2025 | 0 |
| mrt 2026 | 1 |
| nov 2024 | 2 |
| nov 2025 | 1 |
| okt 2024 | 6 |
| okt 2025 | 1 |
| sep 2024 | 0 |
| sep 2025 | 3 |
These figures give an indicative picture of safety trends in the living environment of Nieuwvliet.
Short answers based on current local statistics, handy for a quick comparison of the living environment.
Nieuwvliet telt in 2025 ongeveer 395 inwoners.
De gemiddelde WOZ-waarde in Nieuwvliet is in 2025 circa € 368.000.
Het gemiddelde inkomen per inwoner in Nieuwvliet ligt rond € 32.000 per jaar.
Voor het huidige jaar gaat het om ongeveer 22 geregistreerde misdrijven. Gebruik deze cijfers als indicatie en vergelijk trends per periode.
In Nieuwvliet komt vooral "Vrijstaande woningen" veel voor, met ongeveer 223 woningen.