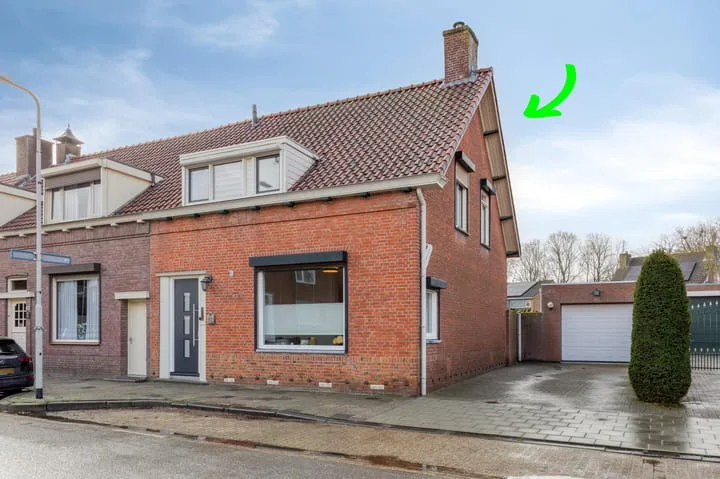
Houses sold in Nispen

View 12 sold houses in Nispen

Connected to: Vastgoed Nederland NVM Makelaars

On this page you will find recently sold homes in Nispen. Use this overview to better estimate selling prices, popular neighborhoods, and the local housing supply before you choose a real estate agent. Also view the current housing supply with 17 houses in Nispen.

Selection

Search and filter homes

Set your preferences and discover homes that suit you.

Total supply 241.451
Filters

Set price, area and other characteristics. Adjust a filter or click on Show homes. Location changes directly above.

Reset filters

You search for

  • Place Nispen
  • Status Sold

Huis verkopen in Nispen? Vergelijk verkoopmakelaars

Bekijk recente verkopen en ontvang gratis offertes van lokale verkoopmakelaars in Nispen.

Free request a quote

  • Quotes in Nispen
  • Non-binding
  • Personal
  • Gratis tarieven vergelijken

Zelf je woning verkopen in Nispen? Vergelijk verkoopmakelaars in Nispen of bekijk de beste verkoopmakelaars in Nispen als referentie bij jouw keuze.

Vergelijk meerdere offertes

Makelaars maken scherpere voorstellen als ze weten dat je vergelijkt — vraag offertes aan voor verkoop of aankoop.

Frequently asked questions about sold homes in Nispen

Short answers about housing prices, sold homes and comparing real estate agents in Nispen.

Residential and neighborhood statistics in Nispen

View current location data on residents, WOZ development, housing stock, energy consumption, business activity and safety in Nispen. In 2025 were there 1.800 residents. The average WOZ value in 2025 is EUR 453.000.

These figures help to better assess and compare the housing stock in Nispen with recent sold homes. Orient yourself then on suitable top real estate agents in Nispen for sales advice in this region.

Residents

1.800

Last year: 2025

Average WOZ

EUR 453.000

Last year: 2025

Average income per person.

EUR 31.200

Source: AllNumbers

Crimes (current year)

54

Total registered

Demographics and WOZ development

Inhabitants per year

Inhabitants per year in Nispen
Year Residents
2021 1.740
2022 1.725
2023 1.745
2024 1.810
2025 1.800

Annual WOZ value

WOZ value per year in Nispen
Year Average WOZ
2021 EUR 349.000
2022 EUR 366.000
2023 EUR 407.000
2024 EUR 425.000
2025 EUR 453.000

Composition of residents

Age build-up

65+: 405 0-15: 225 15-25: 235 25-45: 405 45-65: 525

Education level

Hoger

330

Praktisch

330

Middelbaar

700

Origin of residents (2025)

Europa

430

Nederland

1.305

Buiten Europa

65

Housing stock and construction periods

Types of homes

Hoekwoningen 85
Appartementen 25
Tussenwoningen 95
Vrijstaande woningen 370
Twee-onder-één-kap woningen 136

Construction period of buildings

Voor 1700 0
1700 tot 1900 22
1900 tot 1925 56
1925 tot 1950 96
1950 tot 1970 188
1970 tot 1980 103
1980 tot 1990 79
1990 tot 2000 65
2000 tot 2010 85
2010 tot 2020 47
2020 en later 10

Energy and sustainability

Energy label distribution

Label C

161

Label A

117

Label G

102

Label B

87

Label D

86

Label F

76

Label E

44

Label A+

7

Label A+++

4

Label A++

2

Label A++++

1

Label A+++++

0

Average energy consumption per year

Average energy consumption per year in Nispen
Year Gas (m3) Electricity (kWh)
2020 1.570 3.510
2021 1.790 3.600
2022 1.350 3.360
2023 1.110 3.260
2024 1.080 3.300

Consumption per house type

Hoekwoning

Gas: 910 • Electricity: 2.320

Huurwoning

Gas: 930 • Electricity: 2.200

Koopwoning

Gas: 1.150 • Electricity: 3.520

Appartement

Gas: 720 • Electricity: 1.910

Tussenwoning

Gas: 790 • Electricity: 2.350

Vrijstaande woning

Gas: 1.240 • Electricity: 3.850

Twee-onder-één-kap woning

Gas: 1.140 • Electricity: 3.010

Business activity in Nispen (2025)

Handel en HORECA 45
Nijverheid en energie 45
Zakelijke dienstverlening 50
Overheid, onderwijs en zorg 35
Landbouw, bosbouw en visserij 45
Vervoer, informatie en communicatie 15
Financiele diensten en onroerendgoed 0
Cultuur, recreatie en overige diensten 30

Total number of company establishments: 260

Recent crime statistics

Recent crime statistics in Nispen
Period Crimes
jan 2026 3
jul 2025 5
jun 2025 8
mei 2025 6
mrt 2025 2
mrt 2026 6
nov 2024 3
nov 2025 3
okt 2024 1
okt 2025 2
sep 2024 5
sep 2025 5

These figures give an indicative picture of safety trends in the living environment of Nispen.

Frequently asked questions about living in Nispen

Short answers based on current local statistics, handy for a quick comparison of the living environment.

Hoeveel inwoners heeft Nispen?

Nispen telt in 2025 ongeveer 1.800 inwoners.

Wat is de gemiddelde WOZ-waarde in Nispen?

De gemiddelde WOZ-waarde in Nispen is in 2025 circa € 453.000.

Wat is het gemiddelde inkomen per inwoner in Nispen?

Het gemiddelde inkomen per inwoner in Nispen ligt rond € 31.200 per jaar.

Hoe veilig is wonen in Nispen?

Voor het huidige jaar gaat het om ongeveer 54 geregistreerde misdrijven. Gebruik deze cijfers als indicatie en vergelijk trends per periode.

Welke woningtypen komen het meest voor in Nispen?

In Nispen komt vooral "Vrijstaande woningen" veel voor, met ongeveer 370 woningen.

Gratis vrijblijvende offertes ontvangen

Vergelijk meerdere makelaars en kies de beste match.