- Available
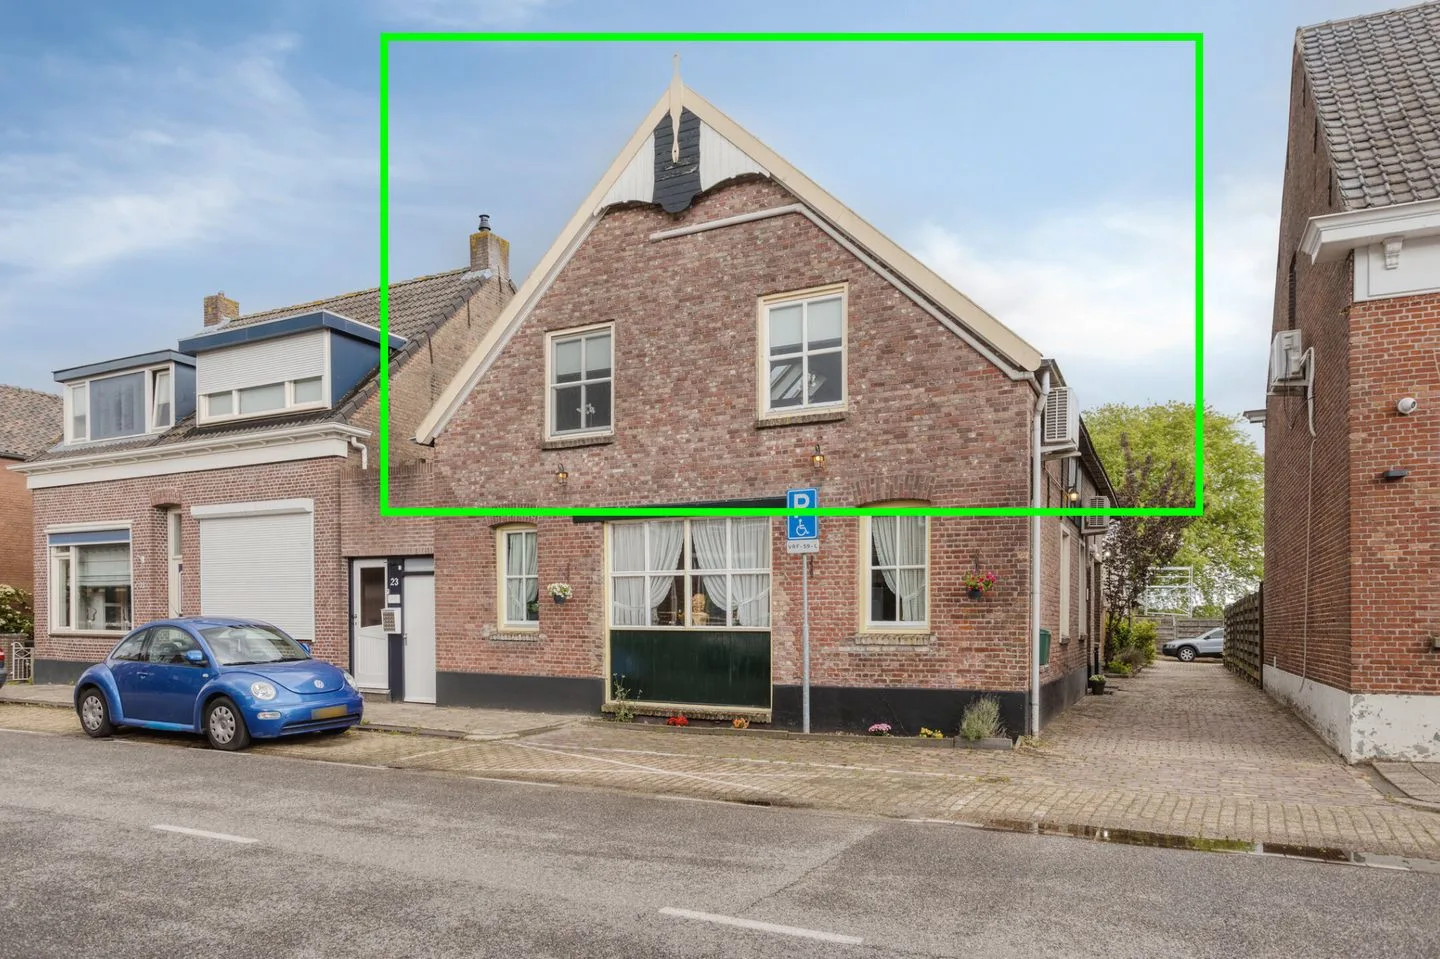
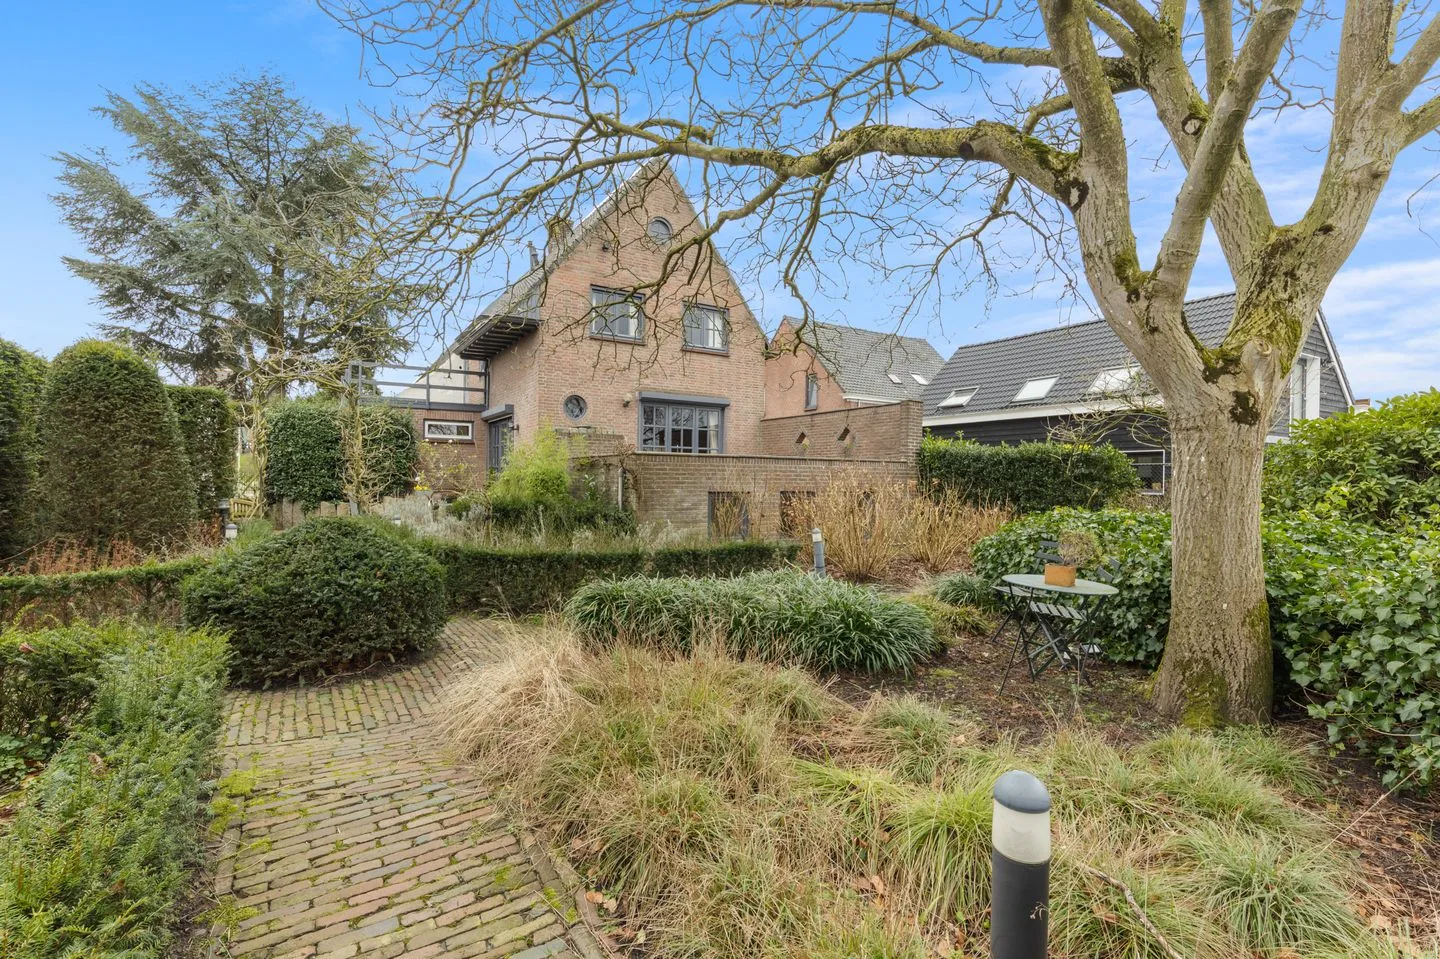
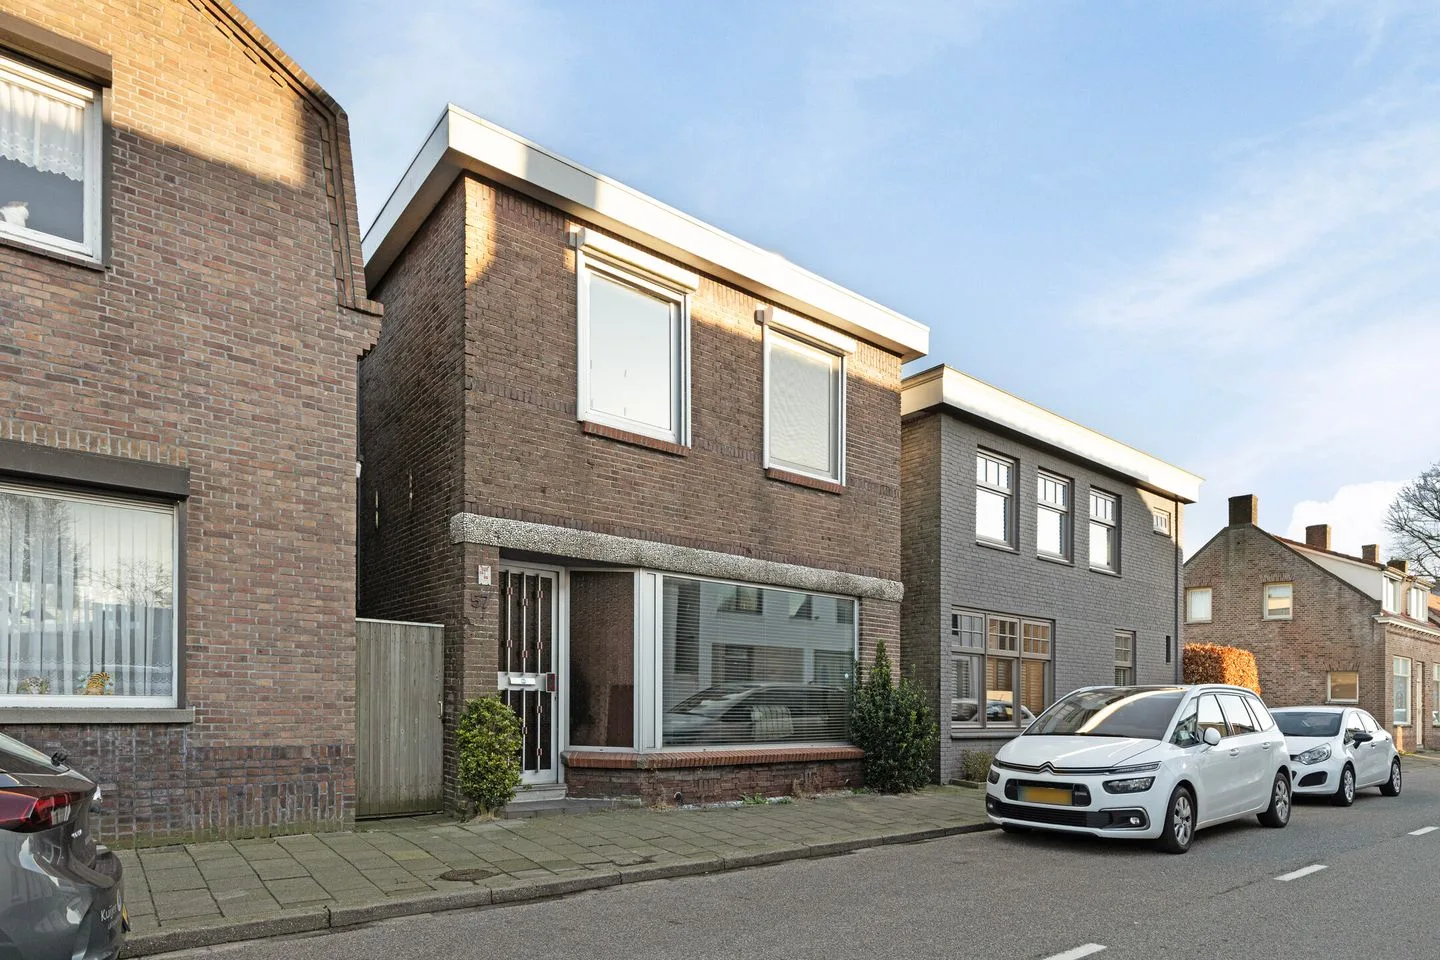
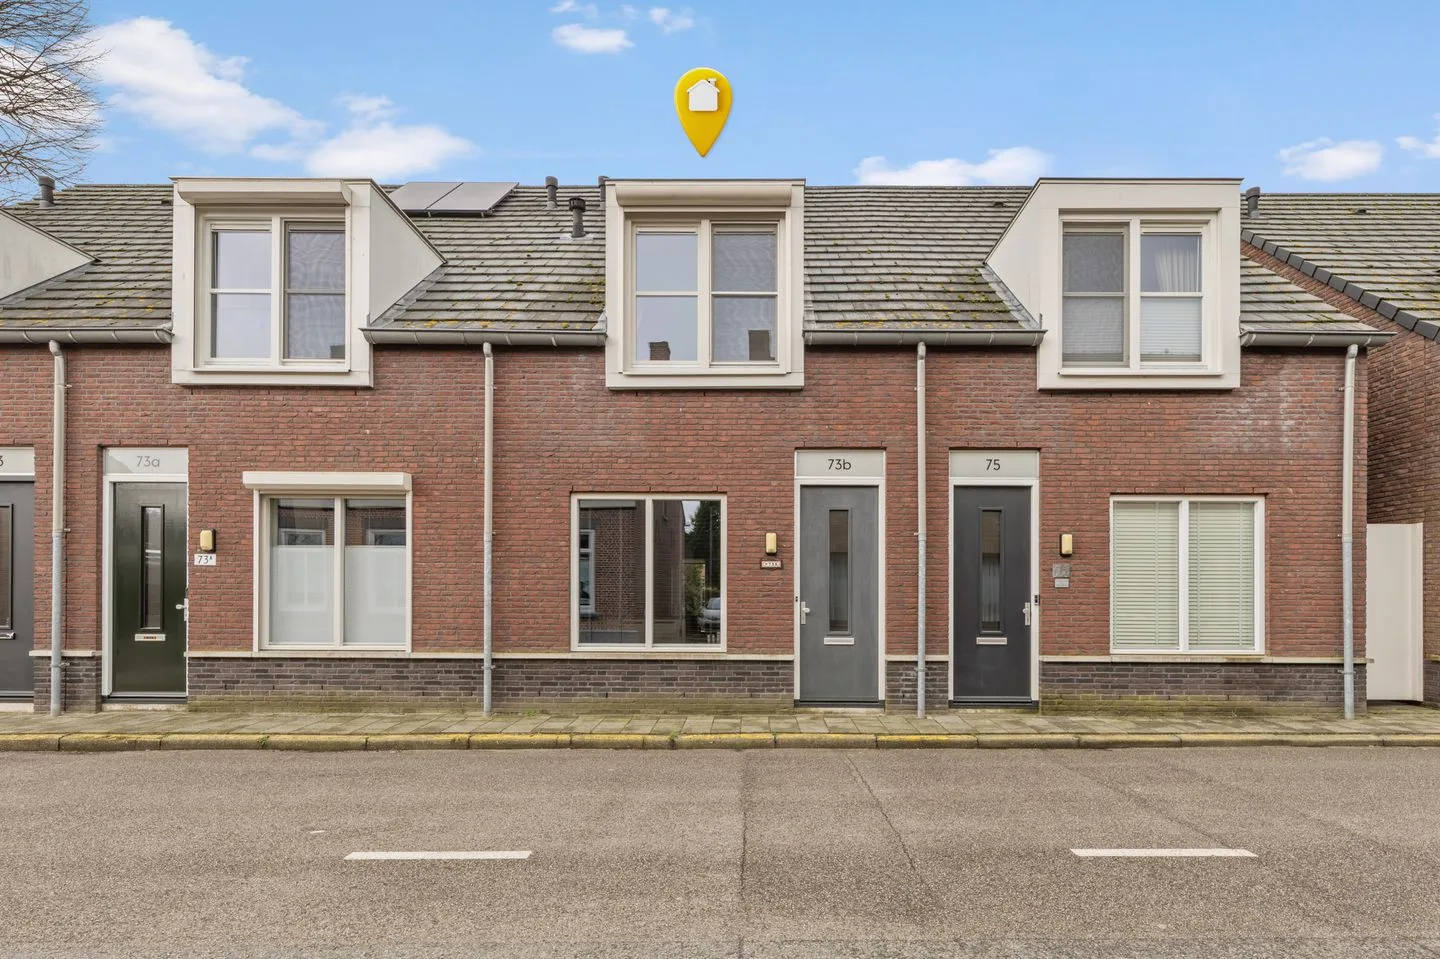
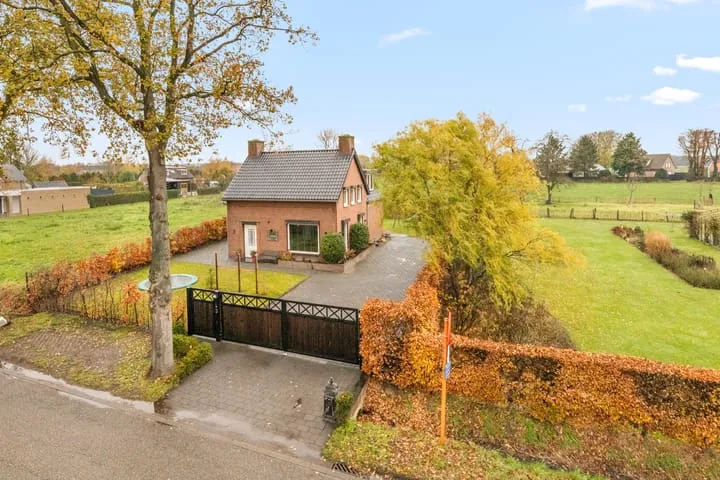
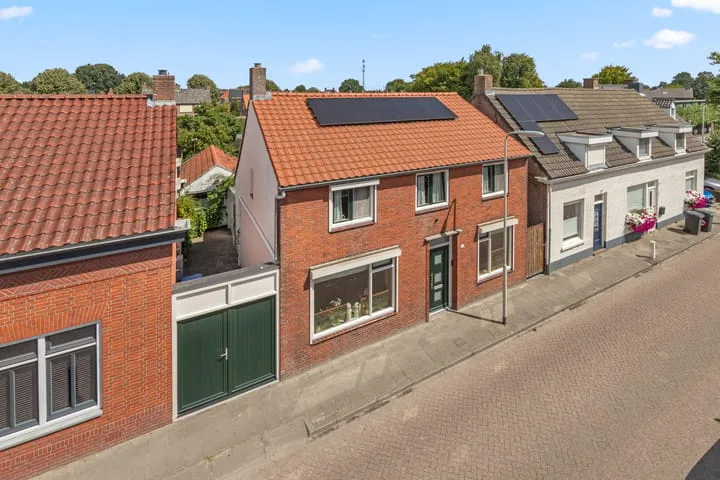
Grensstraat 10
4709PG Nispen
€ 610.000 k.k.
€ 3.389/m²
A+++++
Save as favorite
- Living area
- 180 m²
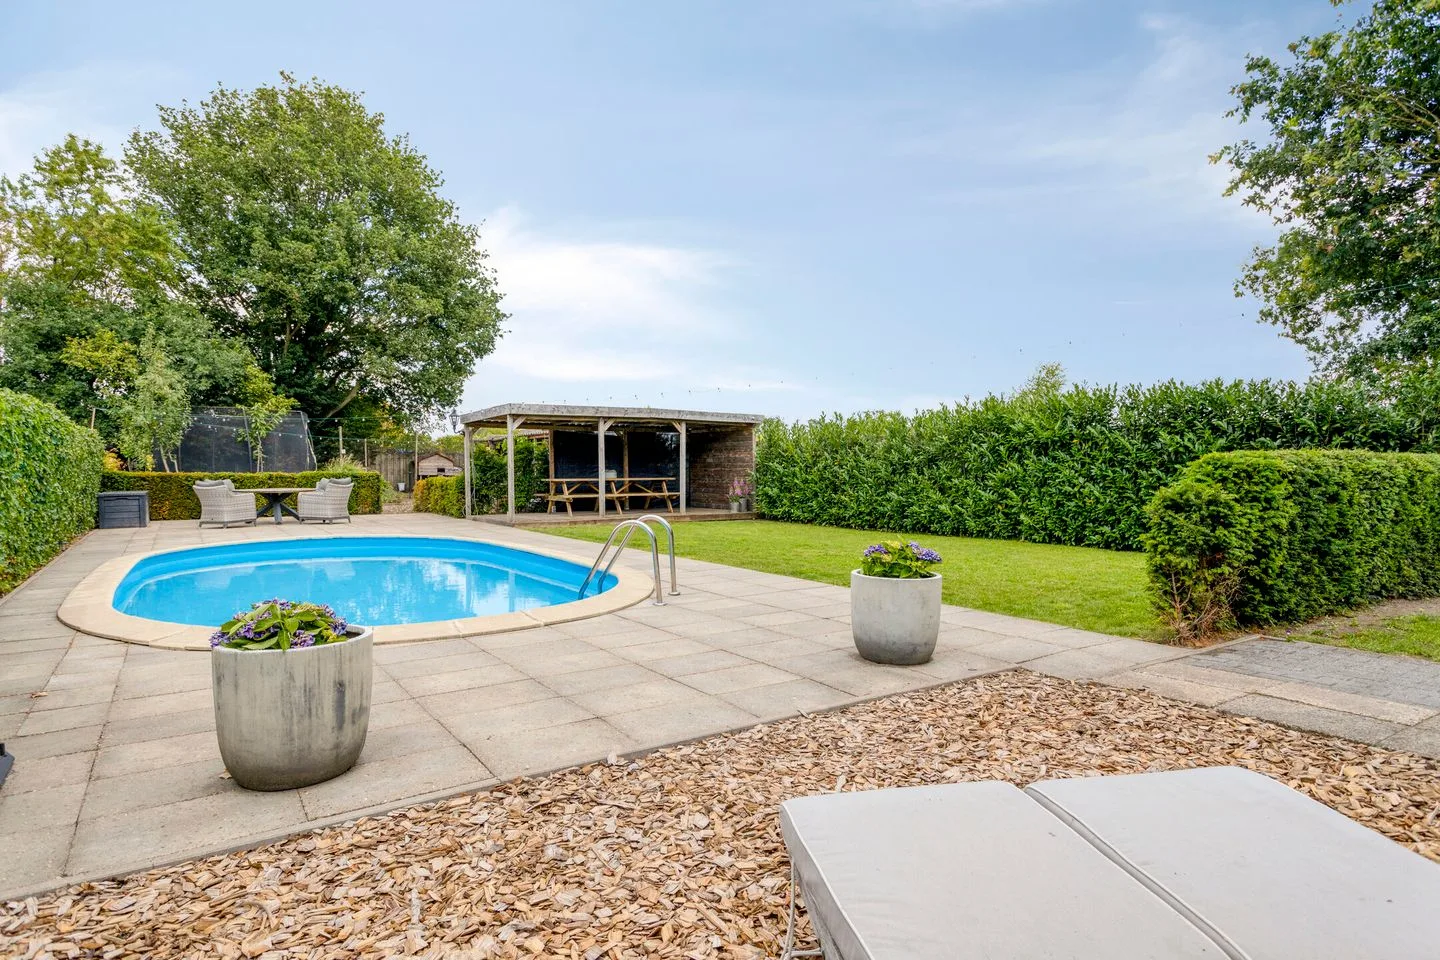
- Land area
- 577 m²
- Bedrooms
- 3