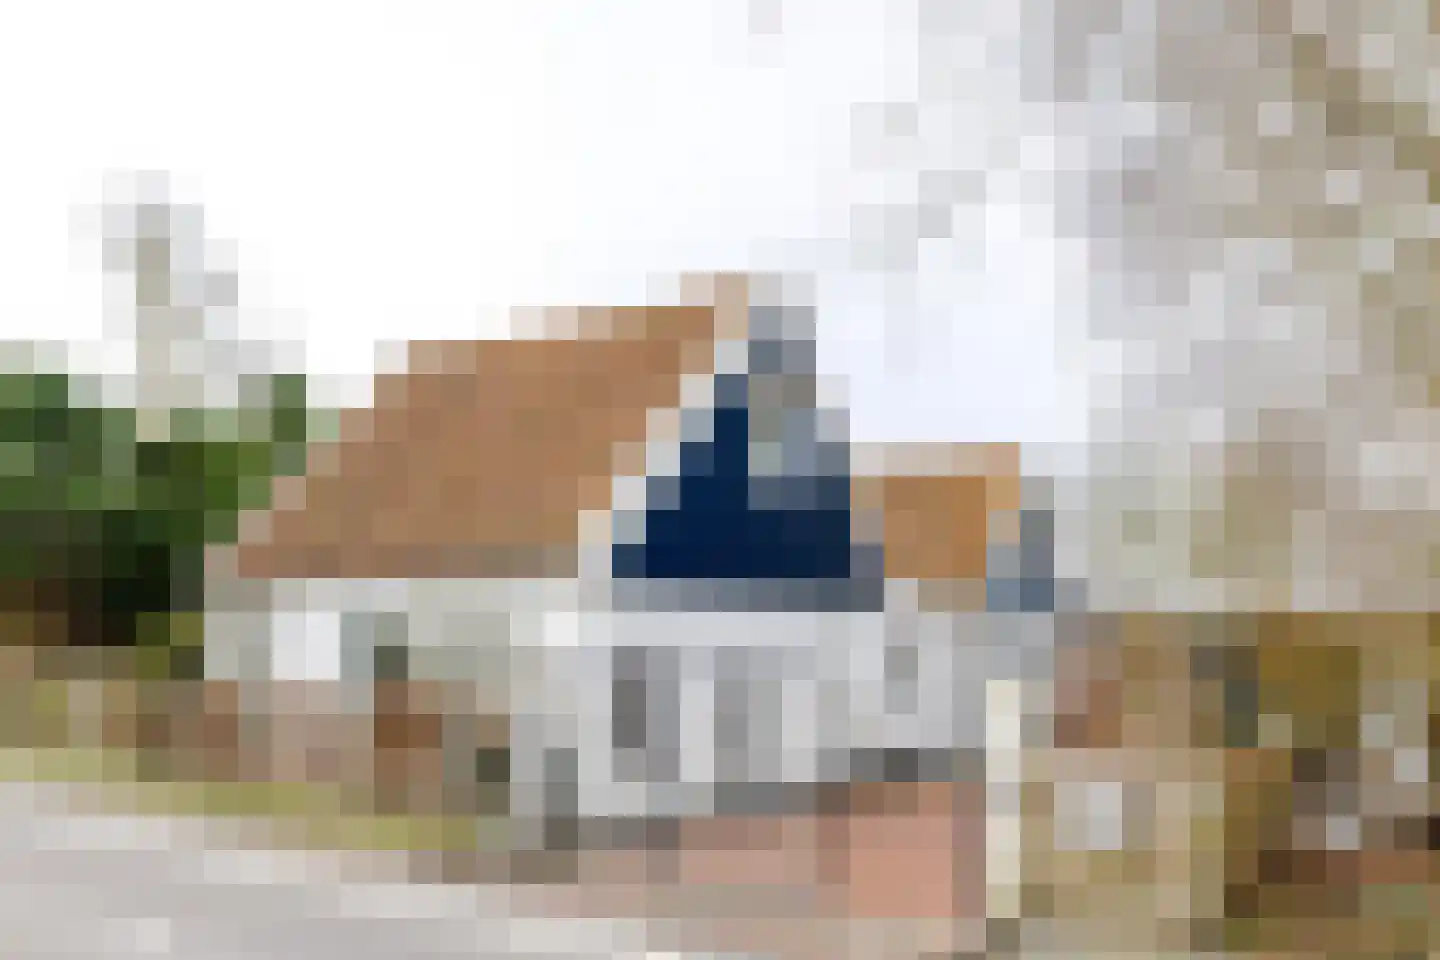
Housing offer in Noordbeemster

Searching in 9 houses in Noordbeemster

Connected to: Vastgoed Nederland NVM Makelaars

View the current housing stock in Noordbeemster and quickly filter by price, living area, rooms and more. There are currently 9 houses in this place within our selection.

Selection

Search and filter homes

Set your preferences and discover homes that suit you.

Total supply 245.131
Filters

Set price, area and other characteristics. Adjust a filter or click on Show homes. Location changes directly above.

Reset filters

You search for

  • Place Noordbeemster

Selling a home in Noordbeemster? Compare realtor offers

Get free quotes from real estate agents with local market knowledge. Compare more than 27 real estate agents in Noordbeemster.

Free request a quote

  • Quotes in Noordbeemster
  • Non-binding
  • Personal
  • Compare free rates

Selling a home in Noordbeemster? Compare all real estate agents in Noordbeemster or view the top 10 real estate agents in Noordbeemster for extra context for your choice.

Compare multiple quotes

Real estate agents make sharper offers when they know you're comparing — ask for quotes for sale or purchase.

Frequently asked questions about homes in Noordbeemster

Practical answers about housing supply, sales and comparing real estate agents in Noordbeemster.

Residential and neighborhood statistics in Noordbeemster

View current location data on residents, WOZ development, housing stock, energy consumption, business activity and safety in Noordbeemster. In 2025 were there 605 residents. The average WOZ value in 2025 is EUR 691.000.

These figures help to better assess and compare the housing stock in Noordbeemster with recent sold homes. Orient yourself then on suitable top real estate agents in Noordbeemster for sales advice in this region.

Residents

605

Last year: 2025

Average WOZ

EUR 691.000

Last year: 2025

Average income per person.

EUR 40.700

Source: AllNumbers

Crimes (current year)

71

Total registered

Demographics and WOZ development

Inhabitants per year

Inhabitants per year in Noordbeemster
Year Residents
2021 615
2022 605
2023 615
2024 625
2025 605

Annual WOZ value

WOZ value per year in Noordbeemster
Year Average WOZ
2021 EUR 550.000
2022 EUR 590.000
2023 EUR 651.000
2024 EUR 671.000
2025 EUR 691.000

Composition of residents

Age build-up

65+: 135 0-15: 80 15-25: 70 25-45: 100 45-65: 220

Education level

Hoger

150

Praktisch

90

Middelbaar

240

Origin of residents (2025)

Europa

25

Nederland

555

Buiten Europa

25

Housing stock and construction periods

Types of homes

Hoekwoningen 2
Appartementen 13
Tussenwoningen 1
Vrijstaande woningen 208
Twee-onder-één-kap woningen 21

Construction period of buildings

Voor 1700 4
1700 tot 1900 75
1900 tot 1925 54
1925 tot 1950 31
1950 tot 1970 30
1970 tot 1980 12
1980 tot 1990 8
1990 tot 2000 13
2000 tot 2010 13
2010 tot 2020 10
2020 en later 12

Energy and sustainability

Energy label distribution

Label G

106

Label C

25

Label F

22

Label A

21

Label D

19

Label B

13

Label E

12

Label A++

3

Label A+

1

Label A+++

1

Label A++++

1

Label A+++++

0

Average energy consumption per year

Average energy consumption per year in Noordbeemster
Year Gas (m3) Electricity (kWh)
2020 2.112 4.422
2021 2.310 4.380
2022 1.730 4.240
2023 1.430 3.990
2024 1.400 4.030

Consumption per house type

Hoekwoning

Gas: 131 • Electricity: 352

Huurwoning

Gas: 1.330 • Electricity: 4.150

Koopwoning

Gas: 1.450 • Electricity: 4.000

Appartement

Gas: 340 • Electricity: 810

Tussenwoning

Gas: 110 • Electricity: 285

Vrijstaande woning

Gas: 1.460 • Electricity: 4.080

Twee-onder-één-kap woning

Gas: 1.160 • Electricity: 2.970

Business activity in Noordbeemster (2025)

Handel en HORECA 25
Nijverheid en energie 20
Zakelijke dienstverlening 30
Overheid, onderwijs en zorg 15
Landbouw, bosbouw en visserij 40
Vervoer, informatie en communicatie 10
Financiele diensten en onroerendgoed 5
Cultuur, recreatie en overige diensten 20

Total number of company establishments: 165

Recent crime statistics

Recent crime statistics in Noordbeemster
Period Crimes
jan 2025 11
jan 2026 4
jul 2025 7
jun 2025 1
mei 2025 8
mrt 2025 12
nov 2024 2
nov 2025 2
okt 2024 14
okt 2025 4
sep 2024 5
sep 2025 5

These figures give an indicative picture of safety trends in the living environment of Noordbeemster.

Frequently asked questions about living in Noordbeemster

Short answers based on current local statistics, handy for a quick comparison of the living environment.

Hoeveel inwoners heeft Noordbeemster?

Noordbeemster telt in 2025 ongeveer 605 inwoners.

Wat is de gemiddelde WOZ-waarde in Noordbeemster?

De gemiddelde WOZ-waarde in Noordbeemster is in 2025 circa € 691.000.

Wat is het gemiddelde inkomen per inwoner in Noordbeemster?

Het gemiddelde inkomen per inwoner in Noordbeemster ligt rond € 40.700 per jaar.

Hoe veilig is wonen in Noordbeemster?

Voor het huidige jaar gaat het om ongeveer 71 geregistreerde misdrijven. Gebruik deze cijfers als indicatie en vergelijk trends per periode.

Welke woningtypen komen het meest voor in Noordbeemster?

In Noordbeemster komt vooral "Vrijstaande woningen" veel voor, met ongeveer 208 woningen.

Receive free, non-binding quotes

Compare multiple real estate agents and choose the best match.