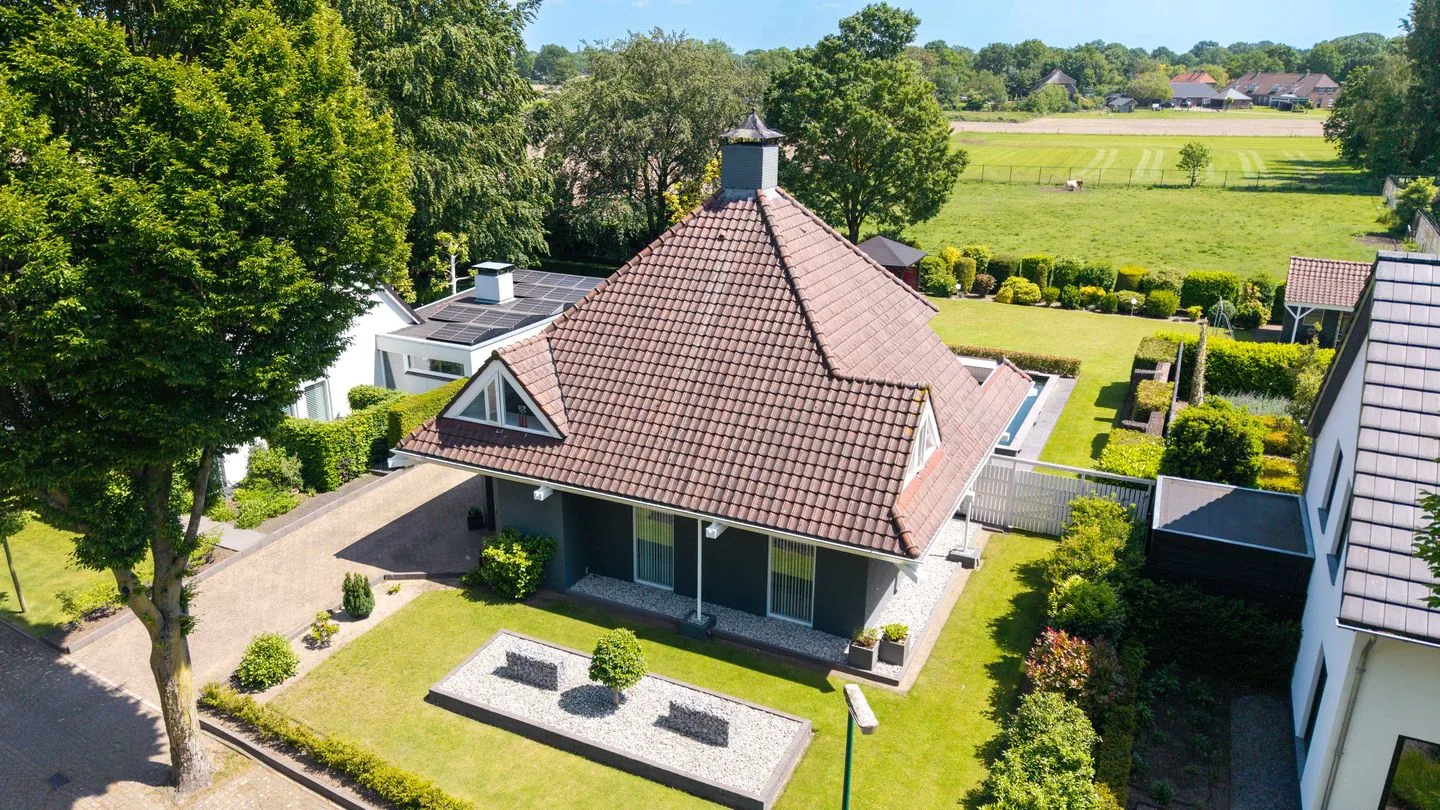
- Available
Molenstraat 19
5391AT Nuland
€ 485.000 k.k.
€ 4.850/m²
- Living area
- 100 m²
- Land area
- 268 m²
- Bedrooms
- —
Searching in 51 houses in Nuland
Type to search. Use arrow down and arrow up to navigate through results and press Enter to open.
Hidden search suggestions.
View current properties in Nuland or search targeted on street, postal code and property characteristics.
View the current housing stock in Nuland and quickly filter by price, living area, rooms and more. There are currently 51 houses in this place within our selection. View also 32 sold houses in Nuland for extra insight into the local housing market.
5391AT Nuland
€ 485.000 k.k.
€ 4.850/m²
5391JC Nuland
€ 475.000 k.k.
€ 3.958/m²
5391CN Nuland
€ 525.000 k.k.
€ 4.167/m²
5391KV Nuland
€ 400.000 k.k.
€ 3.540/m²
5391AK Nuland
€ 955.000 k.k.
€ 4.591/m²
5391BC Nuland
€ 475.000 k.k.
€ 4.279/m²
5391AX Nuland
€ 510.000 k.k.
€ 4.215/m²
5391AW Nuland
€ 409.000 k.k.
€ 5.312/m²
5391BT Nuland
€ 545.000 k.k.
€ 3.609/m²
5391EH Nuland
€ 609.000 k.k.
€ 3.155/m²
5391CP Nuland
€ 545.000 k.k.
5392CT Nuland
€ 439.000 k.k.
€ 3.885/m²
5392CM Nuland
€ 589.000 k.k.
€ 3.328/m²
5391KT Nuland
€ 430.000 k.k.
€ 4.057/m²
5391AW Nuland
€ 999.000 k.k.
€ 3.842/m²
5391BA Nuland
€ 685.000 k.k.
€ 4.692/m²
5391KE Nuland
€ 695.000 k.k.
€ 4.860/m²
5391KE Nuland
€ 495.000 k.k.
€ 2.210/m²
5391BC Nuland
€ 650.000 k.k.
€ 4.676/m²
5392CM Nuland
€ 400.000 k.k.
€ 3.670/m²
5391BH Nuland
€ 569.500 k.k.
€ 3.674/m²
5391GB Nuland
€ 689.000 k.k.
€ 4.150/m²
5391EP Nuland
€ 650.000 k.k.
€ 5.701/m²
5392CC Nuland
€ 415.000 k.k.
€ 3.879/m²
5391JC Nuland
€ 475.000 k.k.
€ 3.861/m²
5391JA Nuland
€ 789.500 k.k.
€ 3.908/m²
5391AV Nuland
€ 525.000 k.k.
€ 4.487/m²
5391AW Nuland
€ 379.500 k.k.
€ 5.199/m²
Get free quotes from real estate agents with local market knowledge. Compare more than 73 real estate agents in Nuland.
Selling a home in Nuland? Compare all real estate agents in Nuland or view the top 10 real estate agents in Nuland for extra context for your choice.
Real estate agents make sharper offers when they know you're comparing — ask for quotes for sale or purchase.
Practical answers about housing supply, sales and comparing real estate agents in Nuland.
The costs of a real estate agent in Nuland depend on commission, setup costs, property presentation and the chosen service. Compare the 73 real estate agents in Nuland via the real estate agent page and request multiple quotes to compare rates and approach well.
Within our selection, we are currently showing 51 houses in Nuland. View also the sold houses in Nuland to compare the current offering with recent transactions.
Take into account not only price and living area but also maintenance, energy label, location, outdoor space and sales status. This way you compare houses in Nuland on more than just the asking price.
A local real estate agent knows the neighborhoods, recent transactions and demand in Nuland. By comparing 73 real estate agents in the region you get a better insight into prices, sales strategy and expected yield; the top 10 in Nuland provides a useful starting point.
Yes, when making a sales plan, a valuation in Nuland is wise. You gain insight into a realistic asking price and can then compare offers from real estate agents specifically.
View current location data on residents, WOZ development, housing stock, energy consumption, business activity and safety in Nuland. In 2025 were there 4.765 residents. The average WOZ value in 2025 is EUR 472.000.
These figures help to better assess and compare the housing stock in Nuland with recent sold homes. Orient yourself then on suitable top real estate agents in Nuland for sales advice in this region.
Residents
4.765
Last year: 2025
Average WOZ
EUR 472.000
Last year: 2025
Average income per person.
EUR 40.200
Source: AllNumbers
Crimes (current year)
173
Total registered
| Year | Residents |
|---|---|
| 2021 | 4.575 |
| 2022 | 4.550 |
| 2023 | 4.660 |
| 2024 | 4.700 |
| 2025 | 4.765 |
| Year | Average WOZ |
|---|---|
| 2021 | EUR 366.000 |
| 2022 | EUR 389.000 |
| 2023 | EUR 456.000 |
| 2024 | EUR 475.000 |
| 2025 | EUR 472.000 |
Hoger
900
Praktisch
1.010
Middelbaar
1.570
Europa
270
Nederland
4.205
Buiten Europa
285
Label A
555
Label C
549
Label B
330
Label F
204
Label D
194
Label G
76
Label E
65
Label A+++
59
Label A+
19
Label A++
12
Label A++++
4
Label A+++++
2
| Year | Gas (m3) | Electricity (kWh) |
|---|---|---|
| 2020 | 1.440 | 3.660 |
| 2021 | 1.590 | 3.650 |
| 2022 | 1.240 | 3.450 |
| 2023 | 1.050 | 3.280 |
| 2024 | 1.030 | 3.400 |
Hoekwoning
Gas: 880 • Electricity: 2.760
Huurwoning
Gas: 790 • Electricity: 2.060
Koopwoning
Gas: 1.160 • Electricity: 3.830
Appartement
Gas: 690 • Electricity: 1.690
Tussenwoning
Gas: 770 • Electricity: 2.510
Vrijstaande woning
Gas: 1.340 • Electricity: 4.330
Twee-onder-één-kap woning
Gas: 1.050 • Electricity: 3.280
Total number of company establishments: 755
| Period | Crimes |
|---|---|
| jan 2025 | 6 |
| jan 2026 | 11 |
| jul 2025 | 16 |
| jun 2025 | 11 |
| mei 2025 | 8 |
| mrt 2025 | 24 |
| nov 2024 | 7 |
| nov 2025 | 17 |
| okt 2024 | 13 |
| okt 2025 | 23 |
| sep 2024 | 8 |
| sep 2025 | 13 |
These figures give an indicative picture of safety trends in the living environment of Nuland.
Short answers based on current local statistics, handy for a quick comparison of the living environment.
Nuland telt in 2025 ongeveer 4.765 inwoners.
De gemiddelde WOZ-waarde in Nuland is in 2025 circa € 472.000.
Het gemiddelde inkomen per inwoner in Nuland ligt rond € 40.200 per jaar.
Voor het huidige jaar gaat het om ongeveer 173 geregistreerde misdrijven. Gebruik deze cijfers als indicatie en vergelijk trends per periode.
In Nuland komt vooral "Vrijstaande woningen" veel voor, met ongeveer 771 woningen.