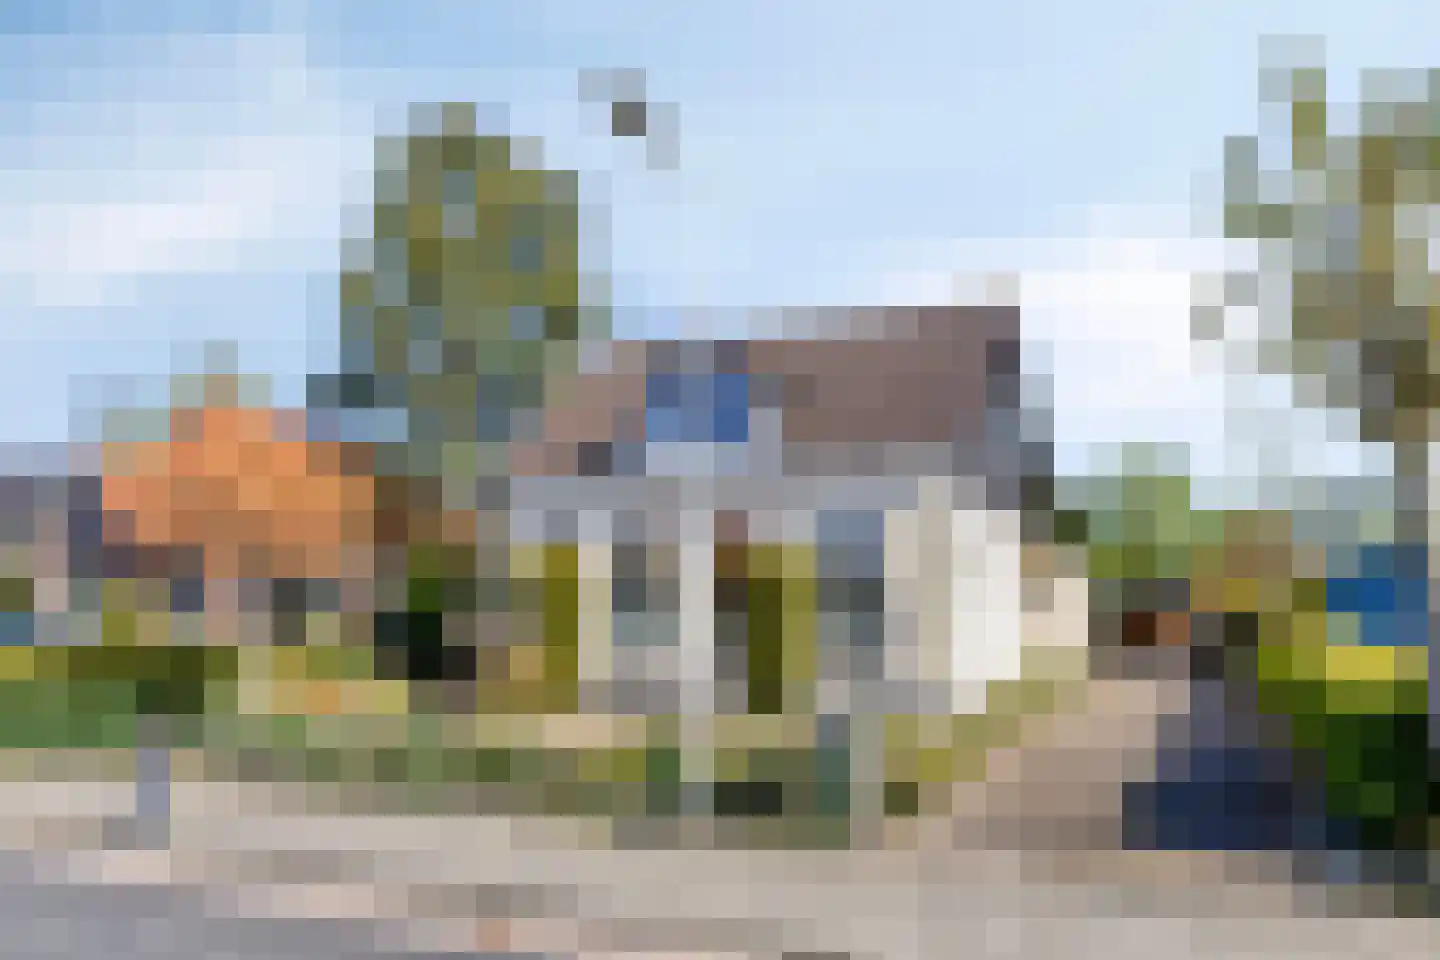
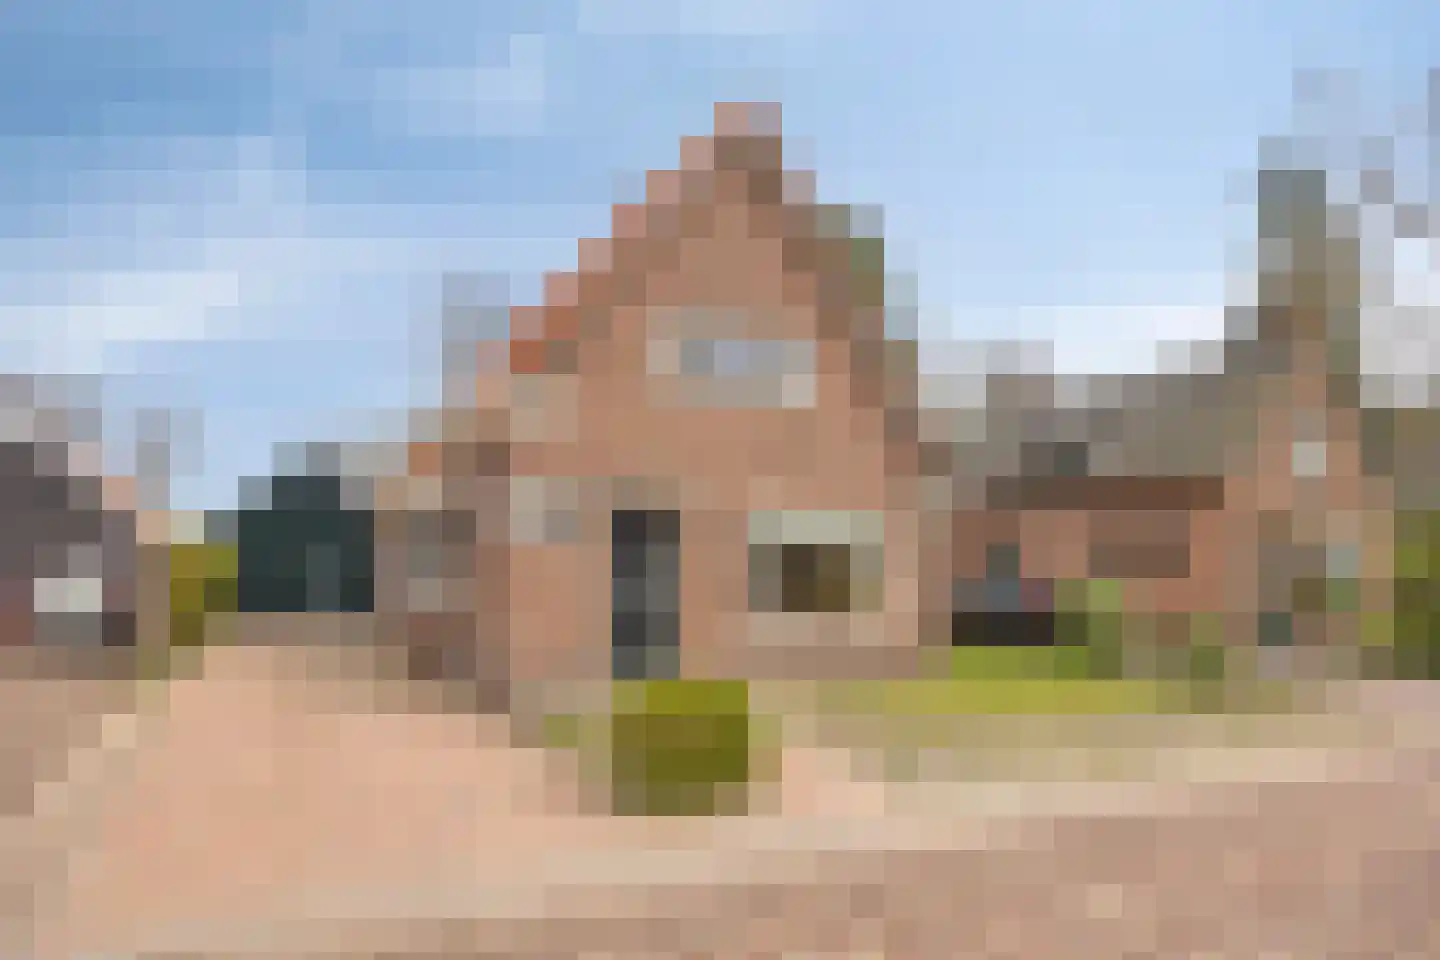
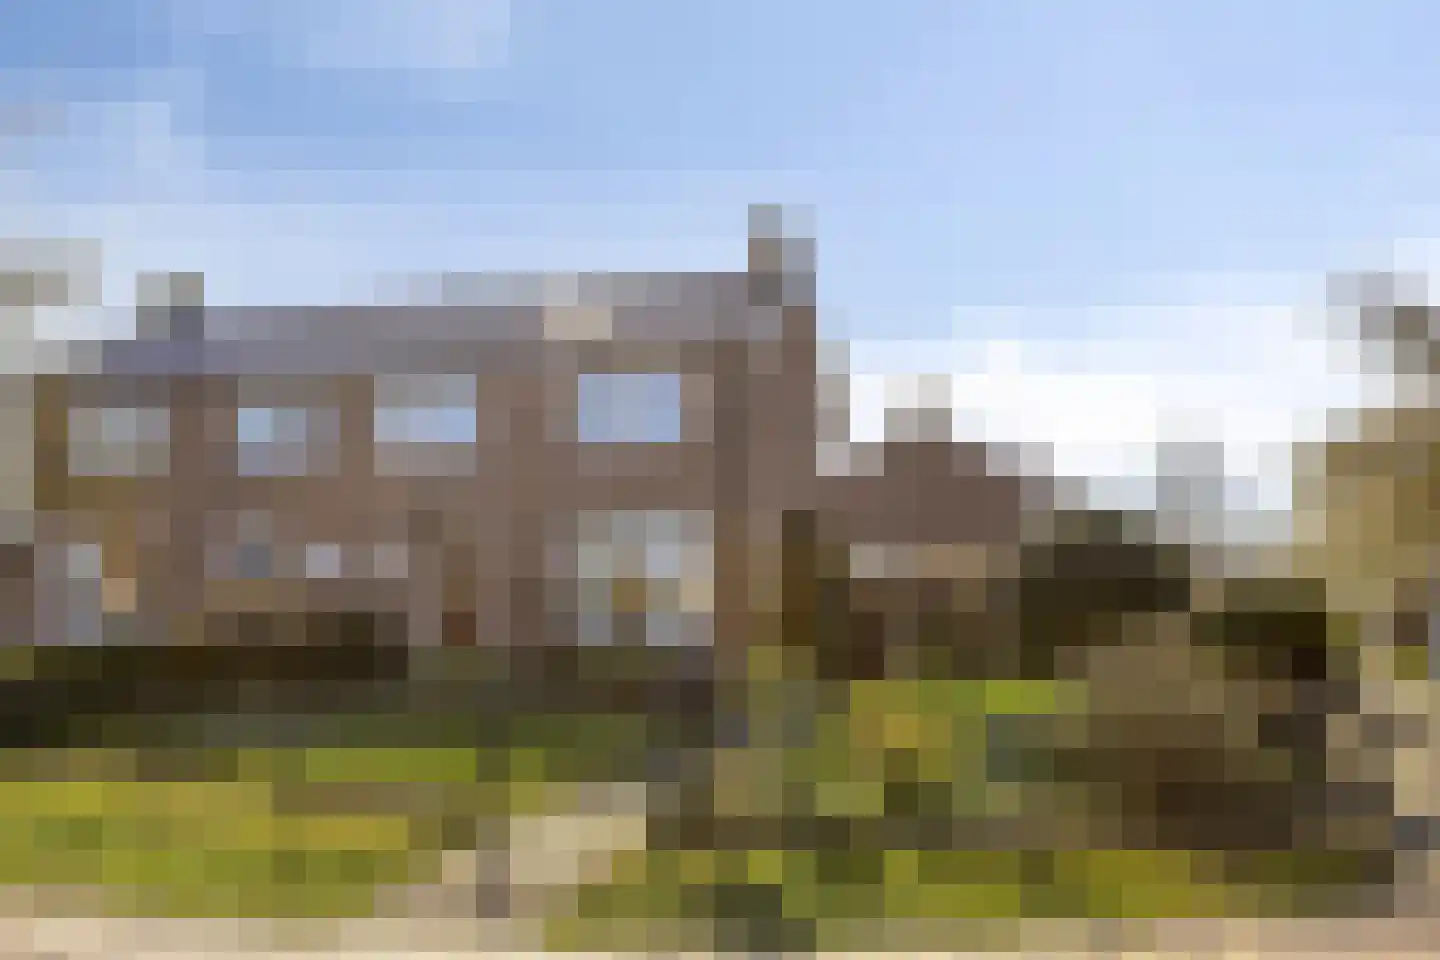
Housing offer in Oldeberkoop

Searching in 16 houses in Oldeberkoop

Connected to: Vastgoed Nederland NVM Makelaars

View the current housing stock in Oldeberkoop and quickly filter by price, living area, rooms and more. There are currently 16 houses in this place within our selection. View also 7 sold houses in Oldeberkoop for extra insight into the local housing market.

Selection

Search and filter homes

Set your preferences and discover homes that suit you.

Total supply 247.007
Filters

Set price, area and other characteristics. Adjust a filter or click on Show homes. Location changes directly above.

Reset filters

You search for

  • Place Oldeberkoop

Selling a home in Oldeberkoop? Compare realtor offers

Get free quotes from real estate agents with local market knowledge. Compare more than 19 real estate agents in Oldeberkoop.

Free request a quote

  • Quotes in Oldeberkoop
  • Non-binding
  • Personal
  • Compare free rates

Selling a home in Oldeberkoop? Compare all real estate agents in Oldeberkoop or view the top 10 real estate agents in Oldeberkoop for extra context for your choice.

Compare multiple quotes

Real estate agents make sharper offers when they know you're comparing — ask for quotes for sale or purchase.

Frequently asked questions about homes in Oldeberkoop

Practical answers about housing supply, sales and comparing real estate agents in Oldeberkoop.

Residential and neighborhood statistics in Oldeberkoop

View current location data on residents, WOZ development, housing stock, energy consumption, business activity and safety in Oldeberkoop. In 2026 were there 1.511 residents. The average WOZ value in 2025 is EUR 358.000.

These figures help to better assess and compare the housing stock in Oldeberkoop with recent sold homes. Orient yourself then on suitable top real estate agents in Oldeberkoop for sales advice in this region.

Residents

1.511

Last year: 2026

Average WOZ

EUR 358.000

Last year: 2025

Average income per person.

EUR 30.900

Source: AllNumbers

Crimes (current year)

24

Total registered

Demographics and WOZ development

Inhabitants per year

Inhabitants per year in Oldeberkoop
Year Residents
2021 1.575
2022 1.555
2023 1.535
2024 1.500
2025 1.490
2026 1.511

Annual WOZ value

WOZ value per year in Oldeberkoop
Year Average WOZ
2021 EUR 279.000
2022 EUR 310.000
2023 EUR 356.000
2024 EUR 357.000
2025 EUR 358.000

Composition of residents

Age build-up

65+: 425 0-15: 220 15-25: 145 25-45: 270 45-65: 460

Education level

Hoger

310

Praktisch

310

Middelbaar

460

Origin of residents (2025)

Europa

65

Nederland

1.390

Buiten Europa

40

Housing stock and construction periods

Types of homes

Hoekwoningen 54
Appartementen 30
Tussenwoningen 47
Vrijstaande woningen 418
Twee-onder-één-kap woningen 128

Construction period of buildings

Voor 1700 1
1700 tot 1900 35
1900 tot 1925 70
1925 tot 1950 87
1950 tot 1970 201
1970 tot 1980 245
1980 tot 1990 40
1990 tot 2000 52
2000 tot 2010 41
2010 tot 2020 11
2020 en later 14

Energy and sustainability

Energy label distribution

Label C

137

Label G

136

Label B

115

Label D

110

Label A

94

Label F

67

Label E

32

Label A+

6

Label A++

2

Label A++++

1

Label A+++

0

Label A+++++

0

Average energy consumption per year

Average energy consumption per year in Oldeberkoop
Year Gas (m3) Electricity (kWh)
2020 1.600 2.960
2021 1.800 2.980
2022 1.380 2.840
2023 1.130 2.720
2024 1.110 2.810

Consumption per house type

Hoekwoning

Gas: 900 • Electricity: 1.870

Huurwoning

Gas: 940 • Electricity: 1.830

Koopwoning

Gas: 1.190 • Electricity: 3.000

Appartement

Gas: 740 • Electricity: 1.700

Tussenwoning

Gas: 840 • Electricity: 1.520

Vrijstaande woning

Gas: 1.270 • Electricity: 3.150

Twee-onder-één-kap woning

Gas: 930 • Electricity: 2.270

Business activity in Oldeberkoop (2025)

Handel en HORECA 35
Nijverheid en energie 40
Zakelijke dienstverlening 35
Overheid, onderwijs en zorg 40
Landbouw, bosbouw en visserij 40
Vervoer, informatie en communicatie 15
Financiele diensten en onroerendgoed 10
Cultuur, recreatie en overige diensten 25

Total number of company establishments: 235

Recent crime statistics

Recent crime statistics in Oldeberkoop
Period Crimes
jan 2026 0
jul 2025 2
jun 2025 3
mei 2025 2
mrt 2025 1
mrt 2026 4
nov 2024 2
nov 2025 1
okt 2024 2
okt 2025 0
sep 2024 4
sep 2025 1

These figures give an indicative picture of safety trends in the living environment of Oldeberkoop.

Frequently asked questions about living in Oldeberkoop

Short answers based on current local statistics, handy for a quick comparison of the living environment.

Hoeveel inwoners heeft Oldeberkoop?

Oldeberkoop telt in 2026 ongeveer 1.511 inwoners.

Wat is de gemiddelde WOZ-waarde in Oldeberkoop?

De gemiddelde WOZ-waarde in Oldeberkoop is in 2025 circa € 358.000.

Wat is het gemiddelde inkomen per inwoner in Oldeberkoop?

Het gemiddelde inkomen per inwoner in Oldeberkoop ligt rond € 30.900 per jaar.

Hoe veilig is wonen in Oldeberkoop?

Voor het huidige jaar gaat het om ongeveer 24 geregistreerde misdrijven. Gebruik deze cijfers als indicatie en vergelijk trends per periode.

Welke woningtypen komen het meest voor in Oldeberkoop?

In Oldeberkoop komt vooral "Vrijstaande woningen" veel voor, met ongeveer 418 woningen.

Receive free, non-binding quotes

Compare multiple real estate agents and choose the best match.