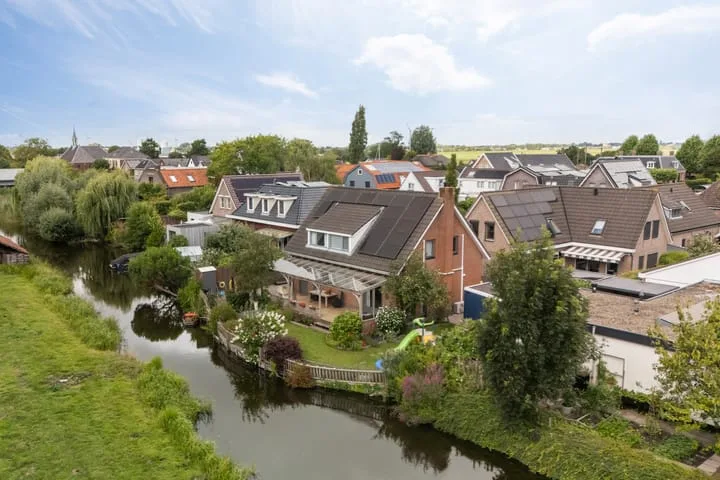
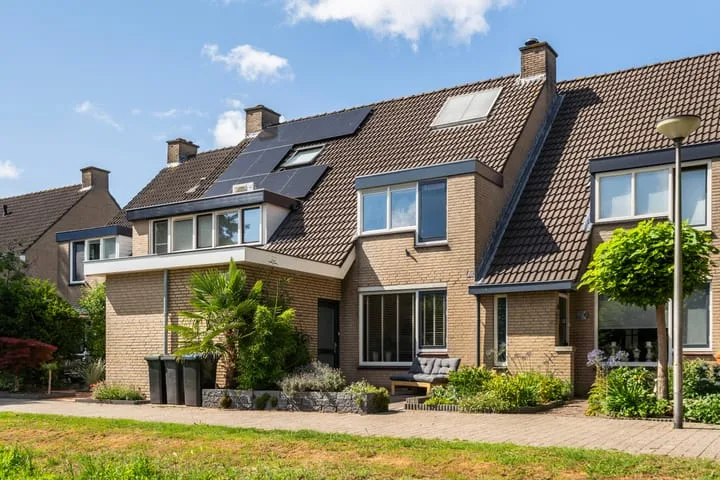
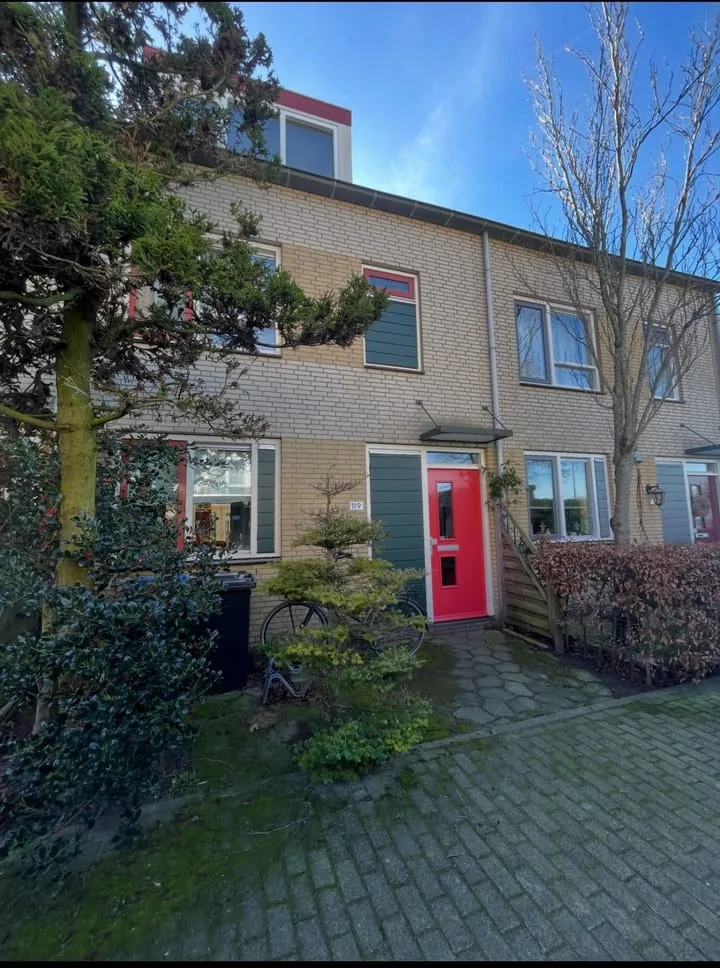
Houses sold in Oude Wetering

View 23 sold houses in Oude Wetering

Connected to: Vastgoed Nederland NVM Makelaars

On this page you will find recently sold homes in Oude Wetering. Use this overview to better estimate selling prices, popular neighborhoods, and the local housing supply before you choose a real estate agent. Also view the current housing supply with 29 houses in Oude Wetering.

Selection

Search and filter homes

Set your preferences and discover homes that suit you.

Total supply 242.022
Filters

Set price, area and other characteristics. Adjust a filter or click on Show homes. Location changes directly above.

Reset filters

You search for

  • Place Oude Wetering
  • Status Sold

Huis verkopen in Oude Wetering? Vergelijk verkoopmakelaars

Bekijk recente verkopen en ontvang gratis offertes van lokale makelaars. Vergelijk meer dan 69 makelaars in Oude Wetering.

Free request a quote

  • Quotes in Oude Wetering
  • Non-binding
  • Personal
  • Compare free rates

Zelf je woning verkopen in Oude Wetering? Vergelijk verkoopmakelaars in Oude Wetering of bekijk de beste verkoopmakelaars in Oude Wetering als referentie bij jouw keuze.

Vergelijk meerdere offertes

Makelaars maken scherpere voorstellen als ze weten dat je vergelijkt — vraag offertes aan voor verkoop of aankoop.

Frequently asked questions about sold homes in Oude Wetering

Short answers about housing prices, sold homes and comparing real estate agents in Oude Wetering.

Residential and neighborhood statistics in Oude Wetering

View current location data on residents, WOZ development, housing stock, energy consumption, business activity and safety in Oude Wetering. In 2025 were there 3.538 residents. The average WOZ value in 2025 is EUR 428.369.

These figures help to better assess and compare the housing stock in Oude Wetering with recent sold homes. Orient yourself then on suitable top real estate agents in Oude Wetering for sales advice in this region.

Residents

3.538

Last year: 2025

Average WOZ

EUR 428.369

Last year: 2025

Average income per person.

EUR 27.114

Source: AllNumbers

Crimes (current year)

58

Total registered

Demographics and WOZ development

Inhabitants per year

Inhabitants per year in Oude Wetering
Year Residents
2021 3.563
2022 3.569
2023 3.565
2024 3.549
2025 3.538

Annual WOZ value

WOZ value per year in Oude Wetering
Year Average WOZ
2021 EUR 306.532
2022 EUR 334.965
2023 EUR 396.544
2024 EUR 410.501
2025 EUR 428.369

Composition of residents

Age build-up

65+: 812 0-15: 531 15-25: 350 25-45: 807 45-65: 1.049

Education level

Hoger

575

Praktisch

765

Middelbaar

1.266

Origin of residents (2025)

Europa

245

Nederland

2.877

Buiten Europa

421

Housing stock and construction periods

Types of homes

Hoekwoningen 304
Appartementen 476
Tussenwoningen 776
Vrijstaande woningen 128
Twee-onder-één-kap woningen 98

Construction period of buildings

Voor 1700 6
1700 tot 1900 31
1900 tot 1925 28
1925 tot 1950 54
1950 tot 1970 218
1970 tot 1980 132
1980 tot 1990 721
1990 tot 2000 145
2000 tot 2010 22
2010 tot 2020 12
2020 en later 54

Energy and sustainability

Energy label distribution

Label C

621

Label A

368

Label B

333

Label D

109

Label E

77

Label A+++

55

Label G

54

Label A++

51

Label F

33

Label A++++

29

Label A+

10

Label A+++++

0

Average energy consumption per year

Average energy consumption per year in Oude Wetering
Year Gas (m3) Electricity (kWh)
2020 1.096 2.860
2021 1.235 2.905
2022 964 2.620
2023 831 2.422
2024 819 2.455

Consumption per house type

Hoekwoning

Gas: 910 • Electricity: 2.528

Huurwoning

Gas: 706 • Electricity: 1.769

Koopwoning

Gas: 948 • Electricity: 2.889

Appartement

Gas: 577 • Electricity: 1.584

Tussenwoning

Gas: 802 • Electricity: 2.429

Vrijstaande woning

Gas: 1.463 • Electricity: 4.011

Twee-onder-één-kap woning

Gas: 1.140 • Electricity: 3.016

Business activity in Oude Wetering (2025)

Handel en HORECA 49
Nijverheid en energie 65
Zakelijke dienstverlening 110
Overheid, onderwijs en zorg 55
Landbouw, bosbouw en visserij 13
Vervoer, informatie en communicatie 22
Financiele diensten en onroerendgoed 19
Cultuur, recreatie en overige diensten 44

Total number of company establishments: 385

Recent crime statistics

Recent crime statistics in Oude Wetering
Period Crimes
jan 2025 6
jan 2026 1
jul 2025 7
jun 2025 4
mei 2025 3
mrt 2025 1
nov 2024 3
nov 2025 2
okt 2024 5
okt 2025 5
sep 2024 7
sep 2025 11

These figures give an indicative picture of safety trends in the living environment of Oude Wetering.

Frequently asked questions about living in Oude Wetering

Short answers based on current local statistics, handy for a quick comparison of the living environment.

Hoeveel inwoners heeft Oude Wetering?

Oude Wetering telt in 2025 ongeveer 3.538 inwoners.

Wat is de gemiddelde WOZ-waarde in Oude Wetering?

De gemiddelde WOZ-waarde in Oude Wetering is in 2025 circa € 428.369.

Wat is het gemiddelde inkomen per inwoner in Oude Wetering?

Het gemiddelde inkomen per inwoner in Oude Wetering ligt rond € 27.114 per jaar.

Hoe veilig is wonen in Oude Wetering?

Voor het huidige jaar gaat het om ongeveer 58 geregistreerde misdrijven. Gebruik deze cijfers als indicatie en vergelijk trends per periode.

Welke woningtypen komen het meest voor in Oude Wetering?

In Oude Wetering komt vooral "Tussenwoningen" veel voor, met ongeveer 776 woningen.

Receive free, non-binding quotes

Compare multiple real estate agents and choose the best match.