- Available
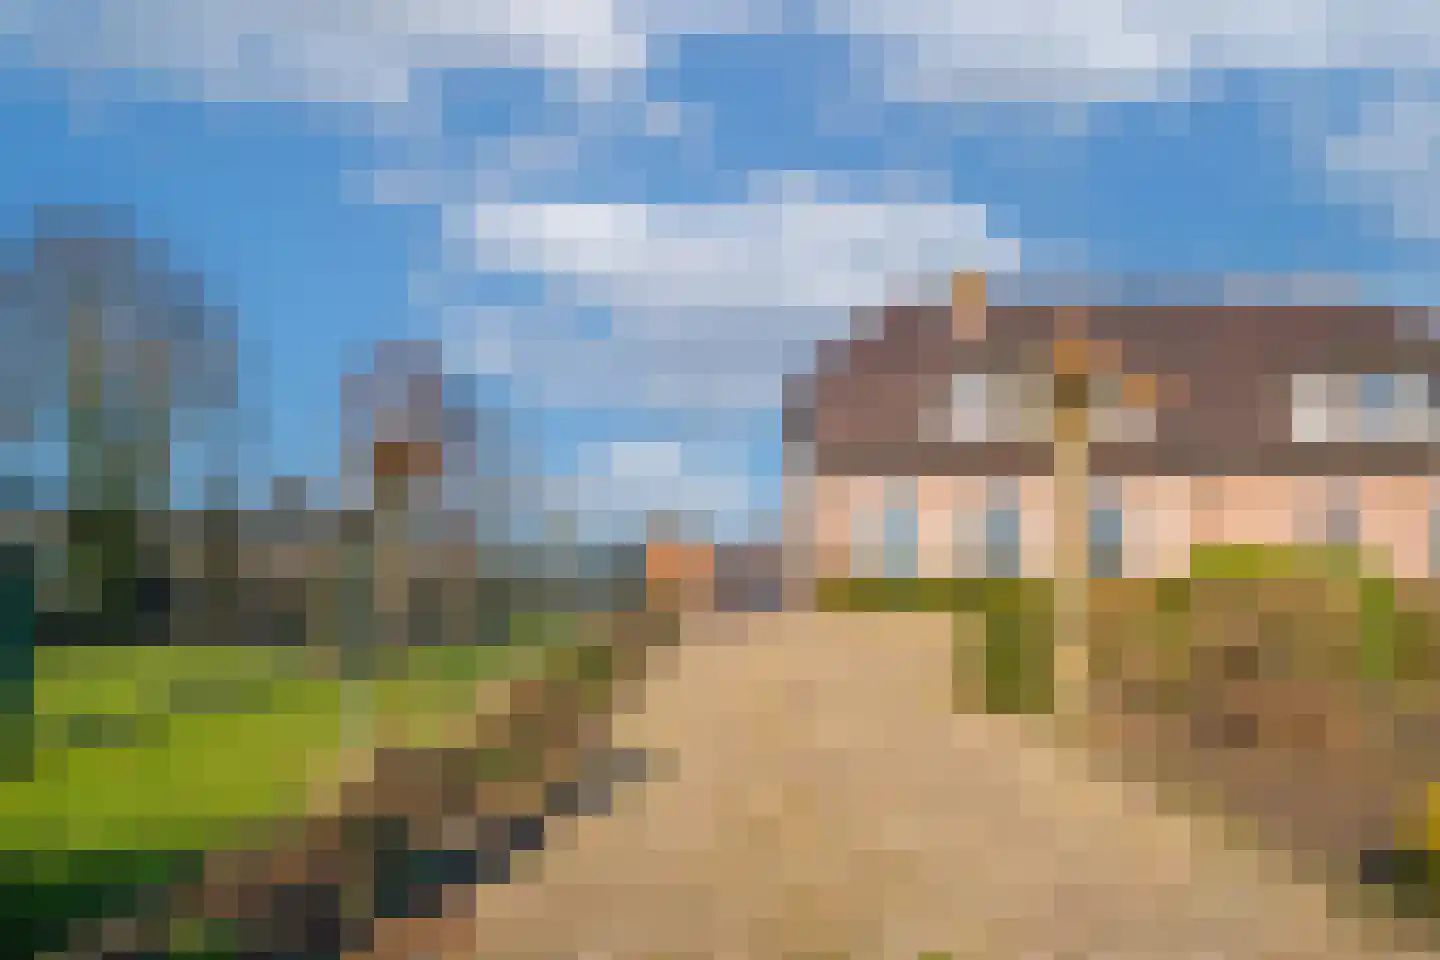
de Kuiperij 3
6911AA Pannerden
€ 299.000 k.k.
€ 3.437/m²
C
Save as favorite
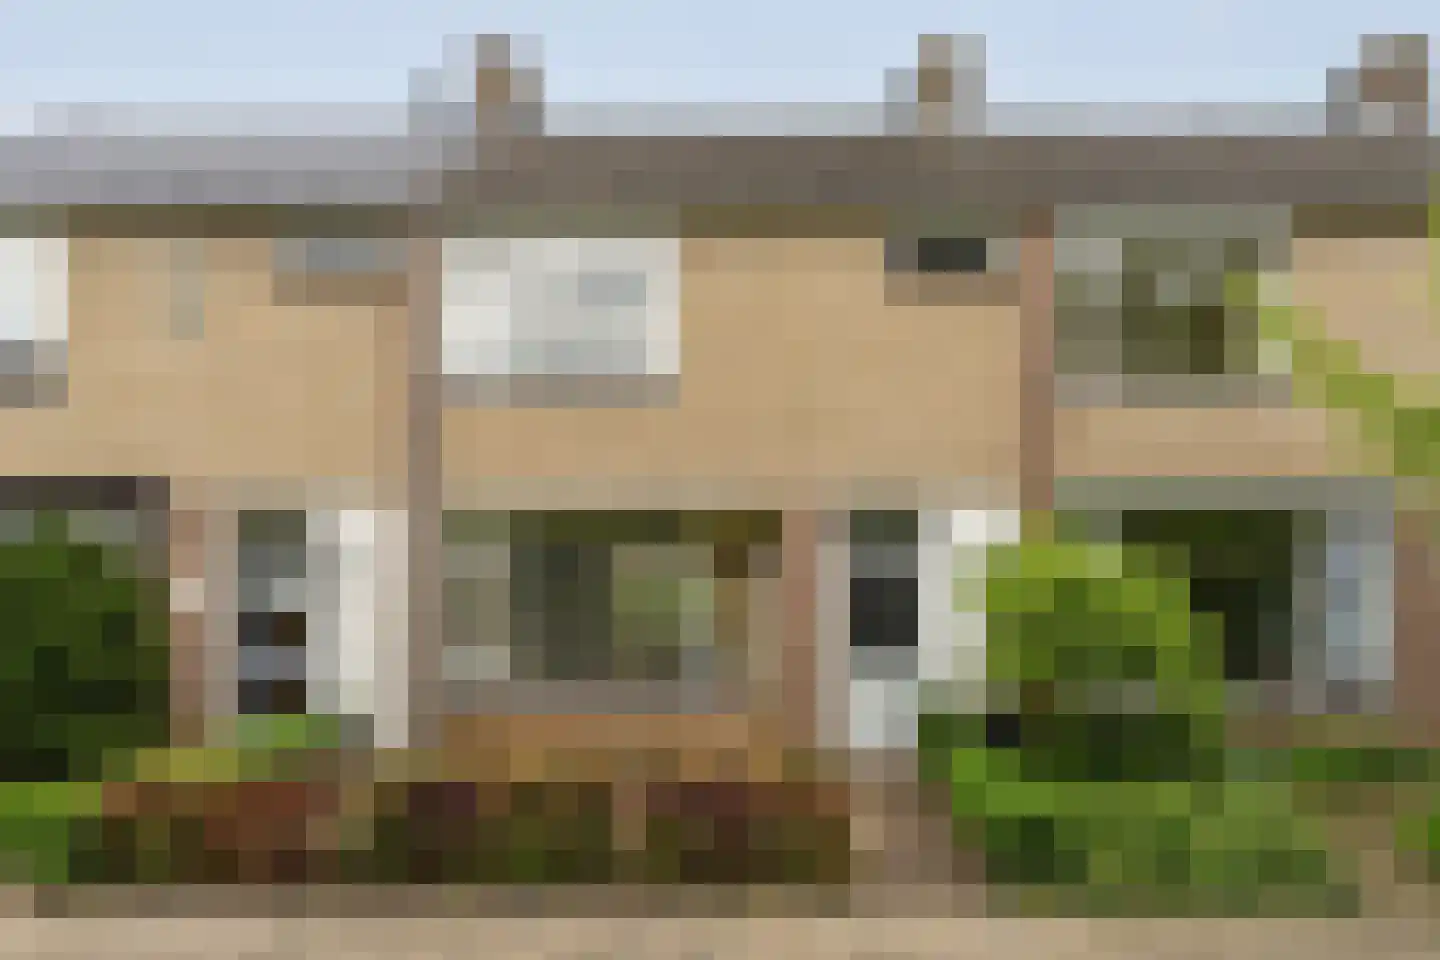
- Living area
- 87 m²
- Land area
- 181 m²
- Bedrooms
- 3