- Sold
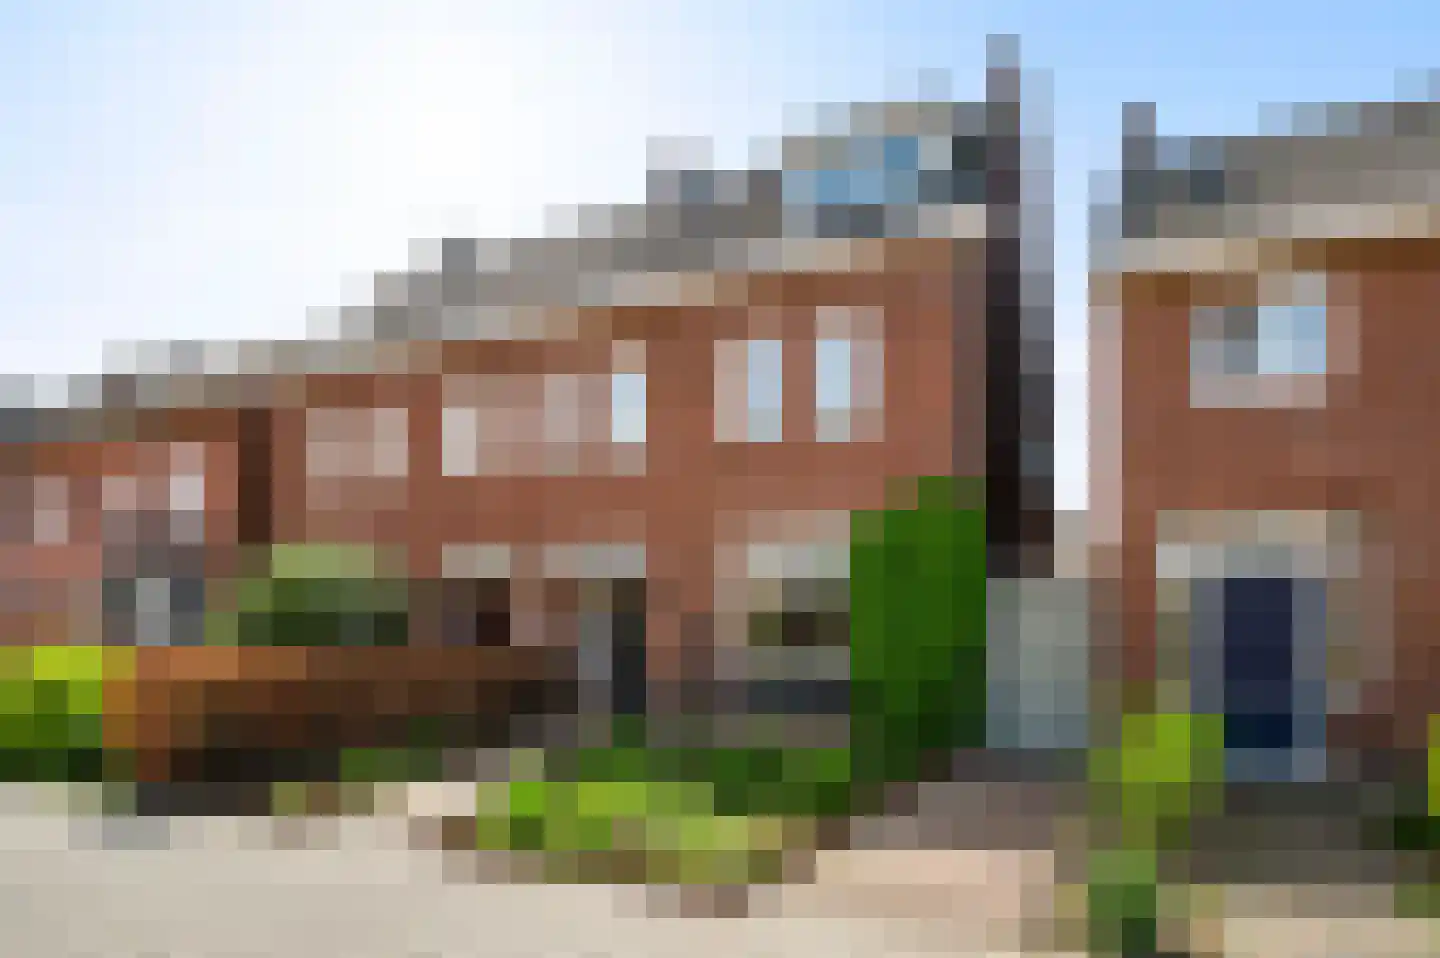
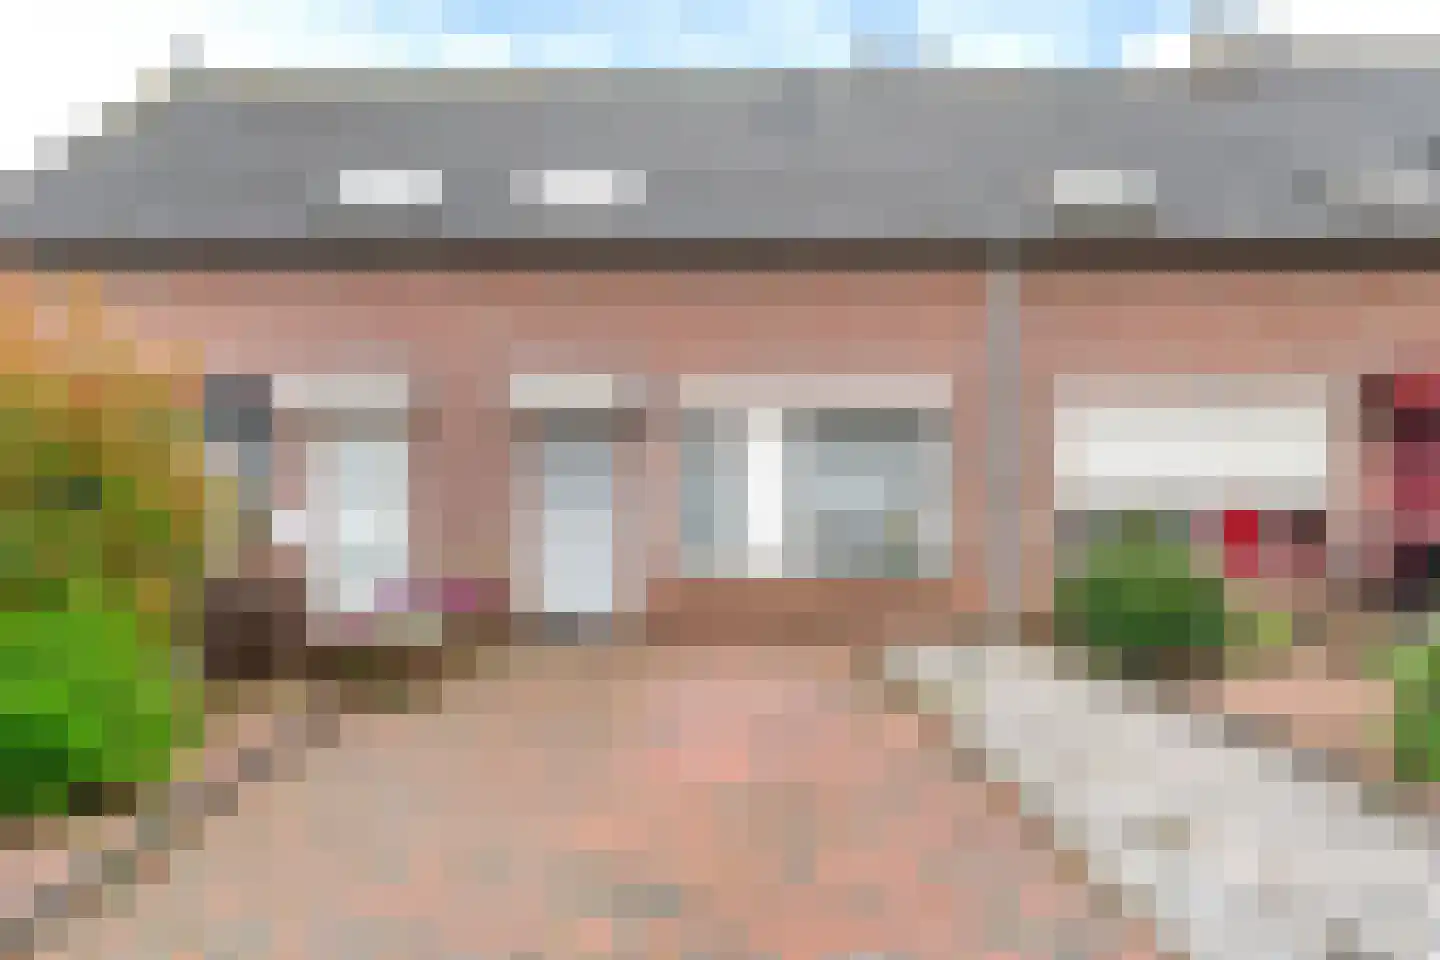
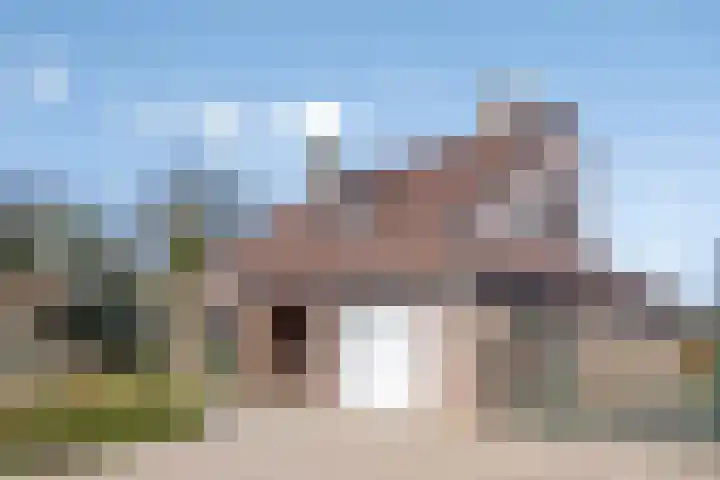
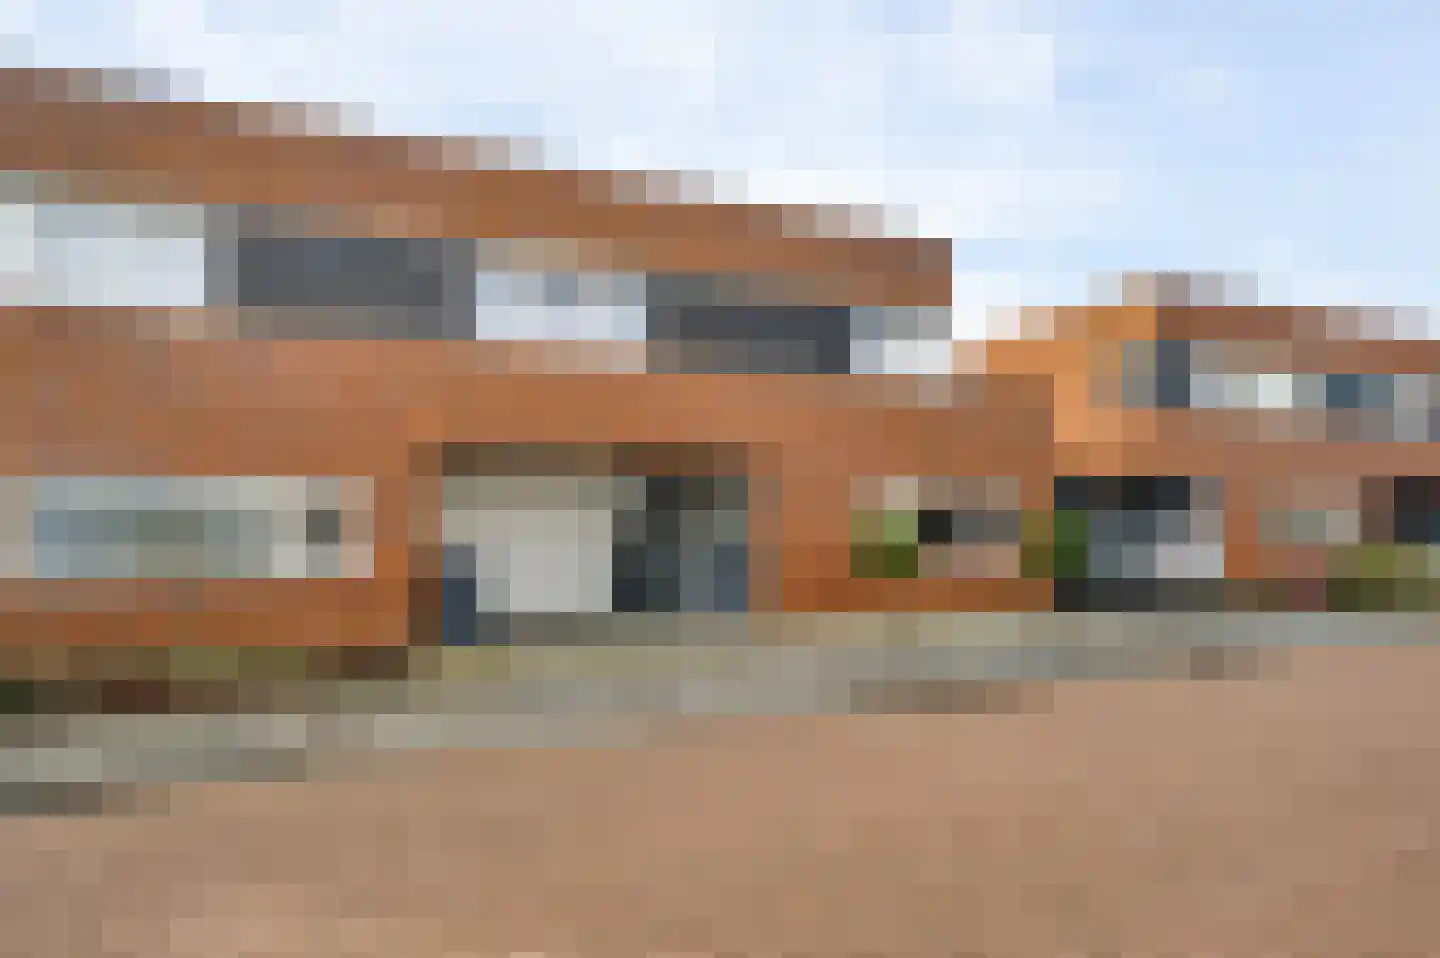
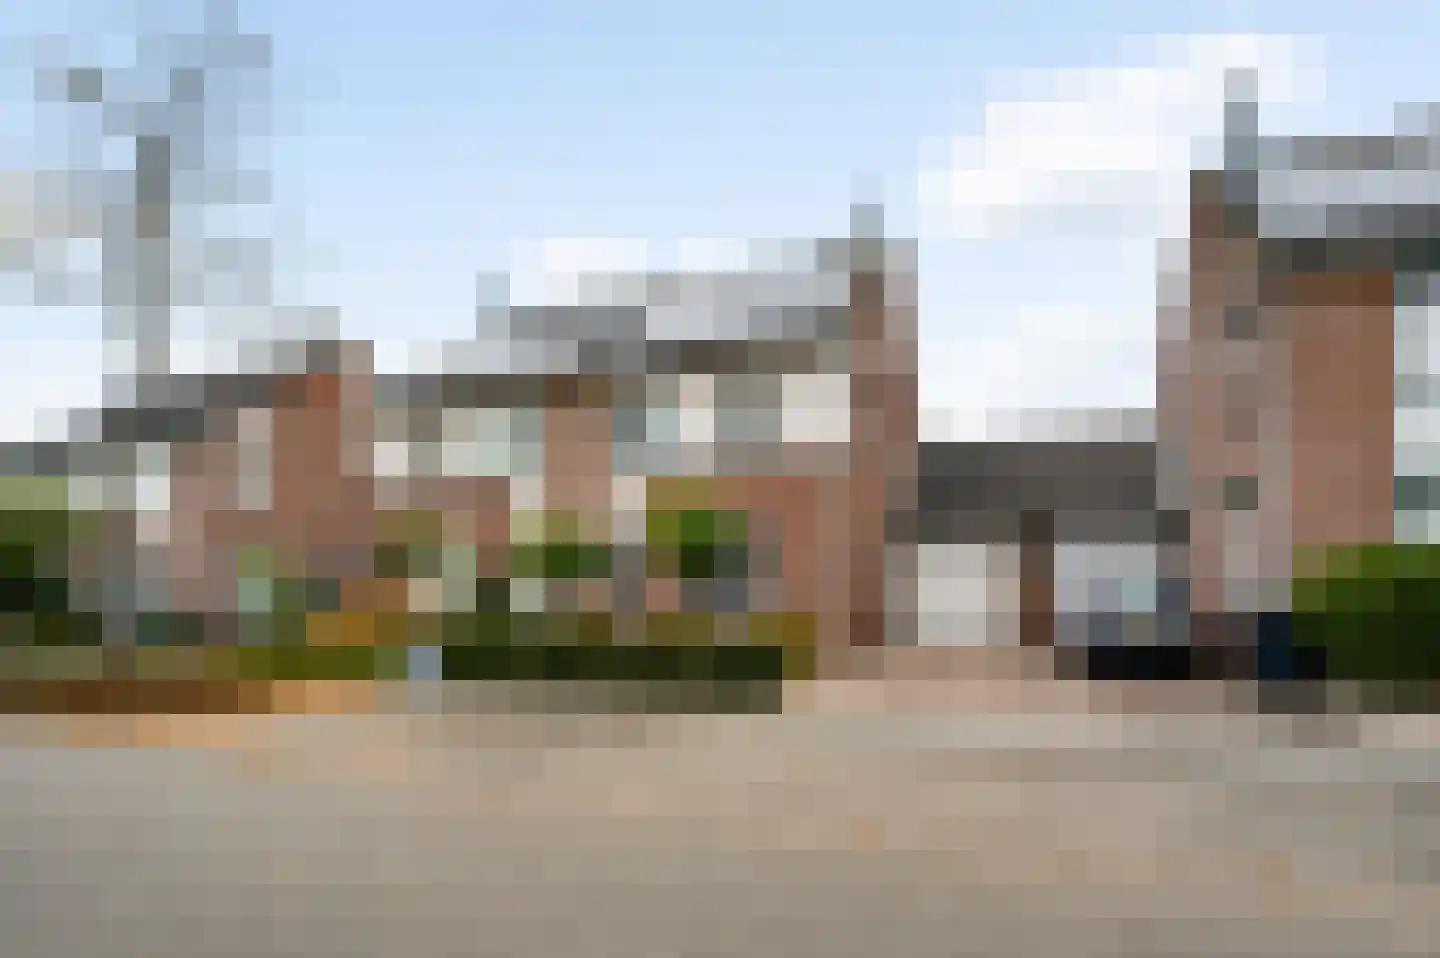
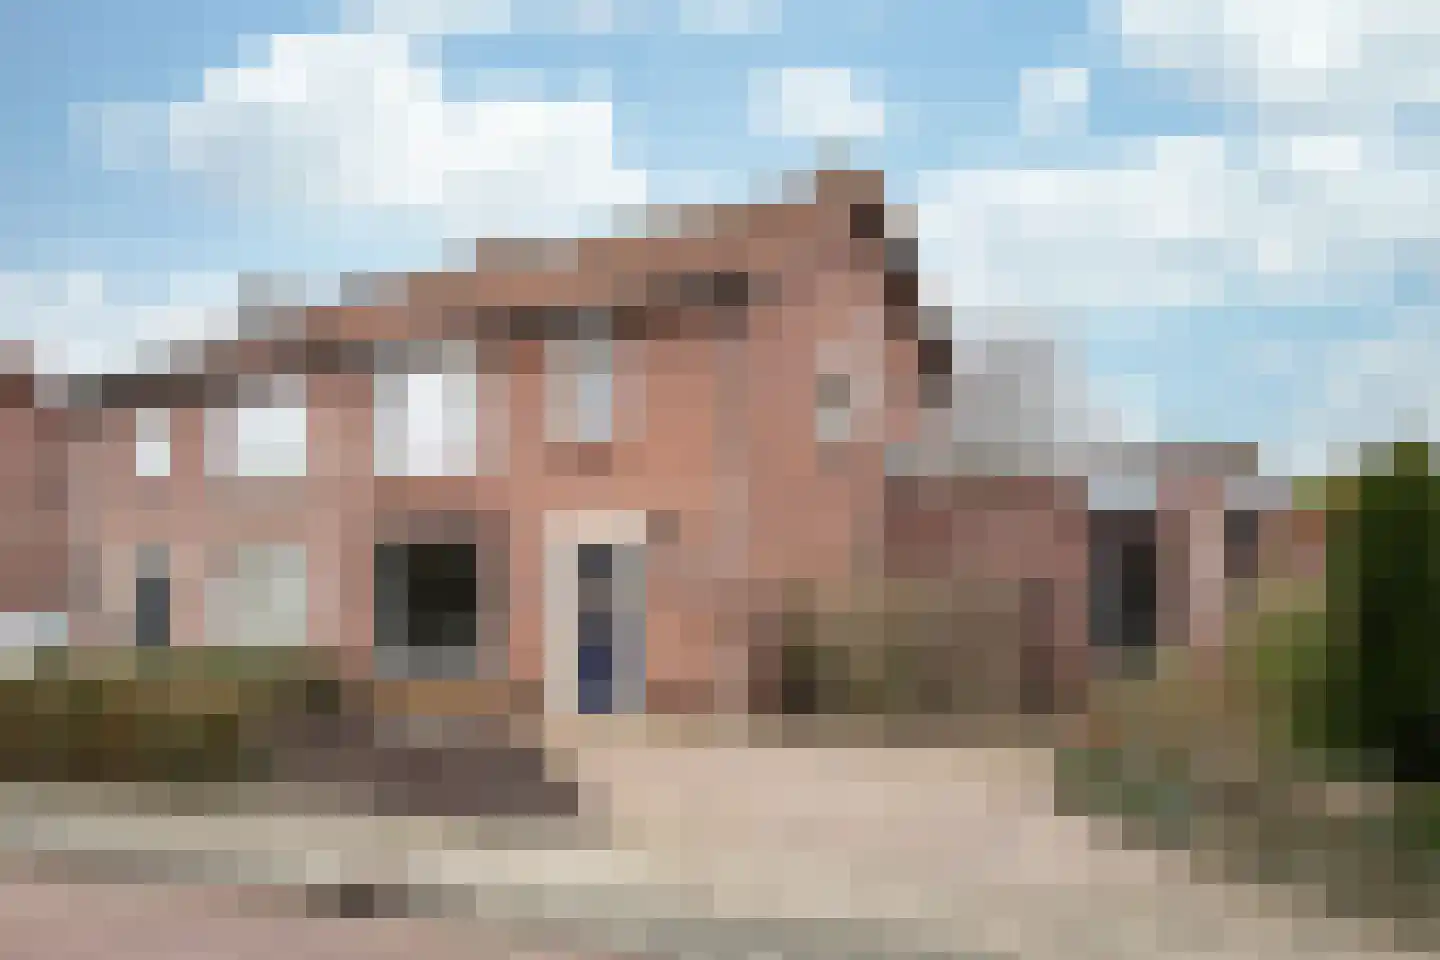
Dokter Leursstraat 11
6041KL Roermond
€ 600.000 k.k.
€ 3.175/m²
- Living area
- 189 m²
- Land area
- 144 m²
- Bedrooms
- 4
View 384 sold houses in Roermond
Type to search. Use arrow down and arrow up to navigate through results and press Enter to open.
Hidden search suggestions.
Compare sold homes in Roermond or view the current offering in this location directly.
On this page you will find recently sold homes in Roermond. Use this overview to better estimate selling prices, popular neighborhoods, and the local housing supply before you choose a real estate agent. Also view the current housing supply with 657 houses in Roermond.
6041KL Roermond
€ 600.000 k.k.
€ 3.175/m²
6042EL Roermond
€ 485.000 k.k.
€ 3.440/m²
6041CD Roermond
€ 440.000 k.k.
€ 1.527/m²
6041RA Roermond
€ 419.000 k.k.
€ 3.036/m²
6041NB Roermond
€ 269.000 k.k.
€ 3.788/m²
6043KE Roermond
€ 265.000 k.k.
€ 3.487/m²
6043WG Roermond
€ 525.000 k.k.
€ 3.832/m²
6041NM Roermond
€ 950.000 k.k.
€ 4.042/m²
6041HS Roermond
€ 200.000 k.k.
€ 4.255/m²
6041GN Roermond
€ 239.000 k.k.
€ 3.103/m²
6041HK Roermond
€ 250.000 k.k.
€ 2.808/m²
6042GP Roermond
€ 525.000
€ 3.977/m²
6042HS Roermond
€ 450.000 k.k.
€ 3.358/m²
6041RG Roermond
€ 450.000 k.k.
€ 3.309/m²
6042HA Roermond
€ 359.000 k.k.
€ 3.452/m²
6041DZ Roermond
€ 359.800 k.k.
€ 3.527/m²
6043HL Roermond
€ 250.000 k.k.
€ 2.155/m²
6042LA Roermond
€ 609.000 k.k.
€ 3.000/m²
6041GH Roermond
€ 295.000 k.k.
€ 3.554/m²
6045EZ Roermond
€ 500.000 k.k.
€ 3.906/m²
6043HN Roermond
€ 395.000 k.k.
€ 2.947/m²
6043XT Roermond
€ 279.000 k.k.
€ 2.762/m²
6042NK Roermond
€ 885.000 k.k.
€ 4.234/m²
6045CM Roermond
€ 259.000 k.k.
€ 4.047/m²
6043XL Roermond
€ 495.000 k.k.
€ 3.093/m²
6045HC Roermond
€ 359.000 k.k.
€ 2.849/m²
6043TV Roermond
€ 245.000 k.k.
€ 1.750/m²
6042GG Roermond
€ 349.000 k.k.
€ 2.664/m²
Bekijk recente verkopen en ontvang gratis offertes van lokale verkoopmakelaars in Roermond.
Recent verkocht in Roermond? Lees de verkoopgerichte gids huis verkopen in Roermond, vergelijk verkoopmakelaars in Roermond of bekijk de beste verkoopmakelaars in Roermond voor referentie bij jouw keuze.
Makelaars maken scherpere voorstellen als ze weten dat je vergelijkt — vraag offertes aan voor verkoop of aankoop.
Short answers about housing prices, sold homes and comparing real estate agents in Roermond.
The costs of a real estate agent in Roermond vary per office, property type and sales approach. Therefore, compare multiple quotes and also look at the real estate agents in Roermond to better compare rates, presentation and local experience.
On this page we currently show 384 sold houses in Roermond from our selection. This helps you to better assess recent transactions and the local housing market.
Houses sold in Roermond give insight into asking prices, house types and neighborhoods where recent transactions have taken place. Compare this also with the current housing stock in Roermond to better understand the market.
Je kunt verkochte woningen gebruiken als eerste marktindicatie, maar een lokale makelaar kan beter rekening houden met afwerking, ligging, onderhoud en actuele vraag in Roermond. Plan de volgende stap via de gids huis verkopen in Roermond.
Vergelijk makelaars in Roermond op lokale verkoopervaring, reviews, verwachte opbrengst, courtage en marketingaanpak. Bekijk verkoopmakelaars in Roermond of de top 10 makelaars in Roermond om snel sterke kantoren te ontdekken.
View current location data on residents, WOZ development, housing stock, energy consumption, business activity and safety in Roermond. In 2026 were there 44.047 residents. The average WOZ value in 2025 is EUR 293.330.
These figures help to better assess and compare the housing stock in Roermond with recent sold homes. Orient yourself then on suitable top real estate agents in Roermond for sales advice in this region.
Residents
44.047
Last year: 2026
Average WOZ
EUR 293.330
Last year: 2025
Average income per person.
EUR 31.106
Source: AllNumbers
Crimes (current year)
3.816
Total registered
| Year | Residents |
|---|---|
| 2021 | 41.990 |
| 2022 | 42.310 |
| 2023 | 42.880 |
| 2024 | 43.480 |
| 2025 | 43.940 |
| 2026 | 44.047 |
| Year | Average WOZ |
|---|---|
| 2021 | EUR 214.372 |
| 2022 | EUR 229.567 |
| 2023 | EUR 272.415 |
| 2024 | EUR 274.188 |
| 2025 | EUR 293.330 |
Hoger
9.760
Praktisch
10.320
Middelbaar
13.220
Europa
7.080
Nederland
26.255
Buiten Europa
10.590
Label C
5.576
Label A
5.559
Label B
3.906
Label D
2.147
Label F
1.707
Label G
1.539
Label E
1.450
Label A+
525
Label A+++
481
Label A++++
318
Label A++
187
Label A+++++
0
| Year | Gas (m3) | Electricity (kWh) |
|---|---|---|
| 2020 | 1.134 | 2.644 |
| 2021 | 1.282 | 2.655 |
| 2022 | 985 | 2.526 |
| 2023 | 829 | 2.415 |
| 2024 | 809 | 2.472 |
Hoekwoning
Gas: 1.007 • Electricity: 2.808
Huurwoning
Gas: 694 • Electricity: 1.981
Koopwoning
Gas: 987 • Electricity: 2.878
Appartement
Gas: 617 • Electricity: 1.807
Tussenwoning
Gas: 882 • Electricity: 2.580
Vrijstaande woning
Gas: 1.386 • Electricity: 3.864
Twee-onder-één-kap woning
Gas: 1.139 • Electricity: 2.984
Total number of company establishments: 5.765
| Period | Crimes |
|---|---|
| jan 2026 | 274 |
| jul 2025 | 309 |
| jun 2025 | 317 |
| mei 2025 | 326 |
| mrt 2025 | 312 |
| mrt 2026 | 264 |
| nov 2024 | 304 |
| nov 2025 | 293 |
| okt 2024 | 384 |
| okt 2025 | 292 |
| sep 2024 | 305 |
| sep 2025 | 273 |
These figures give an indicative picture of safety trends in the living environment of Roermond.
Short answers based on current local statistics, handy for a quick comparison of the living environment.
Roermond telt in 2026 ongeveer 44.047 inwoners.
De gemiddelde WOZ-waarde in Roermond is in 2025 circa € 293.330.
Het gemiddelde inkomen per inwoner in Roermond ligt rond € 31.106 per jaar.
Voor het huidige jaar gaat het om ongeveer 3.816 geregistreerde misdrijven. Gebruik deze cijfers als indicatie en vergelijk trends per periode.
In Roermond komt vooral "Appartementen" veel voor, met ongeveer 9.683 woningen.