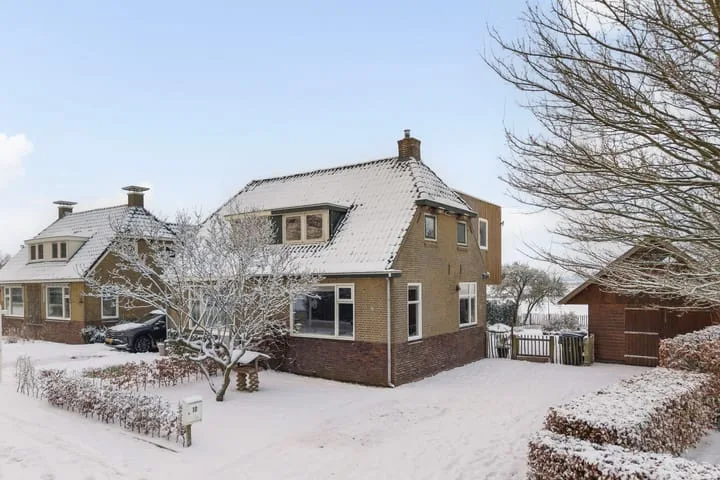
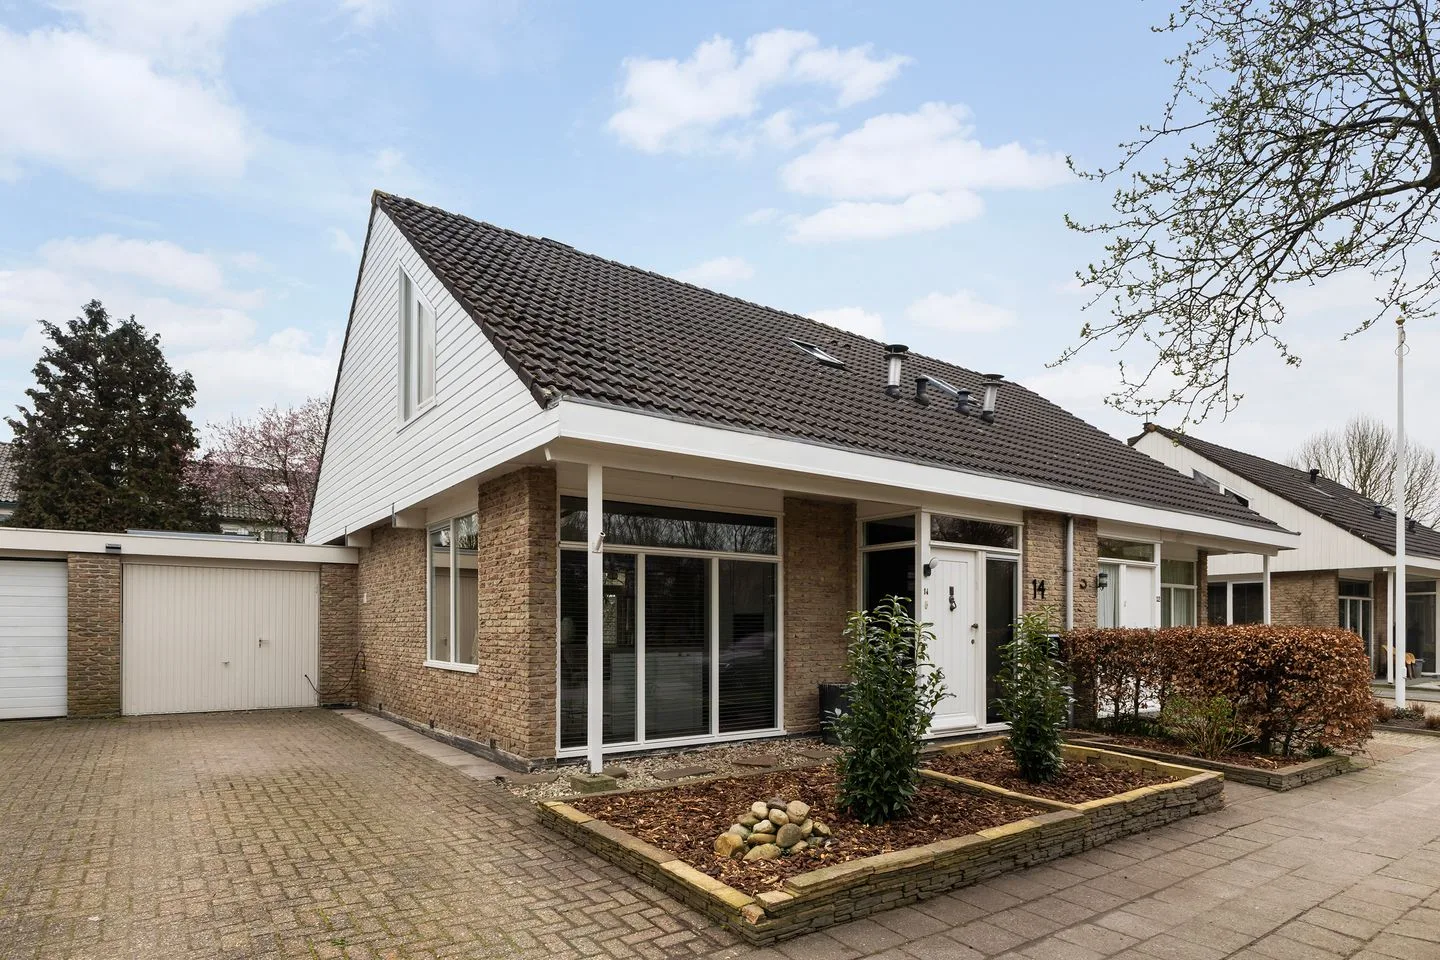
Houses sold in Tytsjerk

View 16 sold houses in Tytsjerk

Connected to: Vastgoed Nederland NVM Makelaars

On this page you will find recently sold homes in Tytsjerk. Use this overview to better estimate selling prices, popular neighborhoods, and the local housing supply before you choose a real estate agent. Also view the current housing supply with 20 houses in Tytsjerk.

Selection

Search and filter homes

Set your preferences and discover homes that suit you.

Total supply 241.443
Filters

Set price, area and other characteristics. Adjust a filter or click on Show homes. Location changes directly above.

Reset filters

You search for

  • Place Tytsjerk
  • Status Sold

Huis verkopen in Tytsjerk? Vergelijk verkoopmakelaars

Bekijk recente verkopen en ontvang gratis offertes van lokale verkoopmakelaars in Tytsjerk.

Free request a quote

  • Quotes in Tytsjerk
  • Non-binding
  • Personal
  • Gratis tarieven vergelijken

Zelf je woning verkopen in Tytsjerk? Vergelijk verkoopmakelaars in Tytsjerk of bekijk de beste verkoopmakelaars in Tytsjerk als referentie bij jouw keuze.

Vergelijk meerdere offertes

Makelaars maken scherpere voorstellen als ze weten dat je vergelijkt — vraag offertes aan voor verkoop of aankoop.

Frequently asked questions about sold homes in Tytsjerk

Short answers about housing prices, sold homes and comparing real estate agents in Tytsjerk.

Residential and neighborhood statistics in Tytsjerk

View current location data on residents, WOZ development, housing stock, energy consumption, business activity and safety in Tytsjerk. In 2025 were there 1.605 residents. The average WOZ value in 2025 is EUR 335.052.

These figures help to better assess and compare the housing stock in Tytsjerk with recent sold homes. Orient yourself then on suitable top real estate agents in Tytsjerk for sales advice in this region.

Residents

1.605

Last year: 2025

Average WOZ

EUR 335.052

Last year: 2025

Average income per person.

EUR 30.980

Source: AllNumbers

Crimes (current year)

24

Total registered

Demographics and WOZ development

Inhabitants per year

Inhabitants per year in Tytsjerk
Year Residents
2021 1.610
2022 1.605
2023 1.610
2024 1.610
2025 1.605

Annual WOZ value

WOZ value per year in Tytsjerk
Year Average WOZ
2021 EUR 239.551
2022 EUR 265.750
2023 EUR 301.200
2024 EUR 315.607
2025 EUR 335.052

Composition of residents

Age build-up

65+: 410 0-15: 275 15-25: 180 25-45: 335 45-65: 420

Education level

Hoger

310

Praktisch

220

Middelbaar

460

Origin of residents (2025)

Europa

55

Nederland

1.485

Buiten Europa

65

Housing stock and construction periods

Types of homes

Hoekwoningen 92
Appartementen 13
Tussenwoningen 152
Vrijstaande woningen 295
Twee-onder-één-kap woningen 136

Construction period of buildings

Voor 1700 0
1700 tot 1900 38
1900 tot 1925 45
1925 tot 1950 97
1950 tot 1970 209
1970 tot 1980 221
1980 tot 1990 14
1990 tot 2000 64
2000 tot 2010 9
2010 tot 2020 39
2020 en later 3

Energy and sustainability

Energy label distribution

Label C

163

Label D

136

Label G

115

Label F

85

Label A

82

Label B

76

Label E

21

Label A++

2

Label A+

1

Label A+++

1

Label A++++

1

Label A+++++

0

Average energy consumption per year

Average energy consumption per year in Tytsjerk
Year Gas (m3) Electricity (kWh)
2020 1.545 2.982
2021 1.722 3.042
2022 1.347 2.829
2023 1.105 2.727
2024 1.053 2.872

Consumption per house type

Hoekwoning

Gas: 840 • Electricity: 1.990

Huurwoning

Gas: 862 • Electricity: 1.562

Koopwoning

Gas: 1.138 • Electricity: 2.873

Appartement

Gas: 99 • Electricity: 239

Tussenwoning

Gas: 752 • Electricity: 1.769

Vrijstaande woning

Gas: 1.317 • Electricity: 3.337

Twee-onder-één-kap woning

Gas: 902 • Electricity: 2.202

Business activity in Tytsjerk (2025)

Handel en HORECA 25
Nijverheid en energie 30
Zakelijke dienstverlening 50
Overheid, onderwijs en zorg 35
Landbouw, bosbouw en visserij 20
Vervoer, informatie en communicatie 5
Financiele diensten en onroerendgoed 5
Cultuur, recreatie en overige diensten 15

Total number of company establishments: 195

Recent crime statistics

Recent crime statistics in Tytsjerk
Period Crimes
jan 2025 2
jan 2026 1
jul 2025 1
jun 2025 0
mei 2025 4
mrt 2025 5
nov 2024 2
nov 2025 3
okt 2024 0
okt 2025 1
sep 2024 6
sep 2025 0

These figures give an indicative picture of safety trends in the living environment of Tytsjerk.

Frequently asked questions about living in Tytsjerk

Short answers based on current local statistics, handy for a quick comparison of the living environment.

Hoeveel inwoners heeft Tytsjerk?

Tytsjerk telt in 2025 ongeveer 1.605 inwoners.

Wat is de gemiddelde WOZ-waarde in Tytsjerk?

De gemiddelde WOZ-waarde in Tytsjerk is in 2025 circa € 335.052.

Wat is het gemiddelde inkomen per inwoner in Tytsjerk?

Het gemiddelde inkomen per inwoner in Tytsjerk ligt rond € 30.980 per jaar.

Hoe veilig is wonen in Tytsjerk?

Voor het huidige jaar gaat het om ongeveer 24 geregistreerde misdrijven. Gebruik deze cijfers als indicatie en vergelijk trends per periode.

Welke woningtypen komen het meest voor in Tytsjerk?

In Tytsjerk komt vooral "Vrijstaande woningen" veel voor, met ongeveer 295 woningen.

Gratis vrijblijvende offertes ontvangen

Vergelijk meerdere makelaars en kies de beste match.