- Sold
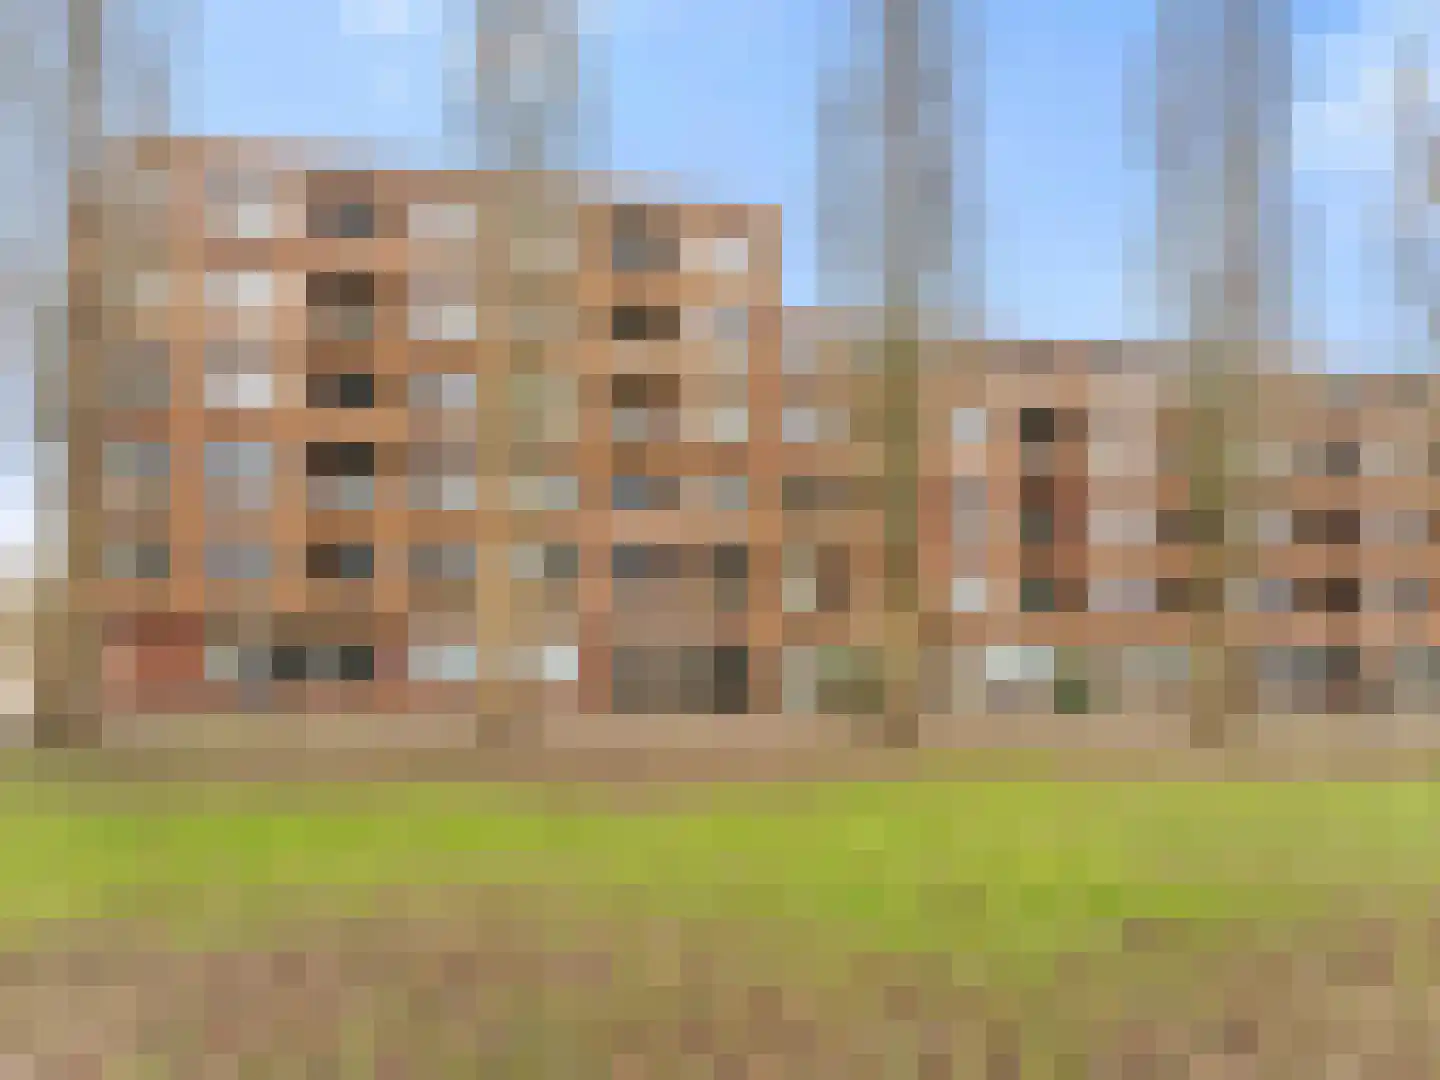
Tesselschadestraat 6 BS
3521XV Utrecht
€ 645.000 k.k.
€ 6.262/m²
- Living area
- 103 m²
- Land area
- —
- Bedrooms
- 4
Found: 5.088 houses in Utrecht within your selection
Type to search. Use arrow down and arrow up to navigate through results and press Enter to open.
Hidden search suggestions.
Refine your selection in Utrecht or reset the filters for the full housing stock.
View the current housing stock in Utrecht and quickly filter by price, living area, rooms and more. There are currently 5.088 houses in this place within our selection. View also 3.928 sold houses in Utrecht for extra insight into the local housing market.
3521XV Utrecht
€ 645.000 k.k.
€ 6.262/m²
3552CT Utrecht
€ 685.000 k.k.
€ 5.150/m²
3524AT Utrecht
€ 399.000 k.k.
€ 3.627/m²
3544MN Utrecht
€ 745.000 k.k.
€ 5.068/m²
3572ST Utrecht
€ 450.000 k.k.
€ 6.521/m²
3522AV Utrecht
€ 625.000 k.k.
€ 6.009/m²
3551DK Utrecht
€ 465.000 k.k.
€ 5.961/m²
3572AS Utrecht
€ 375.000 k.k.
€ 5.769/m²
3564KD Utrecht
€ 325.000 k.k.
€ 4.710/m²
3523CN Utrecht
€ 295.000 k.k.
€ 7.972/m²
3562XS Utrecht
€ 395.000 k.k.
€ 4.540/m²
3514XX Utrecht
€ 679.000 k.k.
€ 7.715/m²
3522DE Utrecht
€ 549.000 k.k.
€ 6.032/m²
3531AL Utrecht
€ 500.000 k.k.
€ 7.352/m²
3555CL Utrecht
€ 425.000 k.k.
€ 6.967/m²
3582SJ Utrecht
€ 345.000 k.k.
€ 6.634/m²
3525AN Utrecht
€ 589.000 k.k.
€ 5.831/m²
3582SJ Utrecht
€ 499.000 k.k.
€ 4.940/m²
3514XB Utrecht
€ 650.000 k.k.
€ 7.065/m²
3564BX Utrecht
€ 400.000 k.k.
€ 4.819/m²
3571PE Utrecht
€ 255.000 k.k.
€ 5.425/m²
3522RB Utrecht
€ 525.000 k.k.
€ 6.646/m²
3551SW Utrecht
€ 495.000 k.k.
€ 7.173/m²
3551DK Utrecht
€ 469.000 k.k.
€ 5.937/m²
3555CW Utrecht
€ 275.000 k.k.
€ 8.088/m²
3584AD Utrecht
€ 995.000 k.k.
€ 6.910/m²
3531EZ Utrecht
€ 515.000 k.k.
€ 6.776/m²
3543GE Utrecht
€ 498.000 k.k.
€ 5.859/m²
Get free quotes from realtors with local market knowledge in Utrecht.
Selling a home in Utrecht? Compare real estate agents who know the local housing market. Also check out all real estate agents in Utrecht or the top 10 real estate agents in Utrecht for extra context for your choice.
By comparing brokers and requesting quotes
Practical answers about housing supply, sales and comparing real estate agents in Utrecht.
The costs of a real estate agent in Utrecht depend on commission, start-up costs, property presentation and the chosen service. View the real estate agents in Utrecht and request multiple quotes to compare rates and approach properly.
Within our selection, we are currently showing 5.088 houses in Utrecht. View also the sold houses in Utrecht to compare the current offering with recent transactions.
Let naast prijs en woonoppervlakte ook op onderhoud, energielabel, ligging, buitenruimte en de verkoopstatus. Zo vergelijk je woningen in Utrecht op meer dan alleen de vraagprijs.
A local real estate agent knows the neighborhoods, recent transactions and demand in Utrecht. By comparing agents you get a better insight into fees, sales strategy and expected yield; the top 10 in Utrecht gives a handy starting point.
Yes, when making a sales plan, a valuation in Utrecht is wise. You gain insight into a realistic asking price and can then compare offers from real estate agents specifically.
View current location data on residents, WOZ development, housing stock, energy consumption, business activity and safety in Utrecht. In 2025 were there 325.510 residents. The average WOZ value in 2025 is EUR 474.416.
These figures help to better assess and compare the housing stock in Utrecht with recent sold homes. Orient yourself then on suitable top real estate agents in Utrecht for sales advice in this region.
Residents
325.510
Last year: 2025
Average WOZ
EUR 474.416
Last year: 2025
Average income per person.
EUR 38.255
Source: AllNumbers
Crimes (current year)
25.985
Total registered
| Year | Residents |
|---|---|
| 2021 | 308.685 |
| 2022 | 310.610 |
| 2023 | 316.460 |
| 2024 | 323.020 |
| 2025 | 325.510 |
| Year | Average WOZ |
|---|---|
| 2021 | EUR 349.277 |
| 2022 | EUR 381.193 |
| 2023 | EUR 442.579 |
| 2024 | EUR 435.454 |
| 2025 | EUR 474.416 |
Hoger
148.860
Praktisch
45.840
Middelbaar
67.680
Europa
37.515
Nederland
186.915
Buiten Europa
101.045
Label A
47.799
Label C
25.699
Label B
17.523
Label D
13.066
Label F
12.655
Label G
11.728
Label E
11.306
Label A+
9.677
Label A++
5.013
Label A+++
4.232
Label A++++
725
Label A+++++
21
| Year | Gas (m3) | Electricity (kWh) |
|---|---|---|
| 2020 | 664 | 2.253 |
| 2021 | 740 | 2.328 |
| 2022 | 572 | 2.170 |
| 2023 | 484 | 2.028 |
| 2024 | 468 | 2.042 |
Hoekwoning
Gas: 791 • Electricity: 2.601
Huurwoning
Gas: 421 • Electricity: 1.821
Koopwoning
Gas: 587 • Electricity: 2.316
Appartement
Gas: 368 • Electricity: 1.760
Tussenwoning
Gas: 700 • Electricity: 2.361
Vrijstaande woning
Gas: 1.325 • Electricity: 3.953
Twee-onder-één-kap woning
Gas: 898 • Electricity: 3.142
Total number of company establishments: 55.750
| Period | Crimes |
|---|---|
| jan 2025 | 1.938 |
| jan 2026 | 2.042 |
| jul 2025 | 2.284 |
| jun 2025 | 2.296 |
| mei 2025 | 2.085 |
| mrt 2025 | 2.095 |
| nov 2024 | 2.183 |
| nov 2025 | 2.313 |
| okt 2024 | 2.124 |
| okt 2025 | 2.340 |
| sep 2024 | 1.881 |
| sep 2025 | 2.221 |
These figures give an indicative picture of safety trends in the living environment of Utrecht.
Short answers based on current local statistics, handy for a quick comparison of the living environment.
Utrecht telt in 2025 ongeveer 325.510 inwoners.
De gemiddelde WOZ-waarde in Utrecht is in 2025 circa € 474.416.
Het gemiddelde inkomen per inwoner in Utrecht ligt rond € 38.255 per jaar.
Voor het huidige jaar gaat het om ongeveer 25.985 geregistreerde misdrijven. Gebruik deze cijfers als indicatie en vergelijk trends per periode.
In Utrecht komt vooral "Appartementen" veel voor, met ongeveer 108.137 woningen.