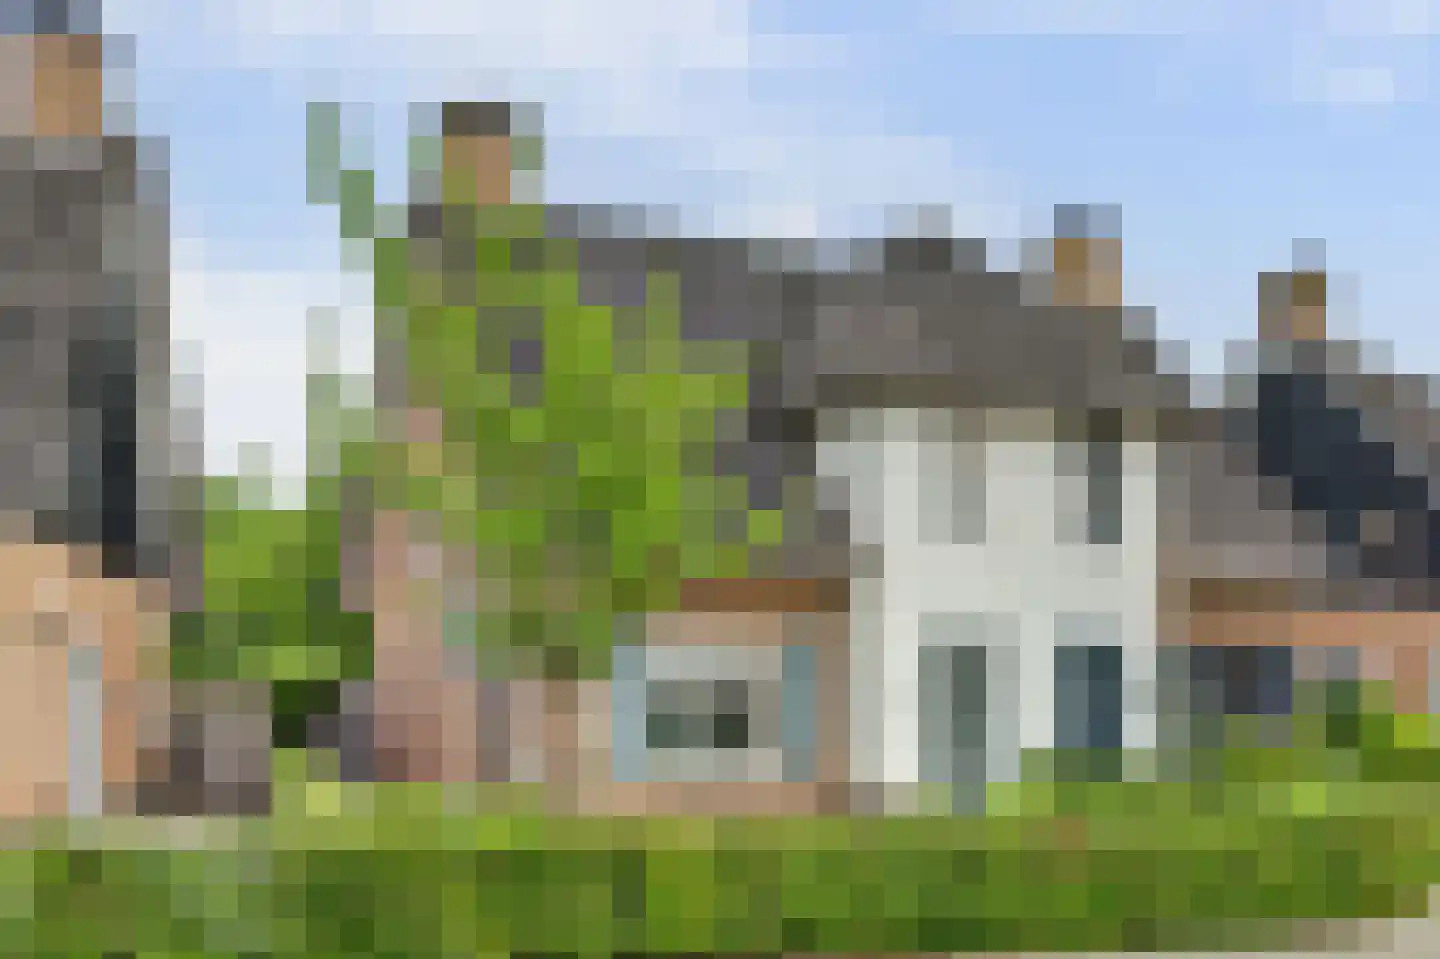
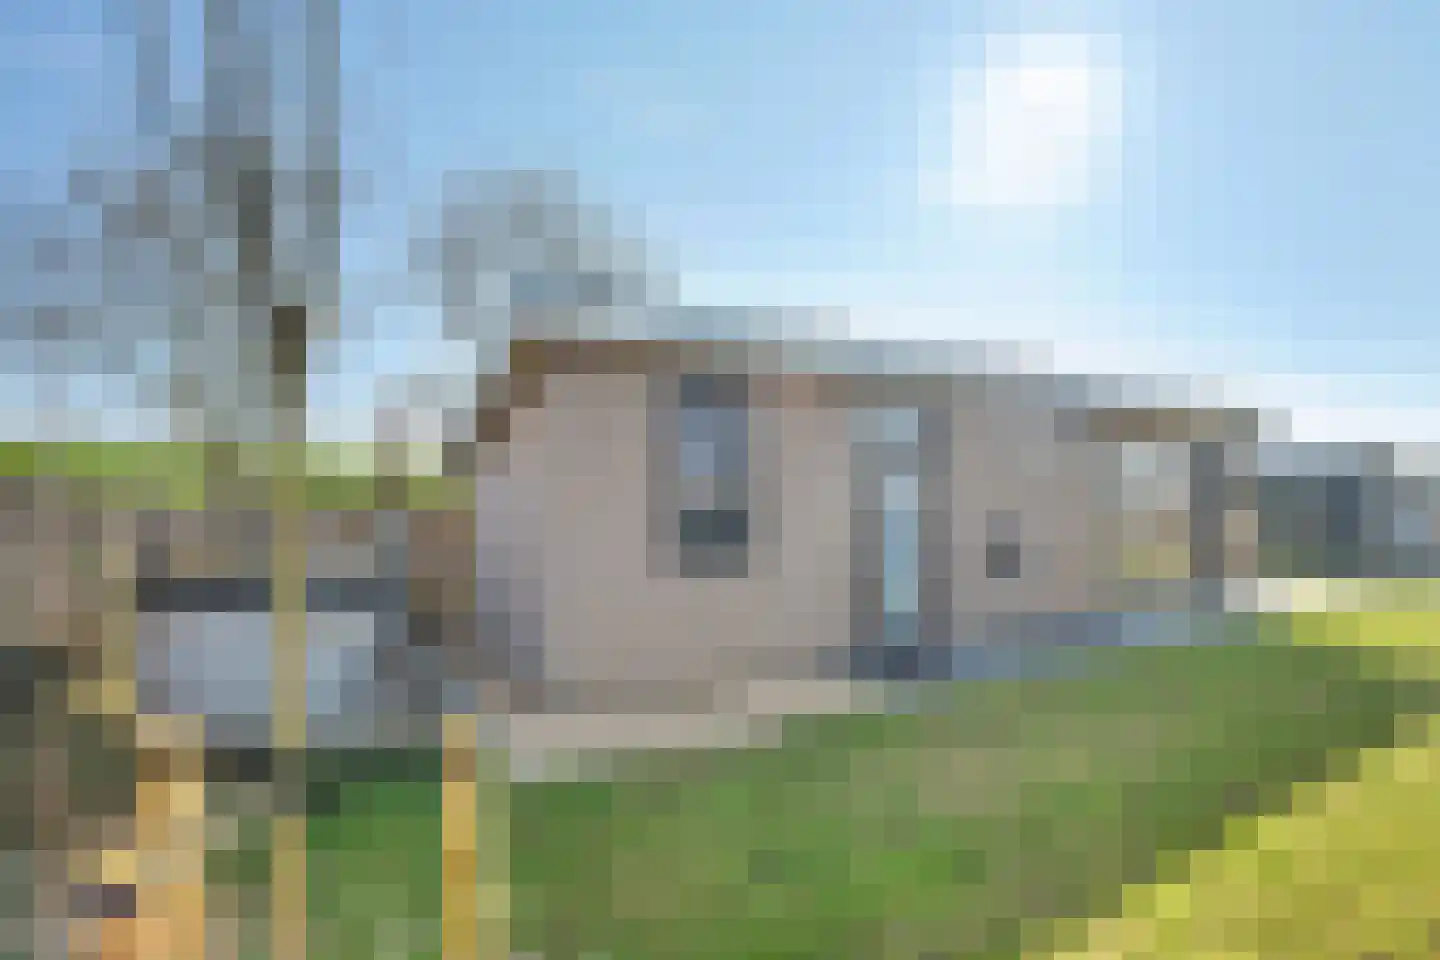
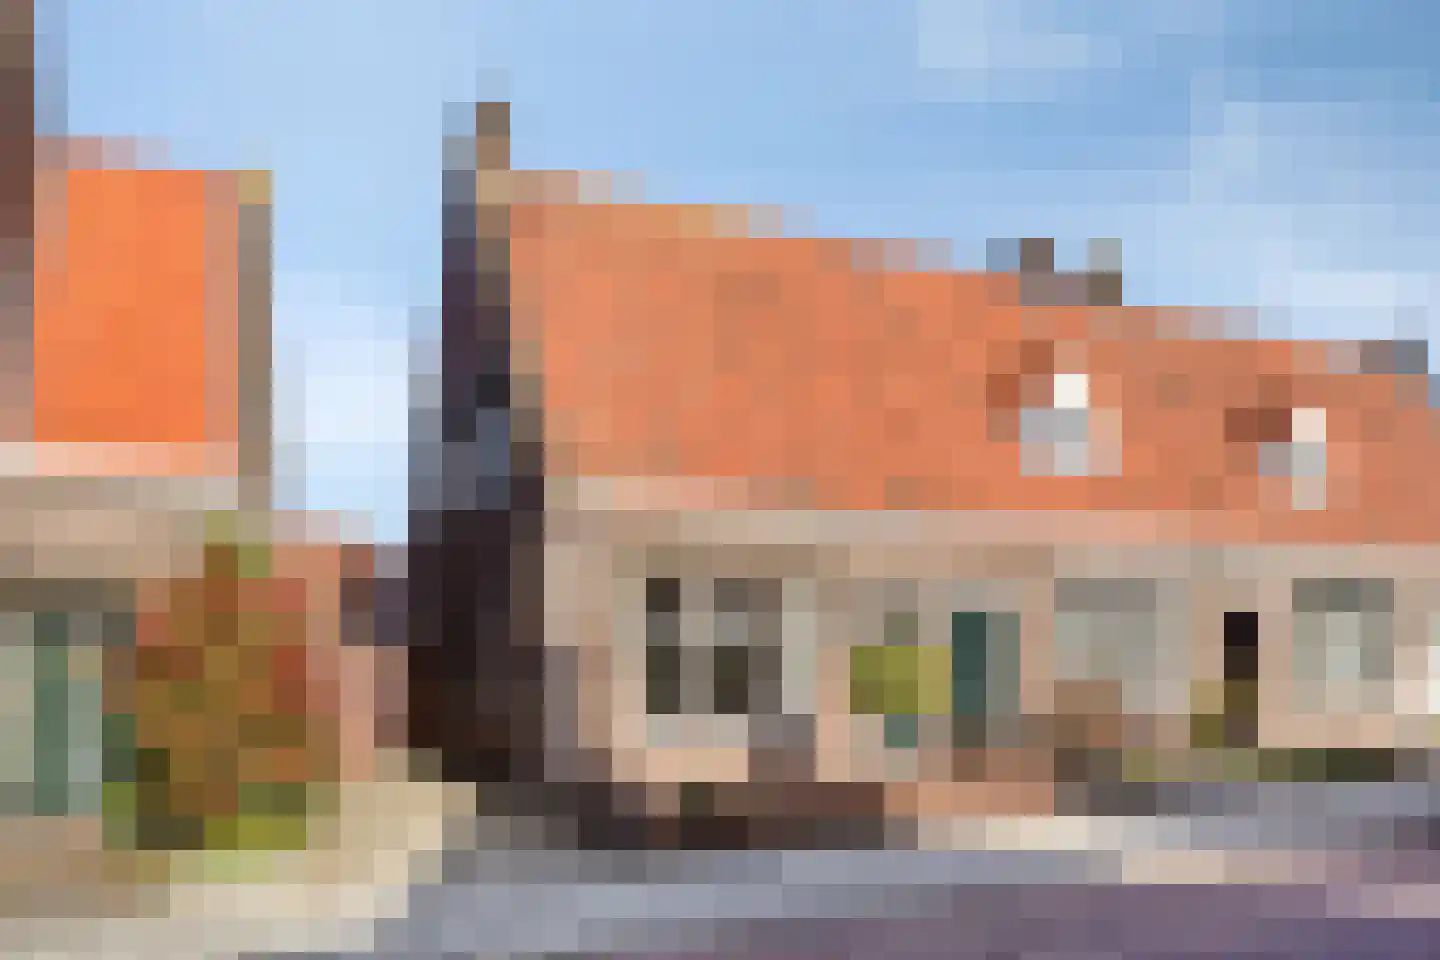
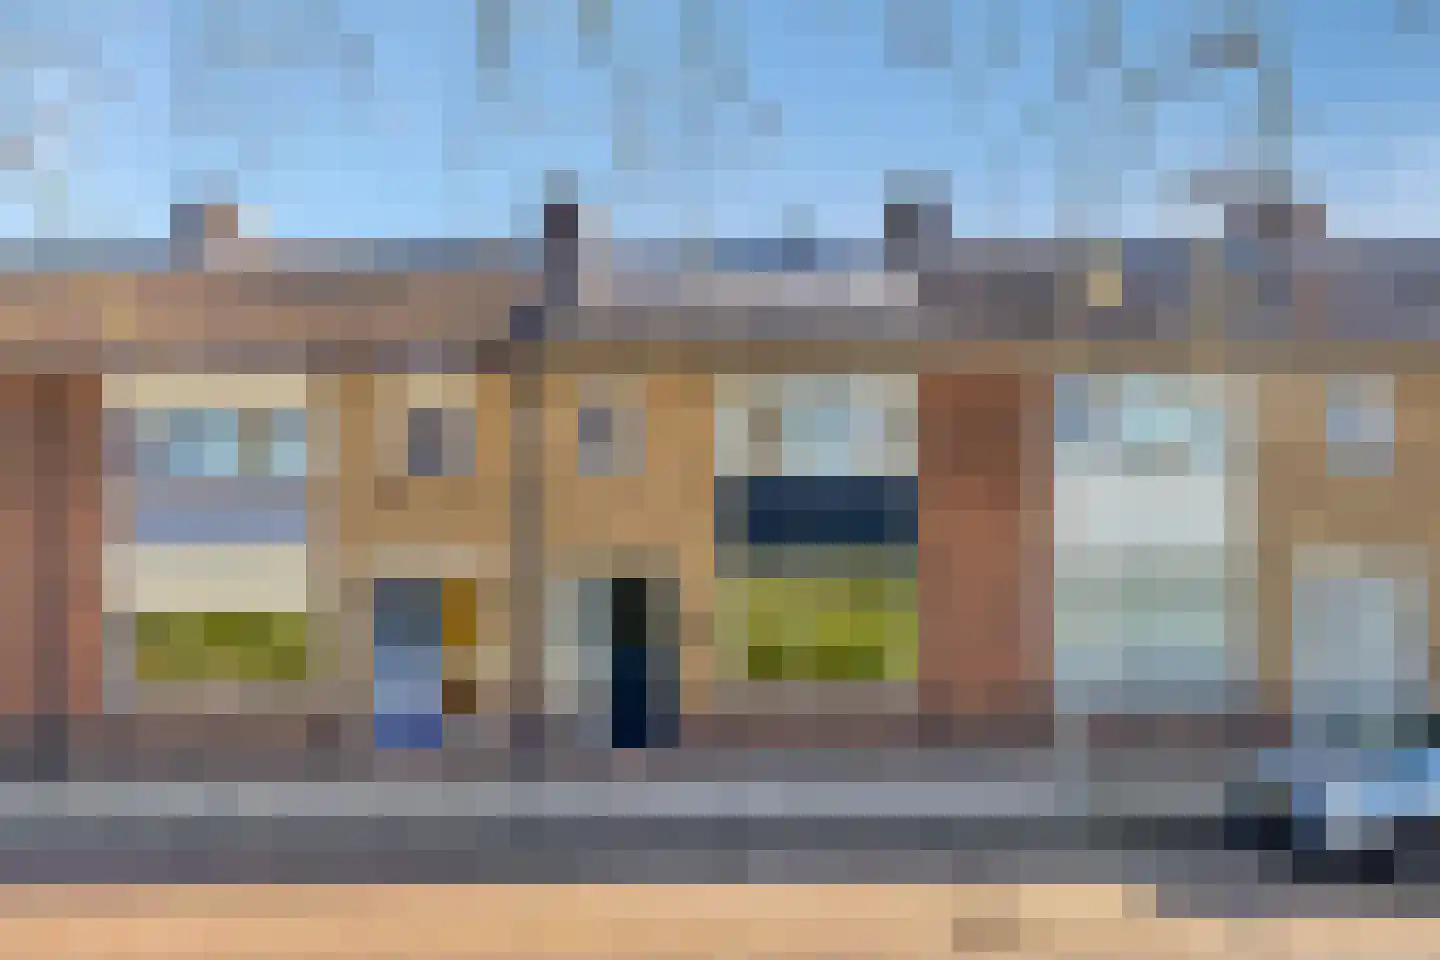
- Available
Irenestraat 4
4401EN Yerseke
€ 255.000 k.k.
€ 2.742/m²
- Living area
- 93 m²
- Land area
- 146 m²
- Bedrooms
- 3
Searching in 78 houses in Yerseke
Type to search. Use arrow down and arrow up to navigate through results and press Enter to open.
Hidden search suggestions.
View current properties in Yerseke or search targeted on street, postal code and property characteristics.
View the current housing stock in Yerseke and quickly filter by price, living area, rooms and more. There are currently 78 houses in this place within our selection. View also 59 sold houses in Yerseke for extra insight into the local housing market.
4401EN Yerseke
€ 255.000 k.k.
€ 2.742/m²
4401BN Yerseke
€ 549.000 k.k.
€ 4.256/m²
4401AL Yerseke
€ 575.000 k.k.
€ 4.492/m²
4401EA Yerseke
€ 395.000 k.k.
4401JS Yerseke
€ 765.000 k.k.
4401KX Yerseke
€ 229.500 k.k.
4401KX Yerseke
€ 299.000 k.k.
€ 7.292/m²
4401KD Yerseke
€ 356.000 k.k.
€ 3.747/m²
4401EJ Yerseke
€ 275.000 k.k.
€ 3.395/m²
4401BP Yerseke
€ 325.000 k.k.
€ 2.355/m²
4401NN Yerseke
€ 750.000 k.k.
€ 4.808/m²
4401GJ Yerseke
€ 645.000 k.k.
€ 2.601/m²
4401BB Yerseke
€ 185.000 k.k.
€ 2.056/m²
4401KE Yerseke
€ 283.000 k.k.
€ 3.076/m²
4401AA Yerseke
€ 925.000 k.k.
€ 2.312/m²
4401KK Yerseke
€ 245.000 k.k.
€ 3.551/m²
4401GV Yerseke
€ 369.000 k.k.
€ 3.618/m²
4401EN Yerseke
€ 225.000 k.k.
€ 2.961/m²
4401HJ Yerseke
€ 749.500 k.k.
€ 4.051/m²
4401SG Yerseke
€ 345.000 k.k.
€ 3.833/m²
4401NC Yerseke
€ 705.000 k.k.
€ 4.796/m²
4401CE Yerseke
€ 275.000 k.k.
€ 1.978/m²
4401KC Yerseke
€ 279.000 k.k.
€ 3.361/m²
4401ET Yerseke
€ 249.500 k.k.
€ 3.158/m²
4401BP Yerseke
€ 300.000 k.k.
€ 2.885/m²
4401EV Yerseke
€ 224.000 k.k.
€ 3.733/m²
4401JS Yerseke
€ 462.000 k.k.
€ 4.017/m²
4401CJ Yerseke
€ 239.000 k.k.
€ 2.747/m²
Get free quotes from real estate agents with local market knowledge. Compare more than 24 real estate agents in Yerseke.
Selling a home in Yerseke? View the sales-oriented guide sell a house in Yerseke, compare all real estate agents in Yerseke or view the top 10 real estate agents in Yerseke for extra context to your choice.
Real estate agents make sharper offers when they know you're comparing — ask for quotes for sale or purchase.
Practical answers about housing supply, sales and comparing real estate agents in Yerseke.
The costs of a real estate agent in Yerseke depend on commission, setup costs, property presentation and the chosen service. Compare the 24 real estate agents in Yerseke via the real estate agent page and request multiple quotes to compare rates and approach well.
Within our selection, we are currently showing 78 houses in Yerseke. View also the sold houses in Yerseke to compare the current offering with recent transactions.
Take into account not only price and living area but also maintenance, energy label, location, outdoor space and sales status. This way you compare houses in Yerseke on more than just the asking price.
A local real estate agent knows the neighborhoods, recent transactions and demand in Yerseke. By comparing 24 real estate agents in the region you get a better insight into prices, sales strategy and expected yield; the top 10 in Yerseke provides a useful starting point.
Yes, when making a sales plan, a valuation in Yerseke is wise. You gain insight into a realistic asking price and can then compare offers from real estate agents specifically.
View current location data on residents, WOZ development, housing stock, energy consumption, business activity and safety in Yerseke. In 2025 were there 7.165 residents. The average WOZ value in 2025 is EUR 317.000.
These figures help to better assess and compare the housing stock in Yerseke with recent sold homes. Orient yourself then on suitable top real estate agents in Yerseke for sales advice in this region.
Residents
7.165
Last year: 2025
Average WOZ
EUR 317.000
Last year: 2025
Average income per person.
EUR 31.800
Source: AllNumbers
Crimes (current year)
115
Total registered
| Year | Residents |
|---|---|
| 2021 | 7.015 |
| 2022 | 7.005 |
| 2023 | 7.140 |
| 2024 | 7.140 |
| 2025 | 7.165 |
| Year | Average WOZ |
|---|---|
| 2021 | EUR 233.000 |
| 2022 | EUR 247.000 |
| 2023 | EUR 285.000 |
| 2024 | EUR 305.000 |
| 2025 | EUR 317.000 |
Hoger
690
Praktisch
1.810
Middelbaar
2.720
Europa
830
Nederland
5.900
Buiten Europa
435
Label C
717
Label A
688
Label B
469
Label G
403
Label D
326
Label F
266
Label E
203
Label A+
44
Label A+++
44
Label A++++
36
Label A++
10
Label A+++++
0
| Year | Gas (m3) | Electricity (kWh) |
|---|---|---|
| 2020 | 1.250 | 2.780 |
| 2021 | 1.420 | 2.950 |
| 2022 | 1.120 | 2.810 |
| 2023 | 940 | 2.650 |
| 2024 | 920 | 2.690 |
Hoekwoning
Gas: 940 • Electricity: 2.410
Huurwoning
Gas: 780 • Electricity: 2.020
Koopwoning
Gas: 1.010 • Electricity: 2.940
Appartement
Gas: 570 • Electricity: 1.880
Tussenwoning
Gas: 830 • Electricity: 2.240
Vrijstaande woning
Gas: 1.210 • Electricity: 3.760
Twee-onder-één-kap woning
Gas: 1.030 • Electricity: 2.680
Total number of company establishments: 1.055
| Period | Crimes |
|---|---|
| jan 2026 | 8 |
| jul 2025 | 7 |
| jun 2025 | 12 |
| mei 2025 | 6 |
| mrt 2025 | 7 |
| mrt 2026 | 19 |
| nov 2024 | 16 |
| nov 2025 | 9 |
| okt 2024 | 12 |
| okt 2025 | 11 |
| sep 2024 | 10 |
| sep 2025 | 13 |
These figures give an indicative picture of safety trends in the living environment of Yerseke.
Short answers based on current local statistics, handy for a quick comparison of the living environment.
Yerseke telt in 2025 ongeveer 7.165 inwoners.
De gemiddelde WOZ-waarde in Yerseke is in 2025 circa € 317.000.
Het gemiddelde inkomen per inwoner in Yerseke ligt rond € 31.800 per jaar.
Voor het huidige jaar gaat het om ongeveer 115 geregistreerde misdrijven. Gebruik deze cijfers als indicatie en vergelijk trends per periode.
In Yerseke komt vooral "Tussenwoningen" veel voor, met ongeveer 761 woningen.