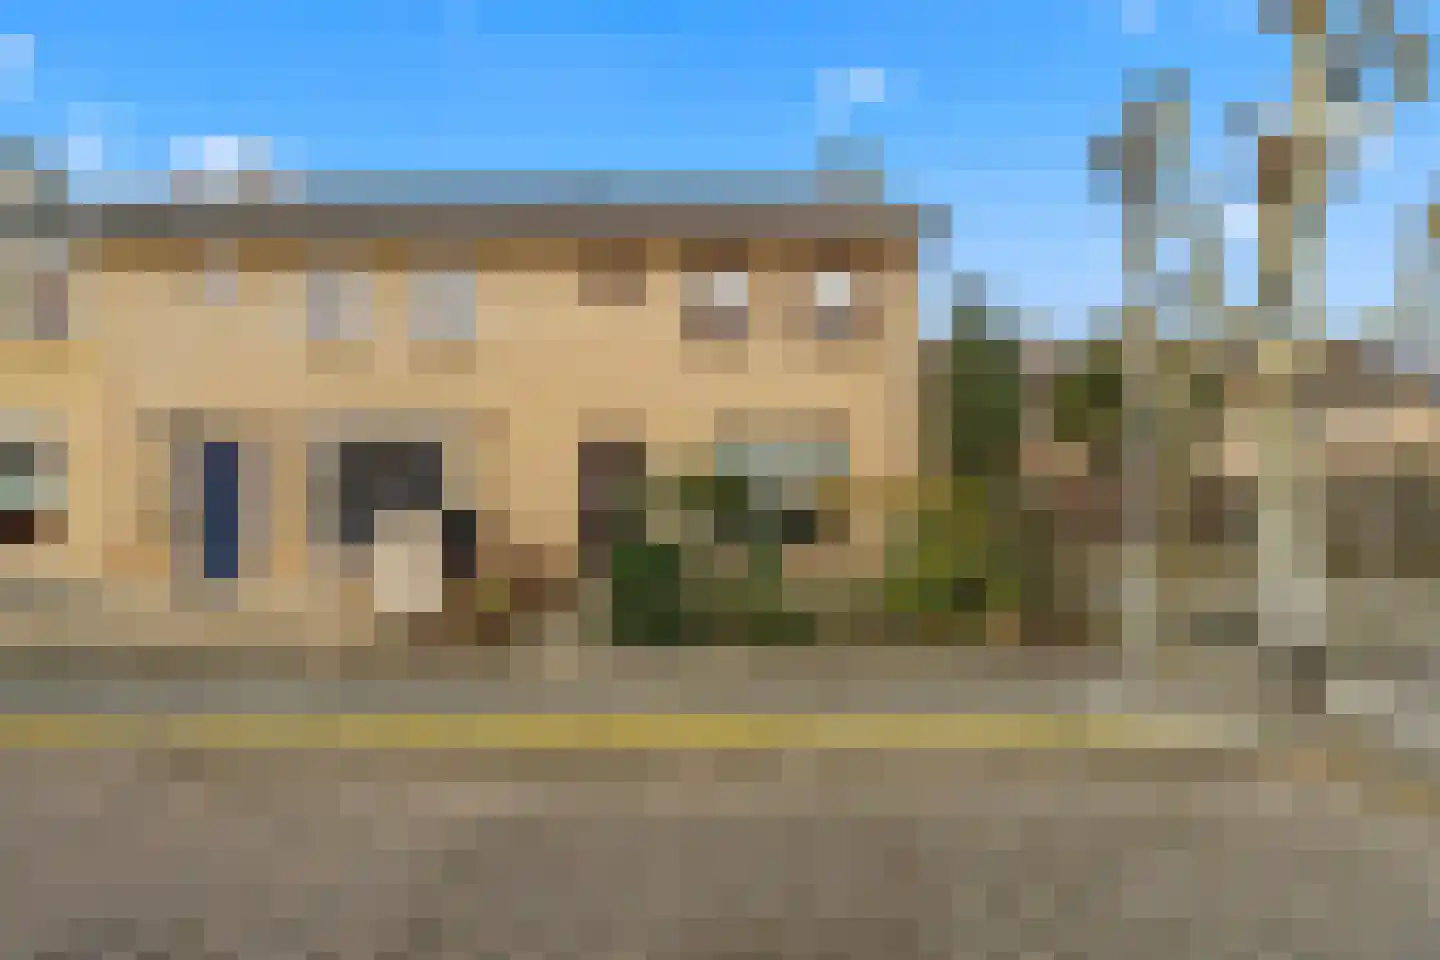
Houses sold in Zijderveld

View 9 sold houses in Zijderveld

Connected to: Vastgoed Nederland NVM Makelaars

On this page you will find recently sold homes in Zijderveld. Use this overview to better estimate selling prices, popular neighborhoods, and the local housing supply before you choose a real estate agent. Also view the current housing supply with 10 houses in Zijderveld.

Selection

Search and filter homes

Set your preferences and discover homes that suit you.

Total supply 242.628
Filters

Set price, area and other characteristics. Adjust a filter or click on Show homes. Location changes directly above.

Reset filters

You search for

  • Place Zijderveld
  • Status Sold

Sell your house in Zijderveld? Compare real estate agents

Bekijk recente verkopen en ontvang gratis offertes van lokale makelaars. Vergelijk meer dan 31 makelaars in Zijderveld.

Free request a quote

  • Quotes in Zijderveld
  • Non-binding
  • Personal
  • Compare free rates

Selling your own home in Zijderveld? Compare real estate agents in Zijderveld or view the best real estate agents in Zijderveld as a reference for your choice.

Compare multiple quotes

Real estate agents make sharper offers when they know you're comparing — ask for quotes for sale or purchase.

Frequently asked questions about sold homes in Zijderveld

Short answers about housing prices, sold homes and comparing real estate agents in Zijderveld.

Residential and neighborhood statistics in Zijderveld

View current location data on residents, WOZ development, housing stock, energy consumption, business activity and safety in Zijderveld. In 2025 were there 870 residents. The average WOZ value in 2025 is EUR 482.692.

These figures help to better assess and compare the housing stock in Zijderveld with recent sold homes. Orient yourself then on suitable top real estate agents in Zijderveld for sales advice in this region.

Residents

870

Last year: 2025

Average WOZ

EUR 482.692

Last year: 2025

Average income per person.

EUR 33.885

Source: AllNumbers

Crimes (current year)

33

Total registered

Demographics and WOZ development

Inhabitants per year

Inhabitants per year in Zijderveld
Year Residents
2021 870
2022 860
2023 870
2024 860
2025 870

Annual WOZ value

WOZ value per year in Zijderveld
Year Average WOZ
2021 EUR 358.836
2022 EUR 401.187
2023 EUR 465.680
2024 EUR 470.710
2025 EUR 482.692

Composition of residents

Age build-up

65+: 180 0-15: 145 15-25: 80 25-45: 220 45-65: 245

Education level

Hoger

110

Praktisch

150

Middelbaar

250

Origin of residents (2025)

Europa

25

Nederland

760

Buiten Europa

85

Housing stock and construction periods

Types of homes

Hoekwoningen 68
Appartementen 26
Tussenwoningen 81
Vrijstaande woningen 107
Twee-onder-één-kap woningen 64

Construction period of buildings

Voor 1700 4
1700 tot 1900 35
1900 tot 1925 24
1925 tot 1950 12
1950 tot 1970 49
1970 tot 1980 89
1980 tot 1990 48
1990 tot 2000 27
2000 tot 2010 20
2010 tot 2020 41
2020 en later 6

Energy and sustainability

Energy label distribution

Label C

83

Label A

68

Label D

49

Label G

47

Label B

44

Label F

16

Label E

9

Label A+

4

Label A+++

4

Label A++

2

Label A++++

0

Label A+++++

0

Average energy consumption per year

Average energy consumption per year in Zijderveld
Year Gas (m3) Electricity (kWh)
2020 1.480 3.430
2021 1.496 3.485
2022 1.170 3.343
2023 938 3.077
2024 912 3.172

Consumption per house type

Hoekwoning

Gas: 574 • Electricity: 2.128

Huurwoning

Gas: 557 • Electricity: 1.638

Koopwoning

Gas: 973 • Electricity: 3.268

Appartement

Gas: 399 • Electricity: 1.355

Tussenwoning

Gas: 607 • Electricity: 2.120

Vrijstaande woning

Gas: 1.294 • Electricity: 3.921

Twee-onder-één-kap woning

Gas: 1.023 • Electricity: 3.411

Business activity in Zijderveld (2025)

Handel en HORECA 5
Nijverheid en energie 25
Zakelijke dienstverlening 20
Overheid, onderwijs en zorg 10
Landbouw, bosbouw en visserij 20
Vervoer, informatie en communicatie 10
Financiele diensten en onroerendgoed 5
Cultuur, recreatie en overige diensten 5

Total number of company establishments: 105

Recent crime statistics

Recent crime statistics in Zijderveld
Period Crimes
jan 2026 4
jul 2025 3
jun 2025 1
mei 2025 4
mrt 2025 2
mrt 2026 3
nov 2024 10
nov 2025 2
okt 2024 6
okt 2025 3
sep 2024 9
sep 2025 3

These figures give an indicative picture of safety trends in the living environment of Zijderveld.

Frequently asked questions about living in Zijderveld

Short answers based on current local statistics, handy for a quick comparison of the living environment.

Hoeveel inwoners heeft Zijderveld?

Zijderveld telt in 2025 ongeveer 870 inwoners.

Wat is de gemiddelde WOZ-waarde in Zijderveld?

De gemiddelde WOZ-waarde in Zijderveld is in 2025 circa € 482.692.

Wat is het gemiddelde inkomen per inwoner in Zijderveld?

Het gemiddelde inkomen per inwoner in Zijderveld ligt rond € 33.885 per jaar.

Hoe veilig is wonen in Zijderveld?

Voor het huidige jaar gaat het om ongeveer 33 geregistreerde misdrijven. Gebruik deze cijfers als indicatie en vergelijk trends per periode.

Welke woningtypen komen het meest voor in Zijderveld?

In Zijderveld komt vooral "Vrijstaande woningen" veel voor, met ongeveer 107 woningen.

Receive free, non-binding quotes

Compare multiple real estate agents and choose the best match.