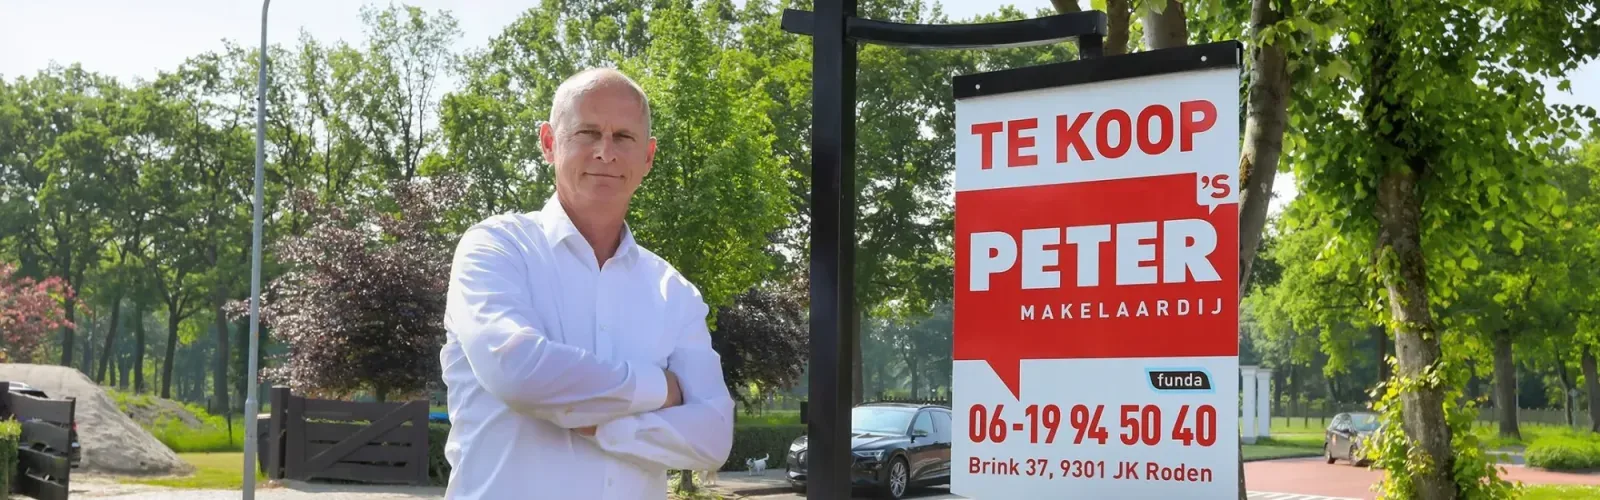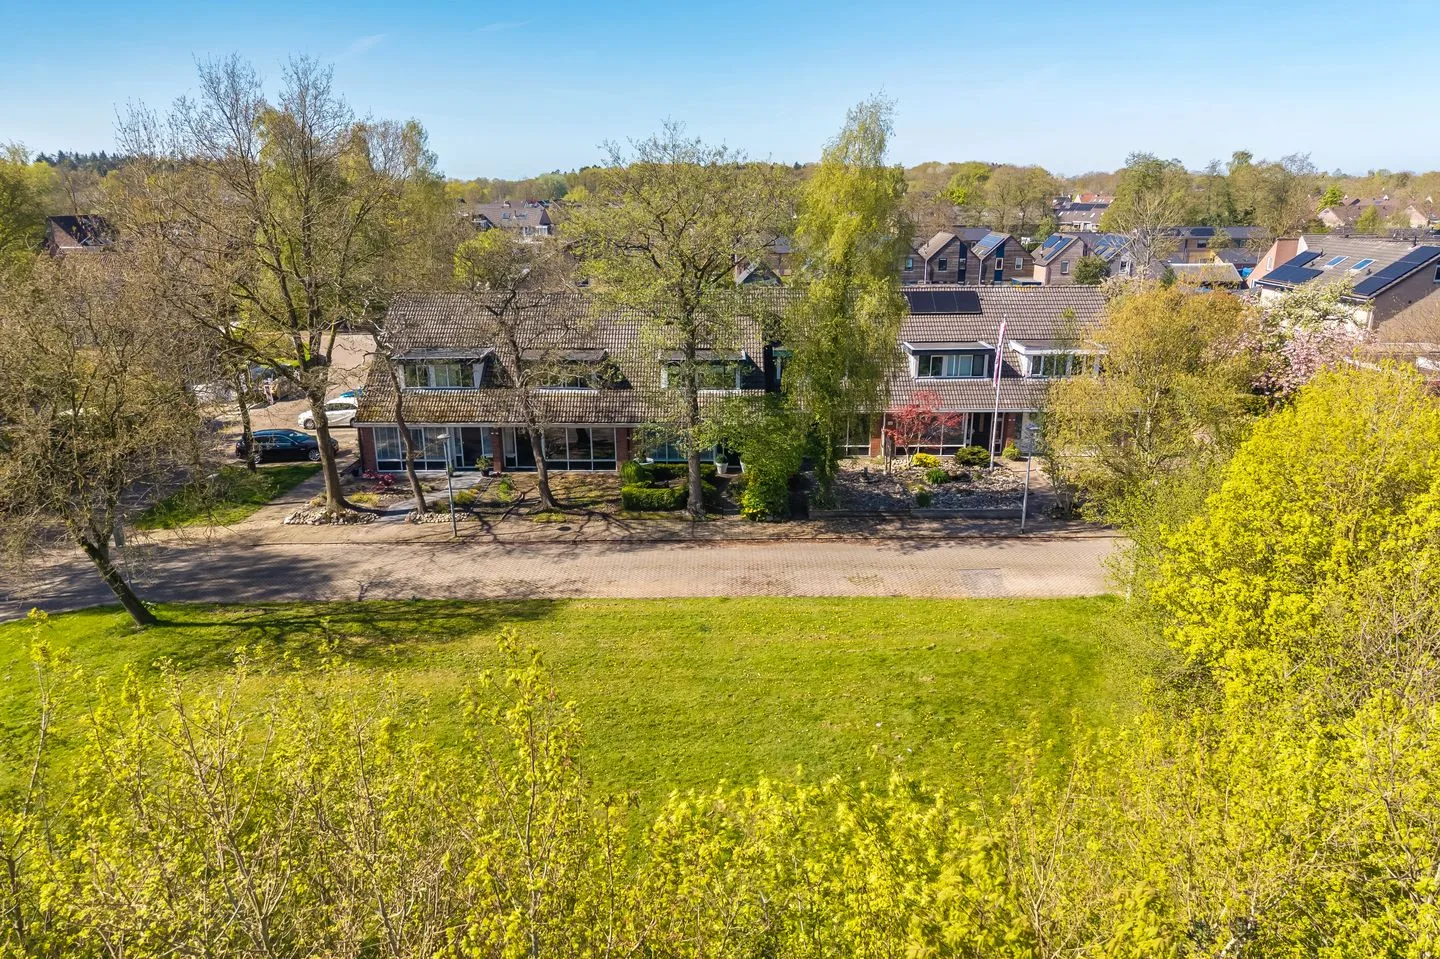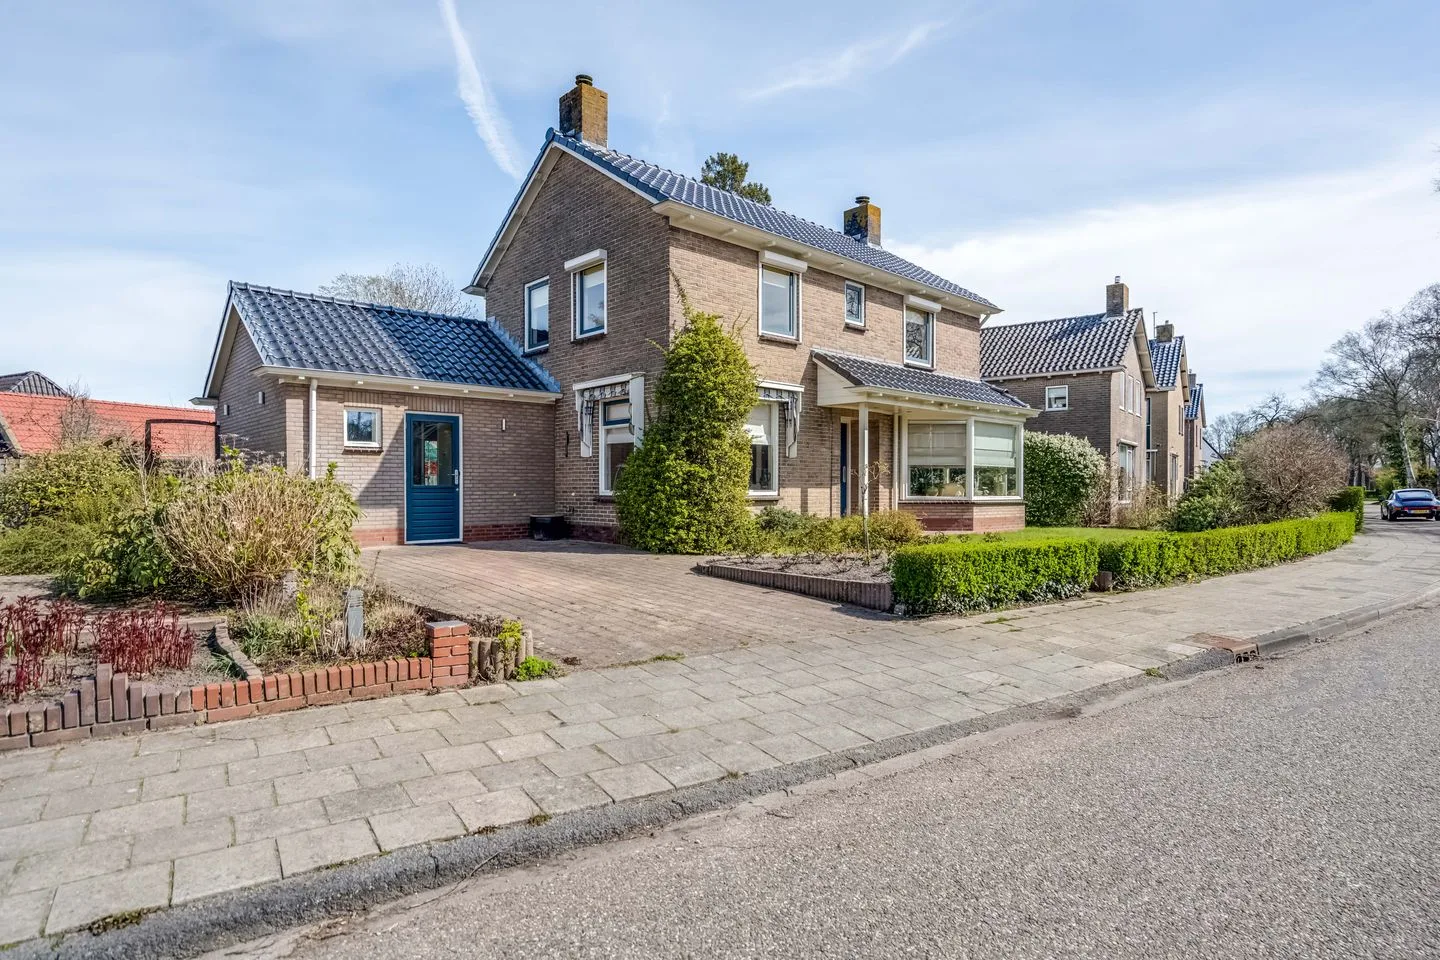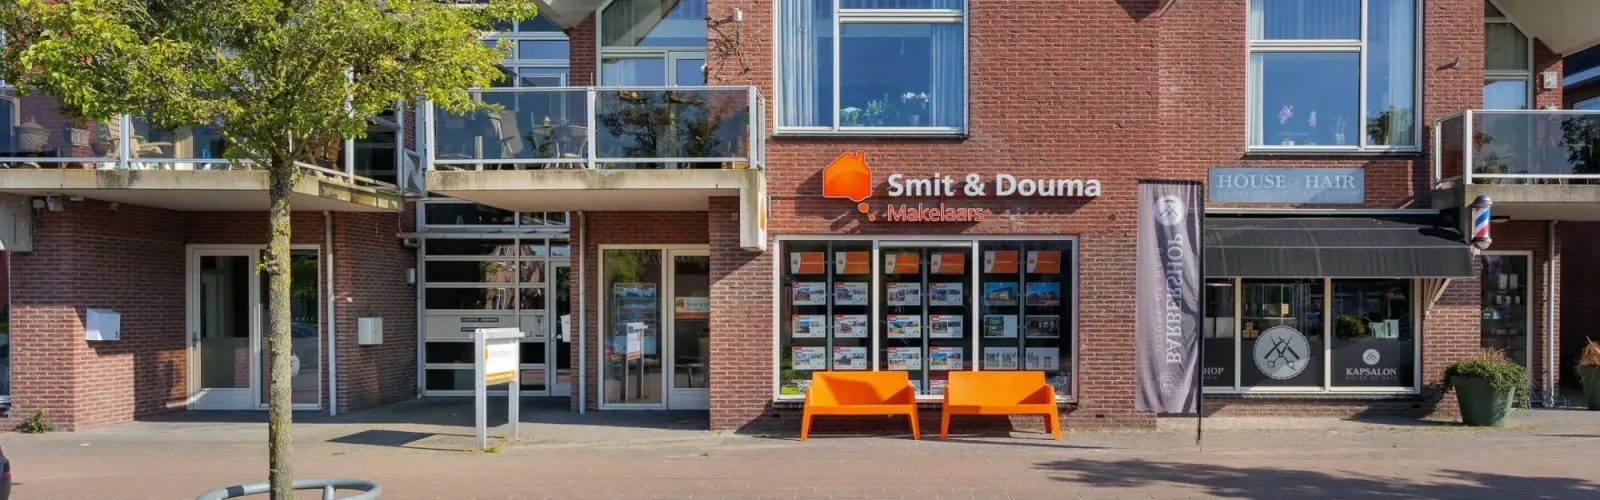

KIEN wijkmakelaar in Haulerwijk staat voor persoonlijke, betrouwbare en lokale begeleiding bij alle vastgoedtransacties. Wij werken dichtbij de wijk en kennen de straten, woningen en mensen in het gebied. Onze expertise ligt in het verkoop-, aankoop- en huurproces, met extra aandacht voor taxaties en bijzondere projecten. Wij zijn er om je te begeleiden tijdens een van de belangrijkste momenten in je leven, met passie en professionalite...
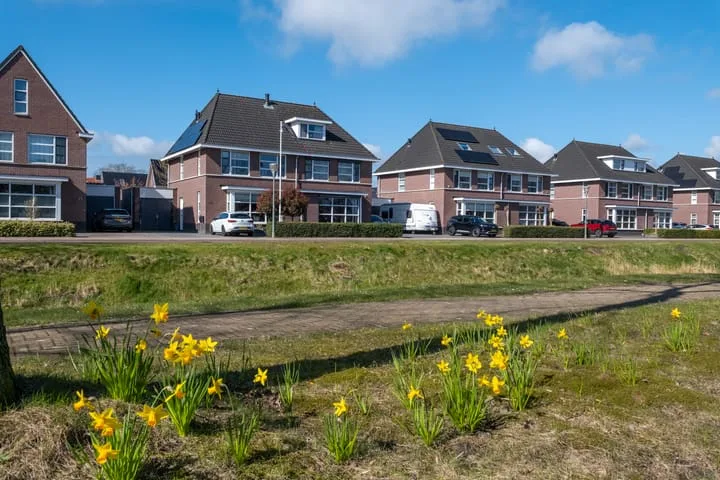
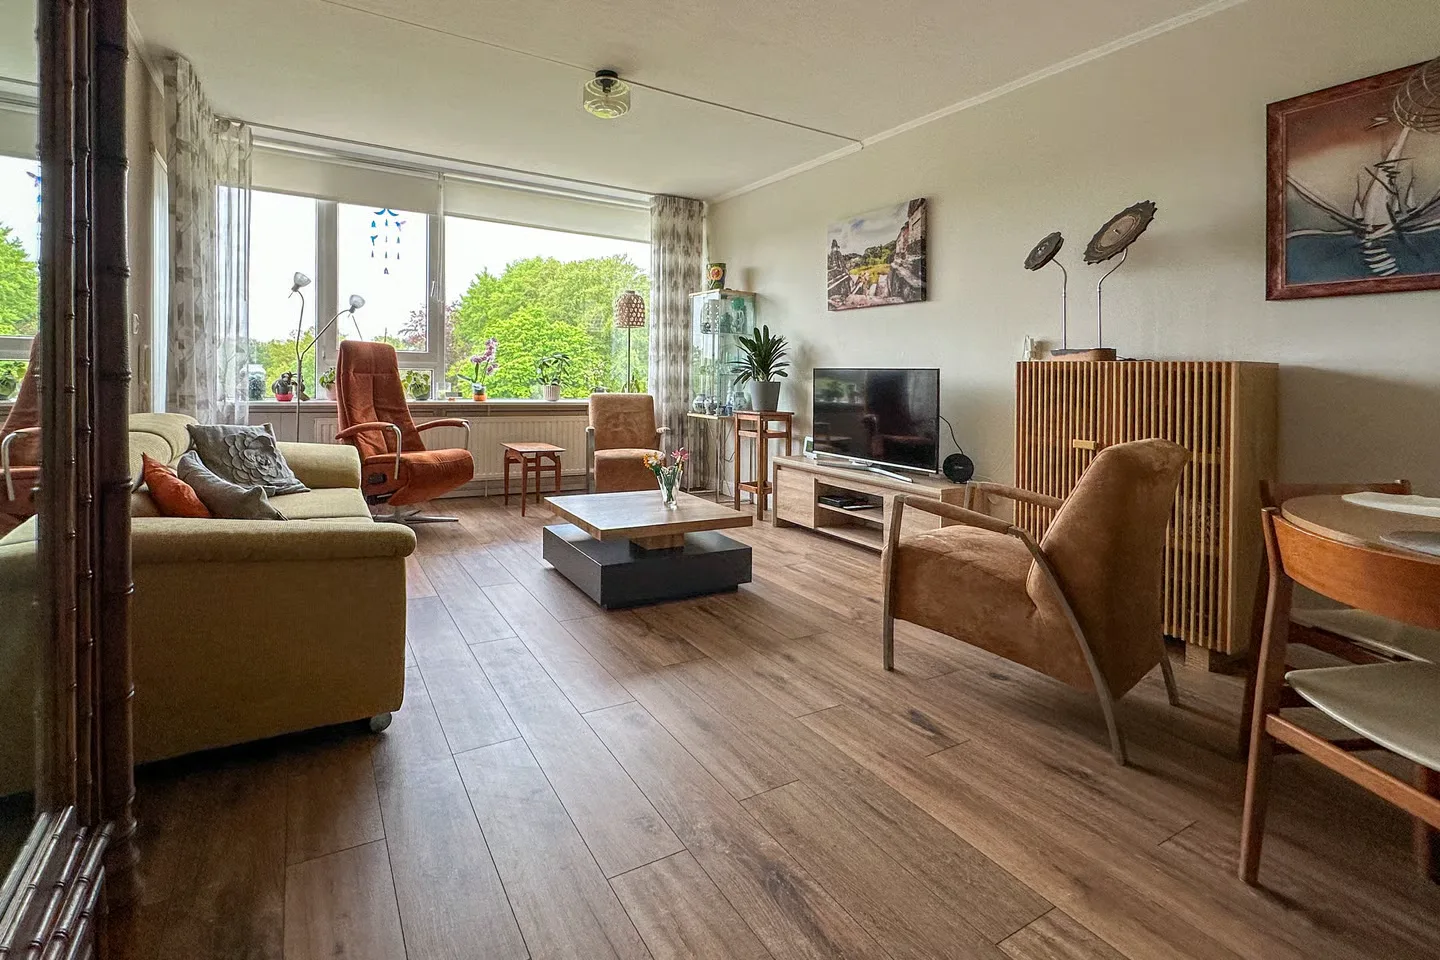
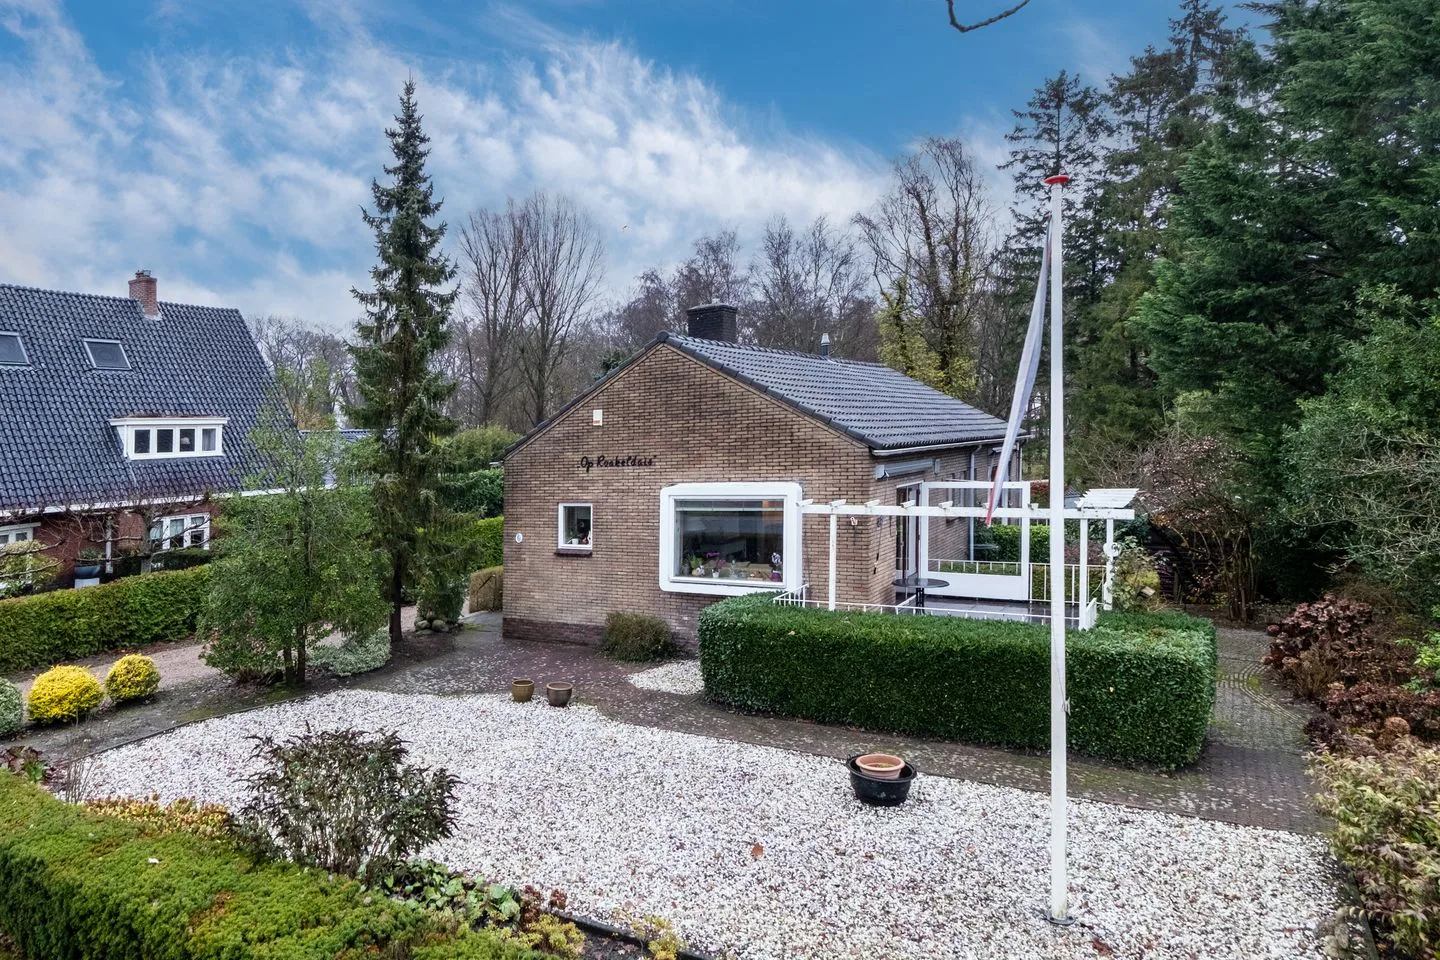
Current housing stock
-

- Available
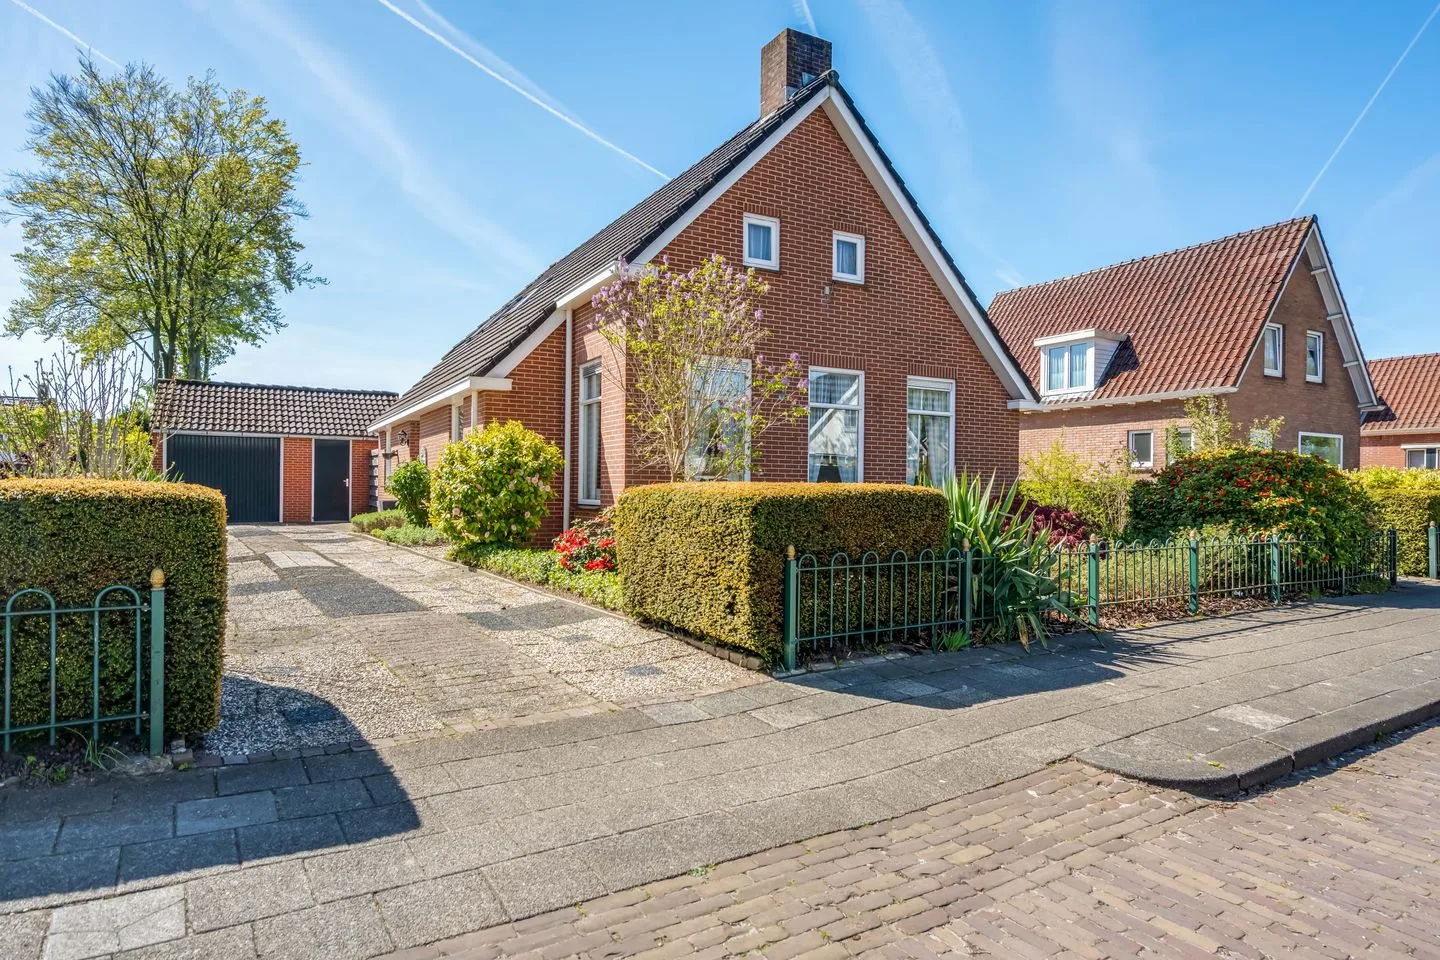
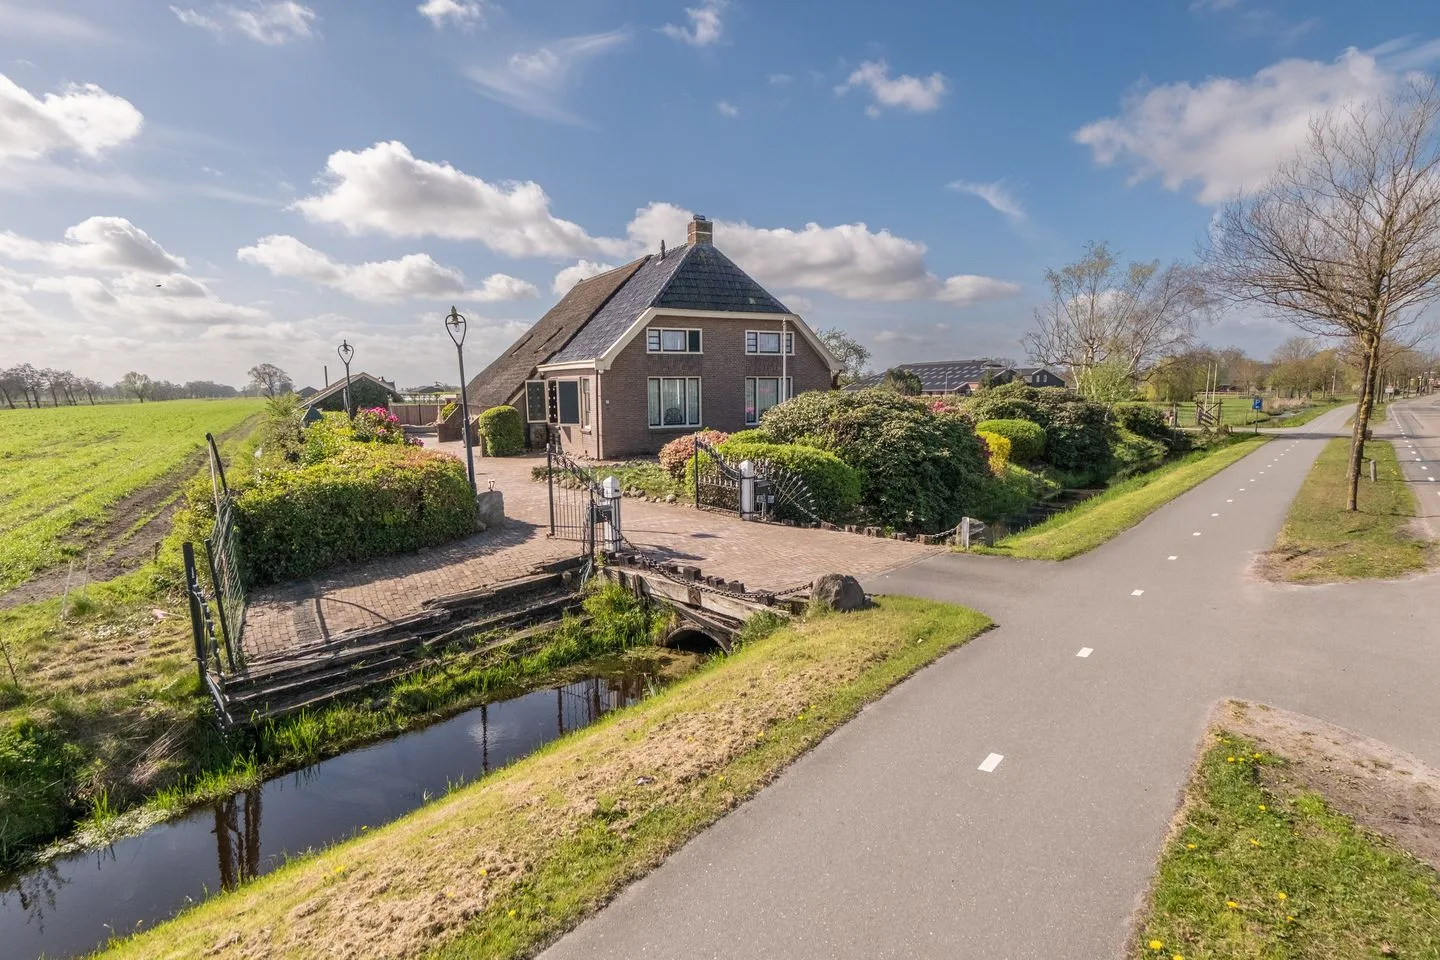
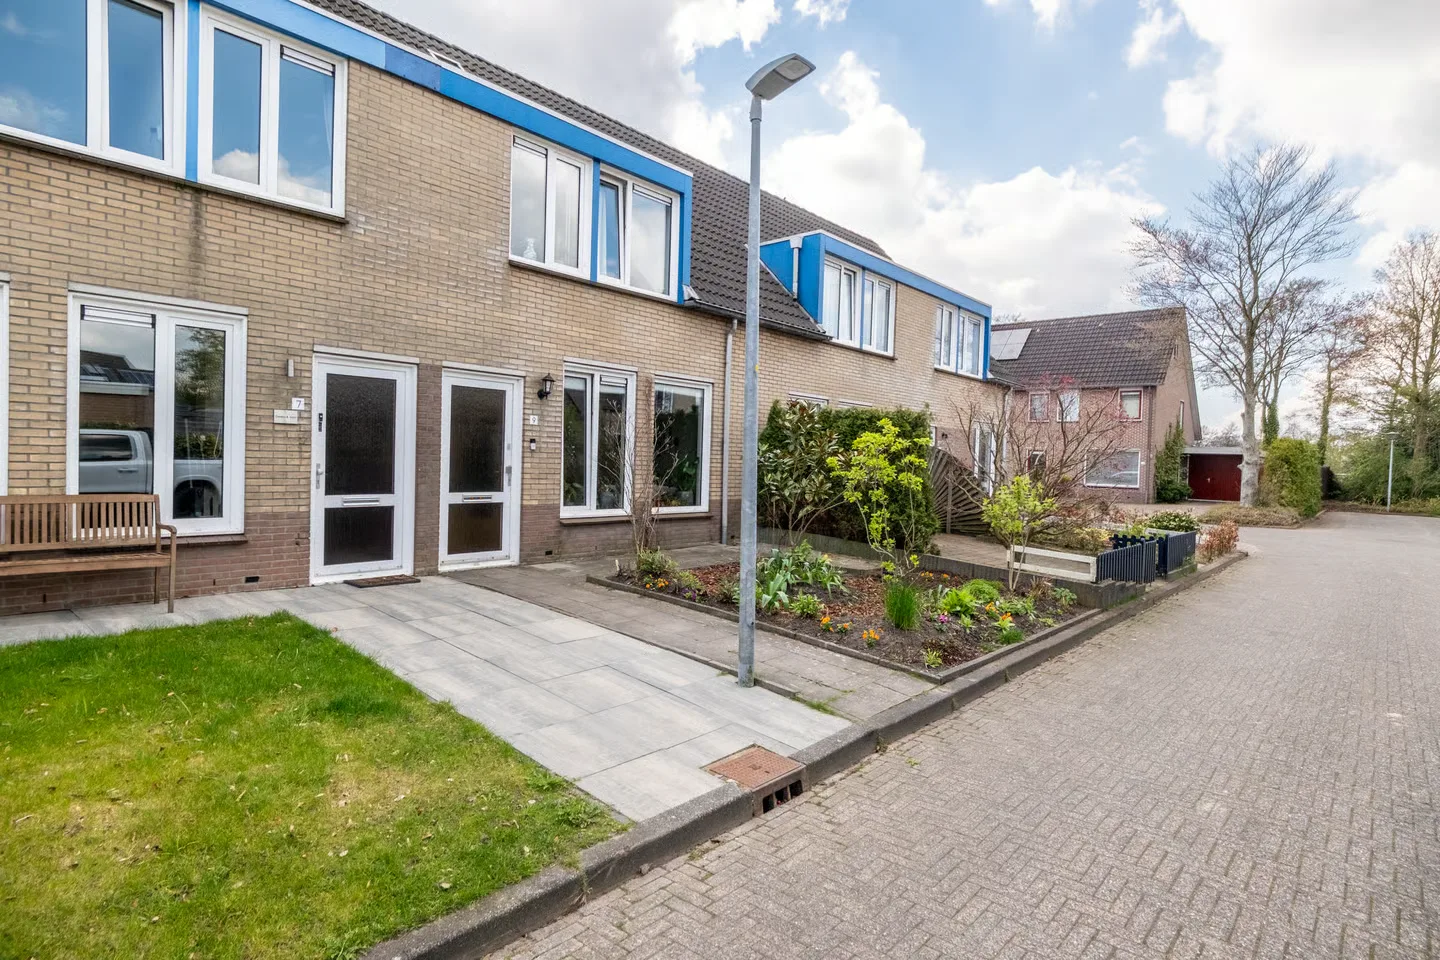
Praam 28
8433HA Haulerwijk
€ 445.000 k.k.
€ 4.198/m²
ASave as favorite- Living area
- 106 m²
- Land area
- —
- Bedrooms
- 2
-

- Available
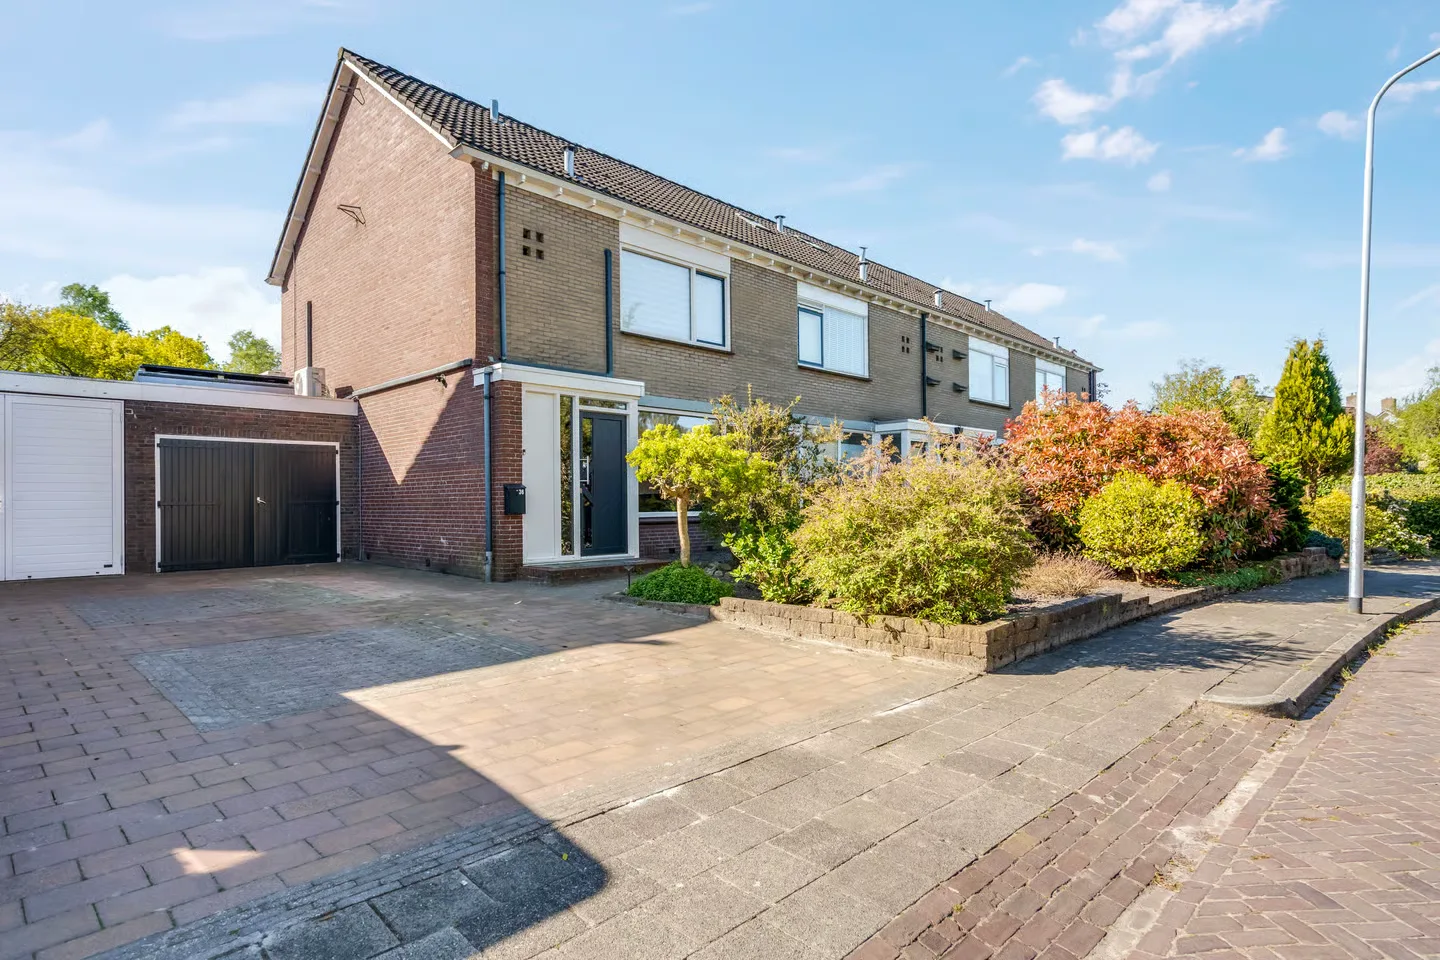
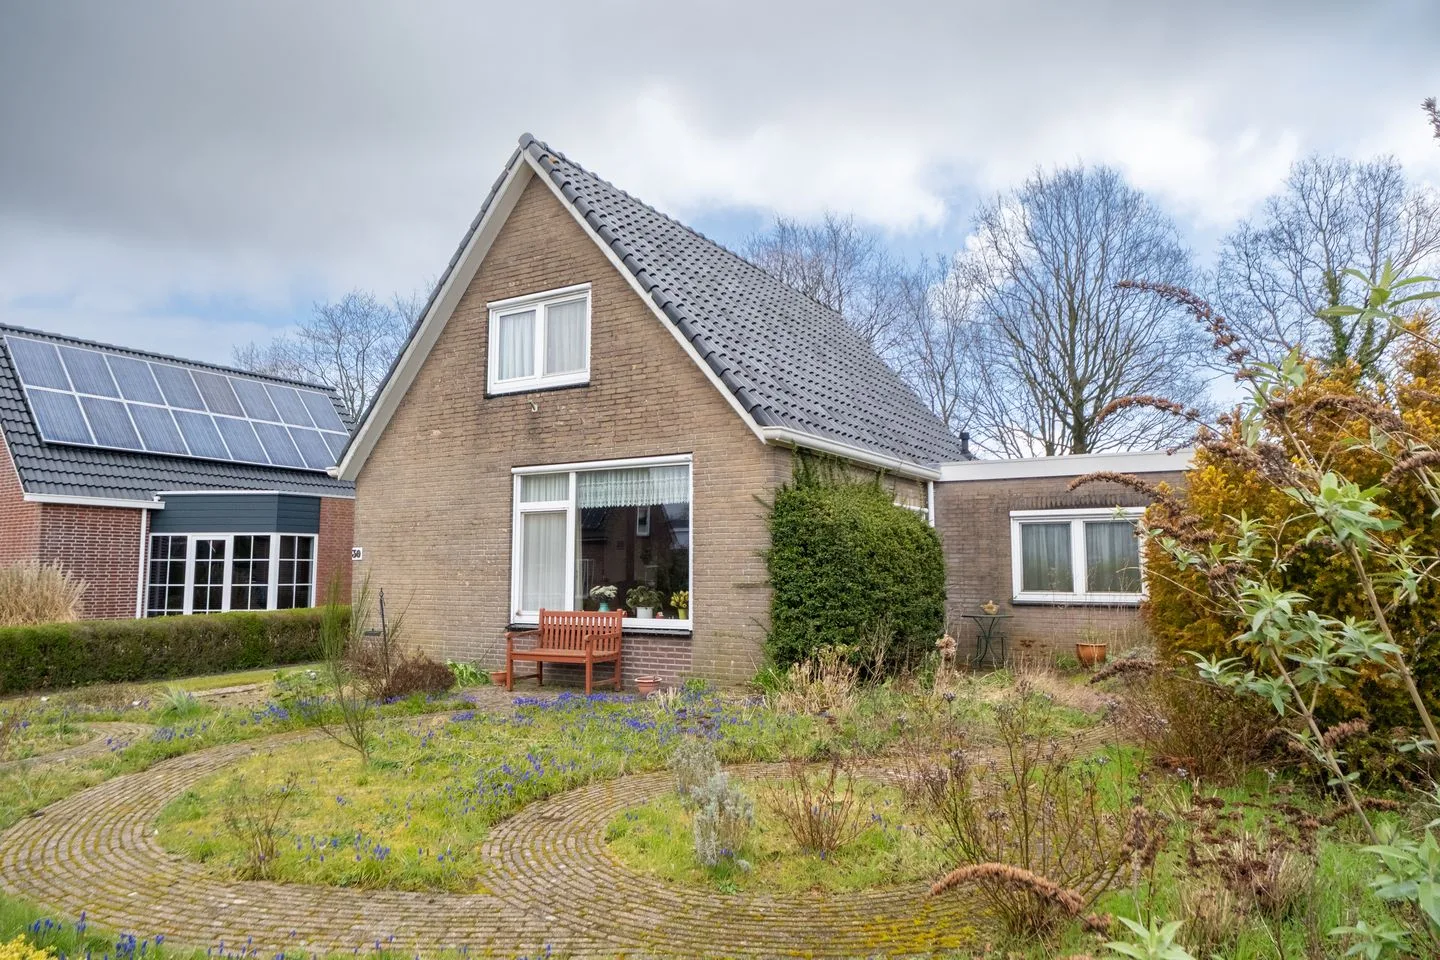
Valckeniersweg 38
8433JB Haulerwijk
€ 325.000 k.k.
€ 3.316/m²
BSave as favorite- Living area
- 98 m²
- Land area
- 271 m²
- Bedrooms
- 4
-

- Available
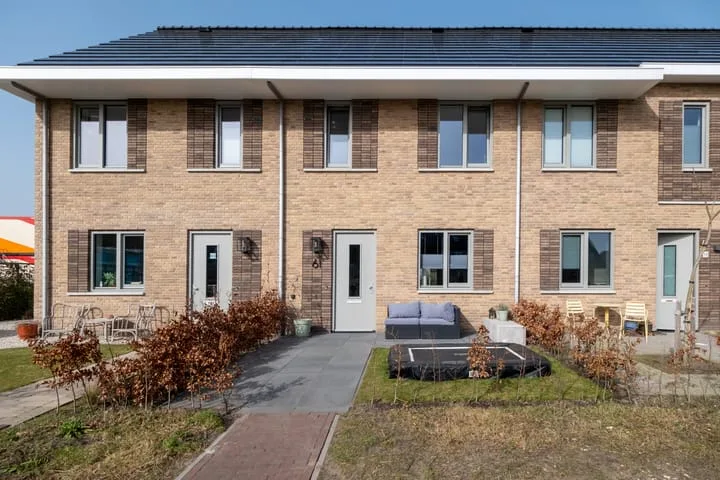
Kersenlaan 7
9861CP Grootegast
€ 425.000 k.k.
€ 3.125/m²
ASave as favorite- Living area
- 136 m²
- Land area
- 307 m²
- Bedrooms
- 4
-

- Available
Loswal 12
8433HD Haulerwijk
€ 450.000 k.k.
€ 3.629/m²
CSave as favorite- Living area
- 124 m²
- Land area
- 462 m²
- Bedrooms
- 3
-

- Available
Asserstraat 93
9335TA Zuidvelde
€ 1.100.000 k.k.
€ 3.459/m²
Save as favorite- Living area
- 318 m²
- Land area
- 3250 m²
- Bedrooms
- 6
-

- Available
Dokter Beumerstraat 46 B
8433MJ Haulerwijk
€ 549.950 k.k.
€ 3.525/m²
ASave as favorite- Living area
- 156 m²
- Land area
- 614 m²
- Bedrooms
- 4
Reviews (35)
Review platforms
BronscoresTotal score
35 total reviews

Funda
20 reviews on Funda

15 reviews on Google
-
Scheidingsweg 40
10Zeer prettig in de communicatie en het traject van begin tot eind. Zijn geld meer als waard. Een goed bereikbaar kantoor met persoonlijke inslag.
-
Meester Zuidemastraat 57
7Translated by AIAlthough the agent himself is competent and, in my opinion, the viewings went well thanks to his guidance, I unfortunately did not experience the entire process as predominantly positive. At almost every step there were sloppinesses or miscommunications that had to be corrected, which meant I could not fully hand over the matters with a clear conscience. The most annoying incident was an inspection of which I had not been informed by the secretary. My wo…
-
Collin
10Translated by AIWe are extremely happy and grateful for the efforts of Kien Wijkmakelaar, office Kloosterveen. Muriël really put herself in our shoes. Already during the second viewing, we, trusting in Muriël's expertise, made a bid that was very acceptable to us and was accepted. After a long search, we had within one day a viewing, a bid submitted, and a message that our bid was accepted! It was nice after a year of fumbling ourselves to now be well prepared and confident enough to make a good bid. Also, the after-sales process is experienced by us as very pleasant. It's our first purchased home, so sometimes we have quite a few questions. These are quickly answered in the specially created whatsapp group, even in the evenings and on weekends. A big plus point compared to other real estate agents is a quite sharp price/quality ratio. At KIEN, houses are actively presented where with most real estate agents you yourself have to come up with them. Also, you can view unlimited properties for the fixed all-in price with your real estate agent. In this regard, we experienced Kien as very flexible. In short, two satisfied customers (so far) and from February really starters on the housing market.
-
Seinpôlle 22
10Translated by AIThe cooperation was completely as expected and according to agreement. Pleasant communication and pleased with the service.
-
Meester Nennstiehlweg 47
9Translated by AILow-threshold and clear contact. From the beginning a good feeling which has been confirmed in the sale!
-
Dorpsstraat 46
9Translated by AIThe real estate agents of Wijkmakelaar Kien are very experienced and very involved with their (s)ellers. Recommender!
-
Bakkeveensterweg 11 C
10Translated by AIVery short lines with the real estate agent, personally involved and come appointments after. Very nice to be able to sell our home with this real estate agent.
-
Noardkamp 7
9Translated by AIBoth buying a house from, as well as selling with Kien! Both times very satisfied. Very quickly and easily reachable, you never feel too much and he can with all his knowledge and skill answer and explain everything properly. Price quality more than good, and you get personal attention back, which we experienced as very pleasant.
-
Selin Karaaslan
10Translated by AIThis fine real estate agent gets a thick 10 from us as a rating!! You get everything you're looking for here: clarity, customer attention, short lines, good service and all that for a nice price! Muriël is a super fine and lovely real estate agent who is always ready for you and always reachable. Even in the evenings and during her vacation she makes time for you. She is very involved. I would say: “Don't look any further, here you get everything you as a customer expect from a real estate agent!” The next time we would certainly choose Kien Wijkmakelaar without a doubt!!
-
Kerklaan 30
10Translated by AIIn a word: excellent! Jorrin is a skilled real estate agent with a good team. Much appreciation for the personal approach to selling my childhood home. Good accessibility, short lines of communication and clear advice. Beautiful photos and lovely drone footage. We experienced the collaboration as very pleasant and will, should the opportunity arise, choose Kien makelaars again.
-
Emmie De Boer
10Translated by AIReliable, expert and involved - a definite recommendation! We came into contact with Jorrin Mulder of KIEN neighborhood real estate agent via an online request, and honestly, I was initially somewhat skeptical. My preference initially went to a well-known realtor from Oosterwolde. But because the appointment had already been scheduled, we decided to have the meeting anyway - and I haven't regretted it for a moment. From the first conversation, Jorrin immediately inspired confidence. He comes across as very professional, is clearly incredibly experienced and has genuine passion for his profession. His approach is personal, clear and no-nonsense. No smooth sales pitches, but simply honest advice and clear explanation of the sales strategy. Within no time, our home was professionally online thanks to an excellent photographer who KIEN engaged. Everything was taken care of down to the last detail. And the result? Within two weeks, our house was sold for a beautiful amount that we are incredibly happy with! Throughout the entire process, Jorrin was always accessible and kept us well informed. Everything went smoothly and professionally. In short: if you are looking for a realtor who really thinks along with you, offers clear communication and delivers results, then I can wholeheartedly recommend KIEN neighborhood real estate agent. Thank you Jorrin - you have exceeded our expectations! Emmie de Boer & Antoine Scholtalbers
-
Alexander IJbema
10Translated by AILast year I sold my house through Jorrin / Kien. Very satisfied with the entire process and guidance! The market was not great at that time due to rising interest rates. Nevertheless, Jorrin found a suitable buyer.
-
Martin Leegstra
10Translated by AIViewed a nice property that was for sale by Jorrin. Due to circumstances, the purchase unfortunately did not go through, despite all the efforts made by Jorrin and his team. Pleasant (telephone) contact.
-
Langekamp 31
10Translated by AIjust one number and that's a solid 10. very good communication amongst yourselves, superb presentation of the property and proper handling.
-
Nieuwe Holdert 4
10Translated by AIVery friendly staff and the broker has a lot of knowledge and insight and takes everything into account, also acts directly on requests.
-
Tsjerkebuorren 5
10Translated by AIGood communication and happy with the result. Good technical knowledge and short lines of communication. Additionally, helped with good advice.
-
Hoofdweg 118
10Translated by AIExcellent, good contact Excellent expertise Good information and explanation, also for future buyers Thanks
-
Ds Groot-Nibbelinkstraat 20
9Translated by AIContact works perfectly well, personally and professionally. However, some actions and reactions do take a bit longer than you were used to before, but this applies to every company at the moment. Everywhere it is busy, if one takes this into account, it remains relaxed for everyone. Great company, very nice people.
-
Het Dagwerk 6
10Translated by AIExcellent contact, expert brokers. They think along with you well, call if there are questions. Very attentive.
-
Drentseweg 6 A
9Translated by AIWe are incredibly satisfied with the help that Jorrin Mulder provided us in selling our house. From the first contact, we noticed his expertise and commitment. Jorrin thinks along with you, takes the time to explain everything clearly and does everything possible to close the best deal. He is always ready to go the extra mile and ensures that you feel supported throughout the entire process. Thanks to his professional approach and good advice, we have…