Koopstek
In Mantgum, Koopstek offers reliable and personal real estate services. We are active in the region and focused on helping customers with their housing wishes, paying attention to detail and transparency. Our promise is to guide you from the first step to the final result. We offer services such as sale, rent, let and purchase. Our approach is aimed at finding the best solution for your situation, making use of our expertise and certifi...
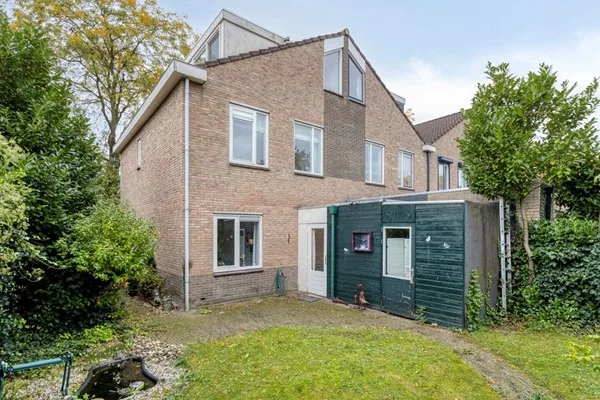
Current housing stock
-

- Available
Ebro 1
7007MC Doetinchem
€ 398.000 k.k.
BSave as favorite- Living area
- 110 m²
- Land area
- 252 m²
- Bedrooms
- 3
-

- Available
Marsweg 3
6941BG Didam
€ 648.000 k.k.
€ 3.767/m²
ESave as favorite- Living area
- 172 m²
- Land area
- 678 m²
- Bedrooms
- 5
-

- Available
Tullekensteeg 30 3
6811GE Arnhem
€ 179.000 k.k.
€ 6.630/m²
DSave as favorite- Living area
- 27 m²
- Land area
- —
- Bedrooms
- 1
-

- Available
Poststraat 39
6828EK Arnhem
€ 319.000 k.k.
€ 5.317/m²
A++Save as favorite- Living area
- 60 m²
- Land area
- —
- Bedrooms
- 2
-

- Sold
Tullekensteeg 30 3
6811GE Arnhem
€ 185.000 k.k.
€ 6.851/m²
DSave as favorite- Living area
- 27 m²
- Land area
- —
- Bedrooms
- 1
-

- Sold
Markt 36 3
6811CJ Arnhem
€ 336.000 k.k.
€ 4.307/m²
ESave as favorite- Living area
- 78 m²
- Land area
- —
- Bedrooms
- 4
Reviews (6)
Review platforms
BronscoresTotal score
6 total reviews

Funda
6 reviews on Funda
-
Golden Delicious 97
10Translated by AIKim is super real estate agent! Very nice help and always ready for me. Very clear explanation and guidance. Punctual and everything on time.
-
Poststraat 35
9Translated by AIContact with Koopstek (Kim de Kievit) went smoothly and easily. The matter was dealt with promptly. Strategy was clear and well-supported. I am very satisfied with the proactive attitude. Next time, I will choose Koopstek again. Louk Heimans Beheer b.v. Arnhem.
-
Poststraat 37
9Translated by AIWhat struck me was that Kim de Kievit seemed very involved. Developed a sales strategy specifically applicable to the property. She tackled the sale in a skilled and proactive manner. Clear and concise both towards the client and potential buyer. Everything discussed thoroughly with the client. Will definitely recommend her to third parties. Louk Heimans
-
Nachtschade 138
9Translated by AIWe experienced the guidance as very good. We were regularly kept informed. And could always go to her with questions.
-
Hanenhoek 33
10Translated by AIKoopstek successfully sold our detached house. The entire collaboration went smoothly. Always accessible, excellent service. Professional and skilled. A very pleasant collaboration. Thank you, Koopstek. Should we sell a property again, we will definitely engage Koopstek again.
-
Maria van Nassaulaan 14
10Translated by AIProfessional real estate agency, with good service. Pleasant contact. A recommendation for the purchase or sale of your house.