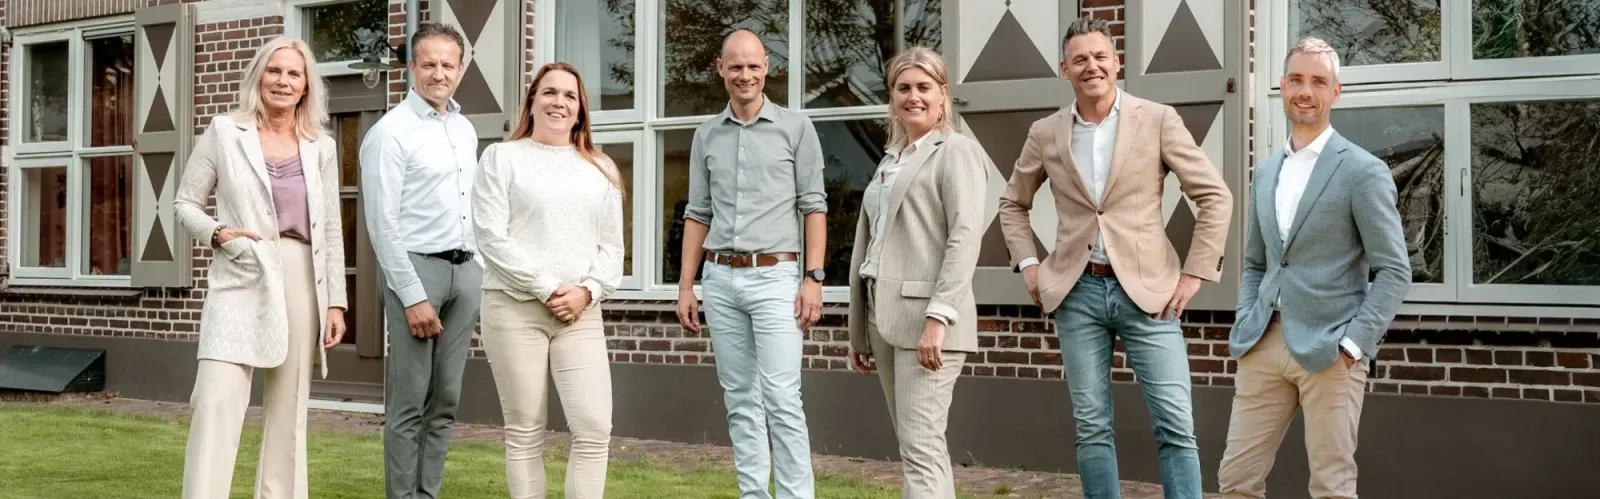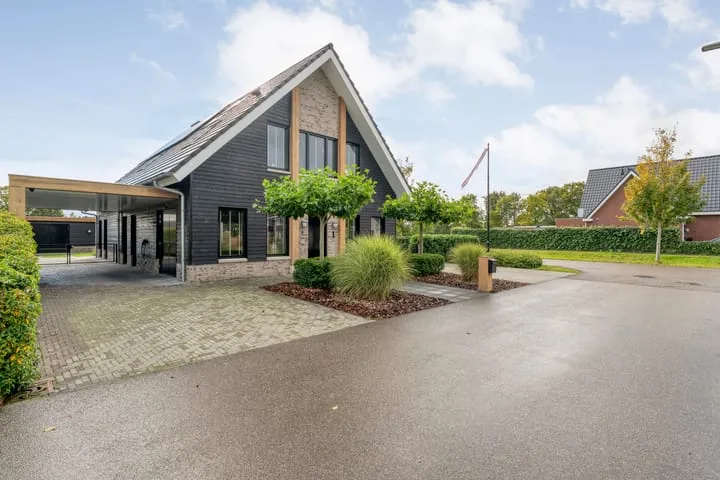
Reggedael makelaardij & taxaties B.V.

Bij Reggedael makelaardij en taxaties staat uw woonreis centraal. Wij begeleiden u stap voor stap met deskundig advies, zodat het kopen of verkopen van uw woning een fijne en gerichte ervaring wordt. Onze passie voor de makelaardij is geboren uit jaren ervaring en een diepe waardering voor de afwisseling van het vak. Al sinds 2020 is Anita Leestemaker eigenaar van het kantoor, na een solide opleiding en jaren ervaring als NVM makelaar....
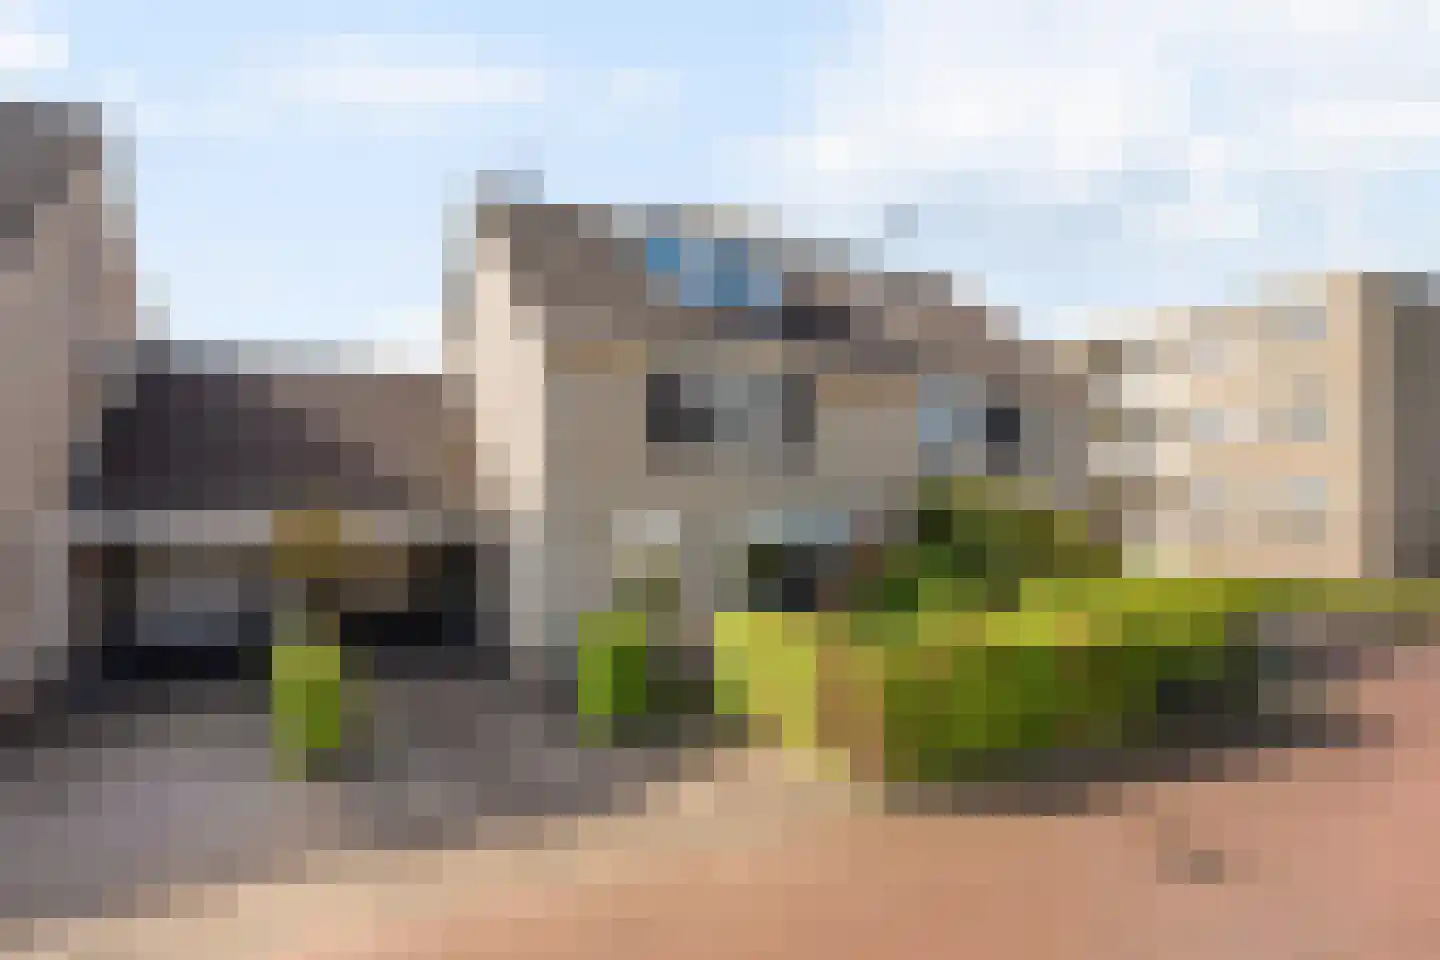
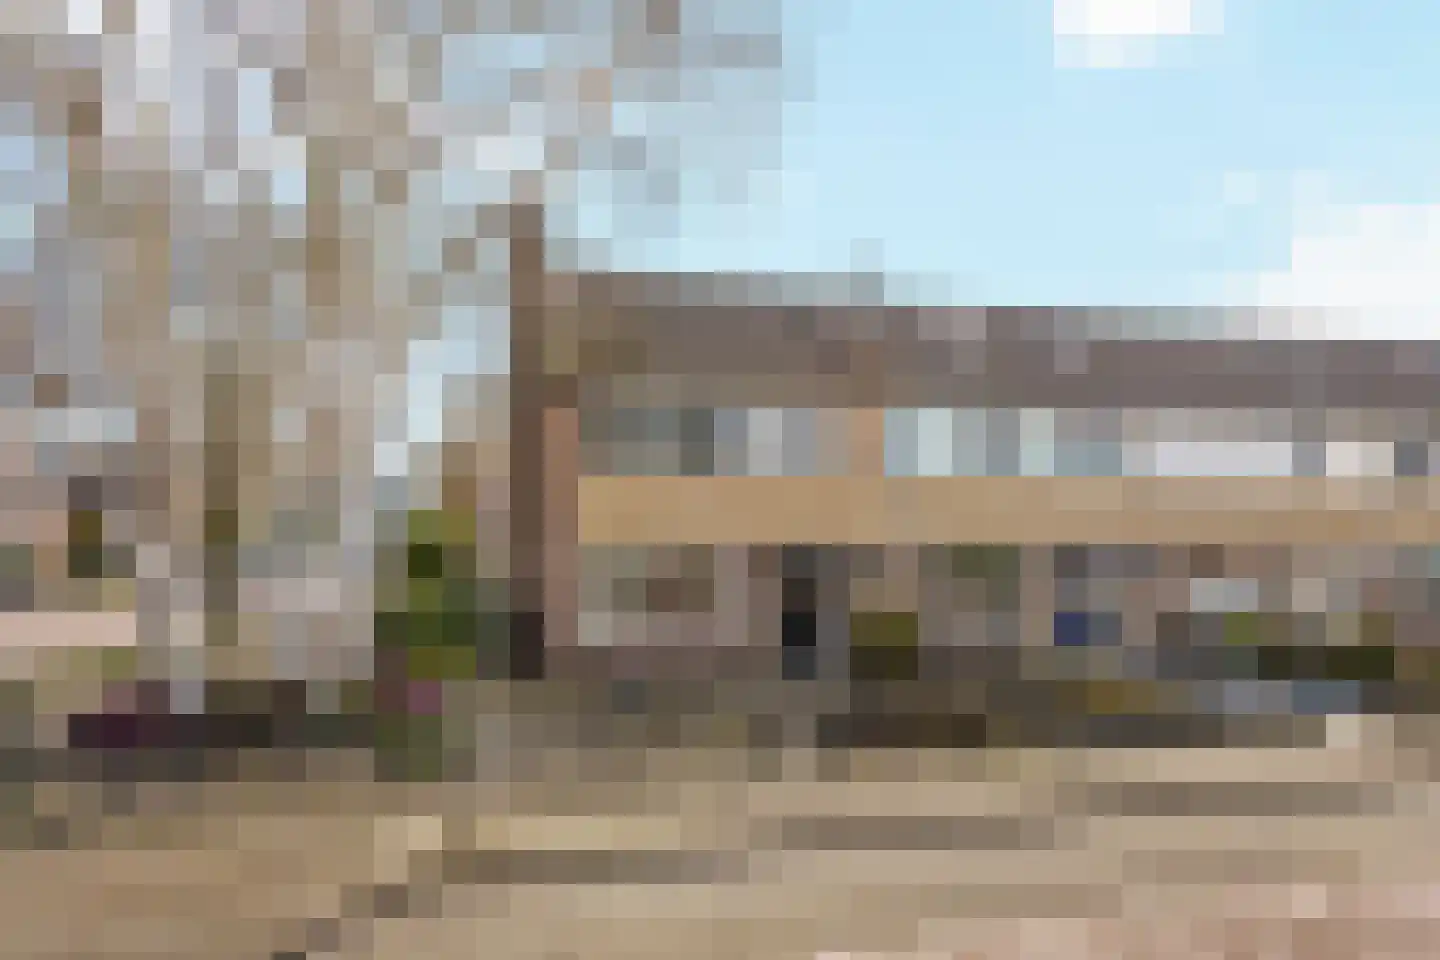
Current housing stock
-

- Available
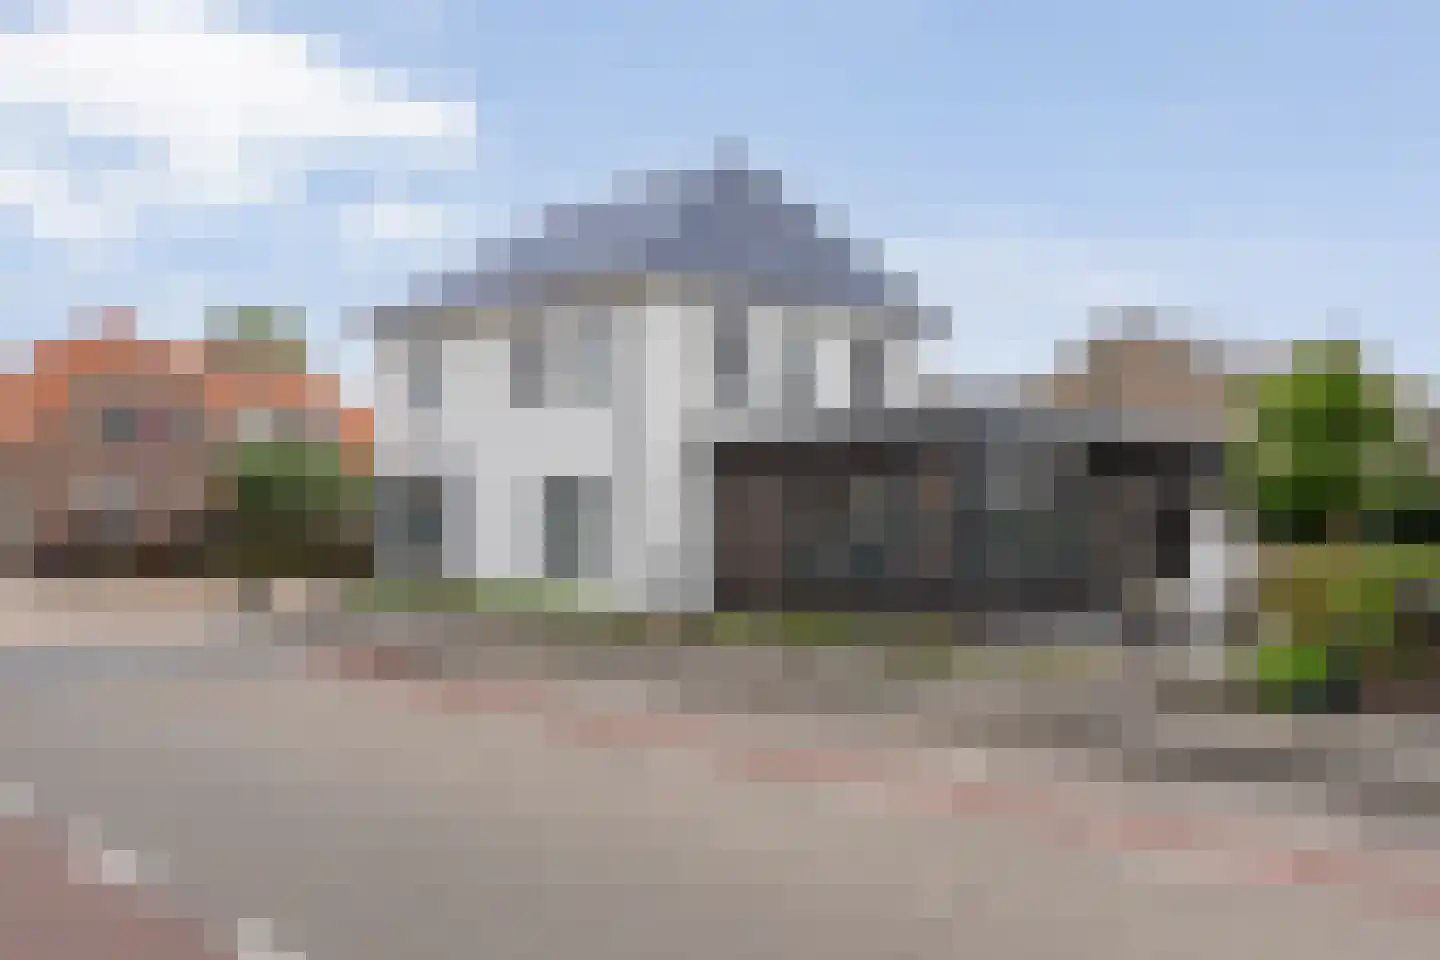
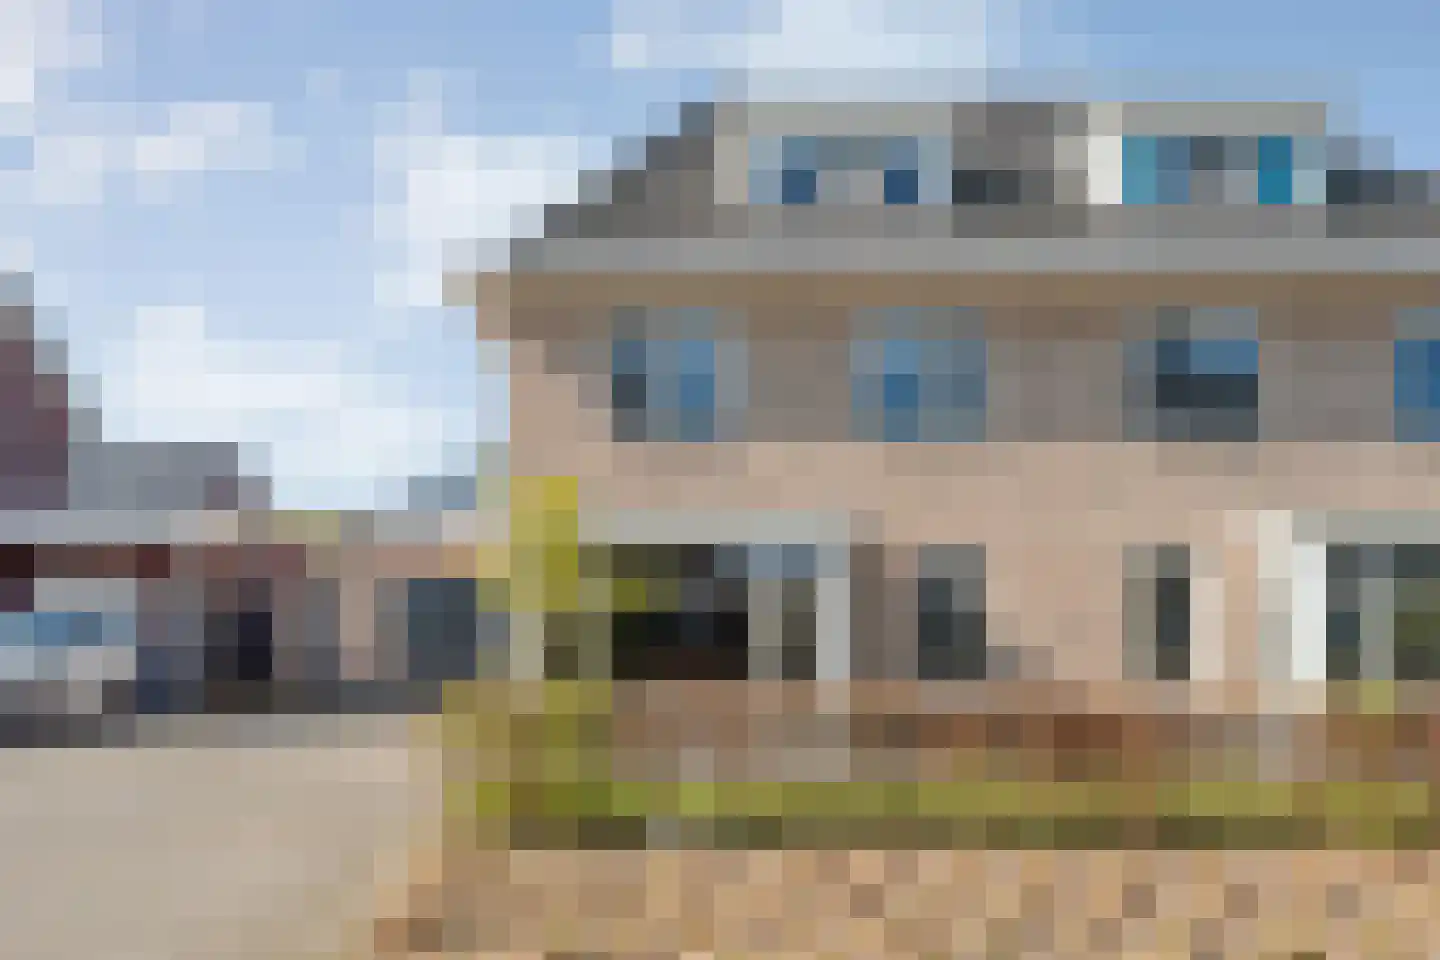
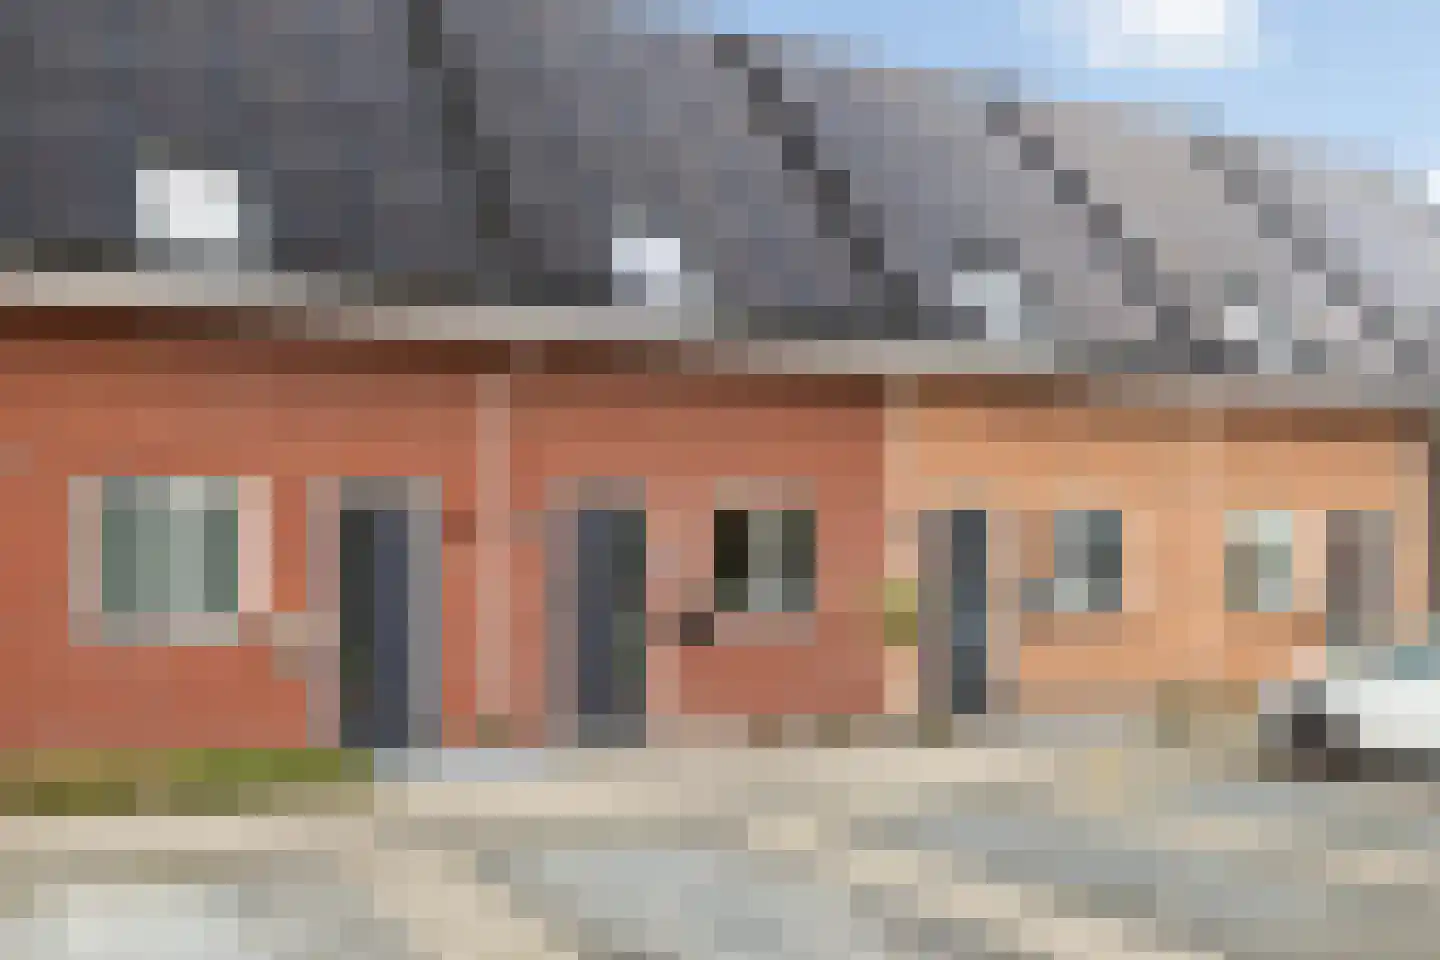
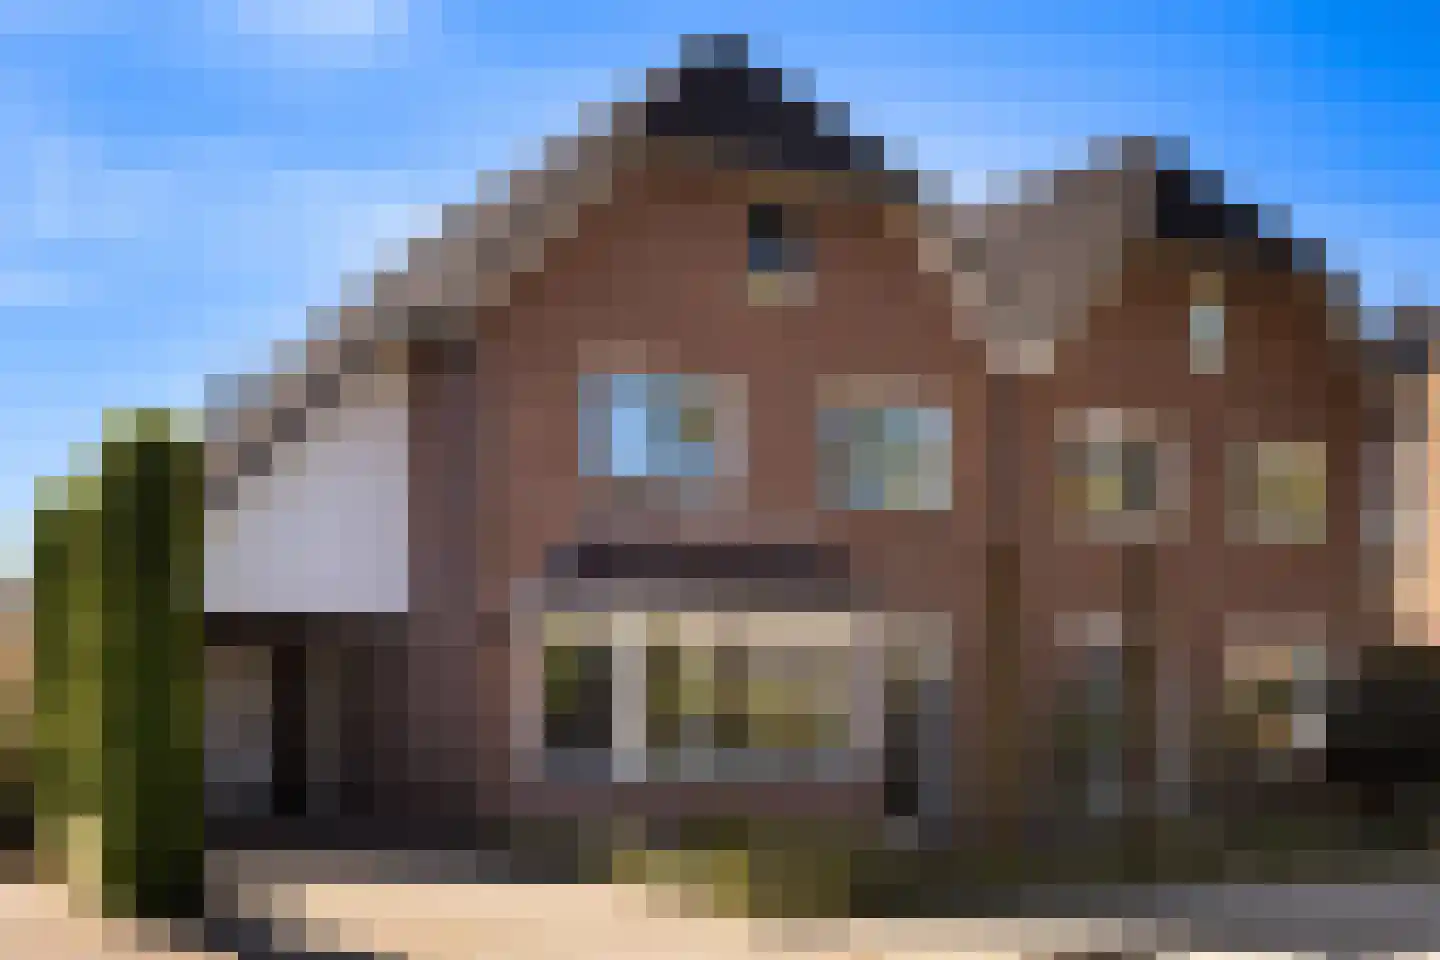
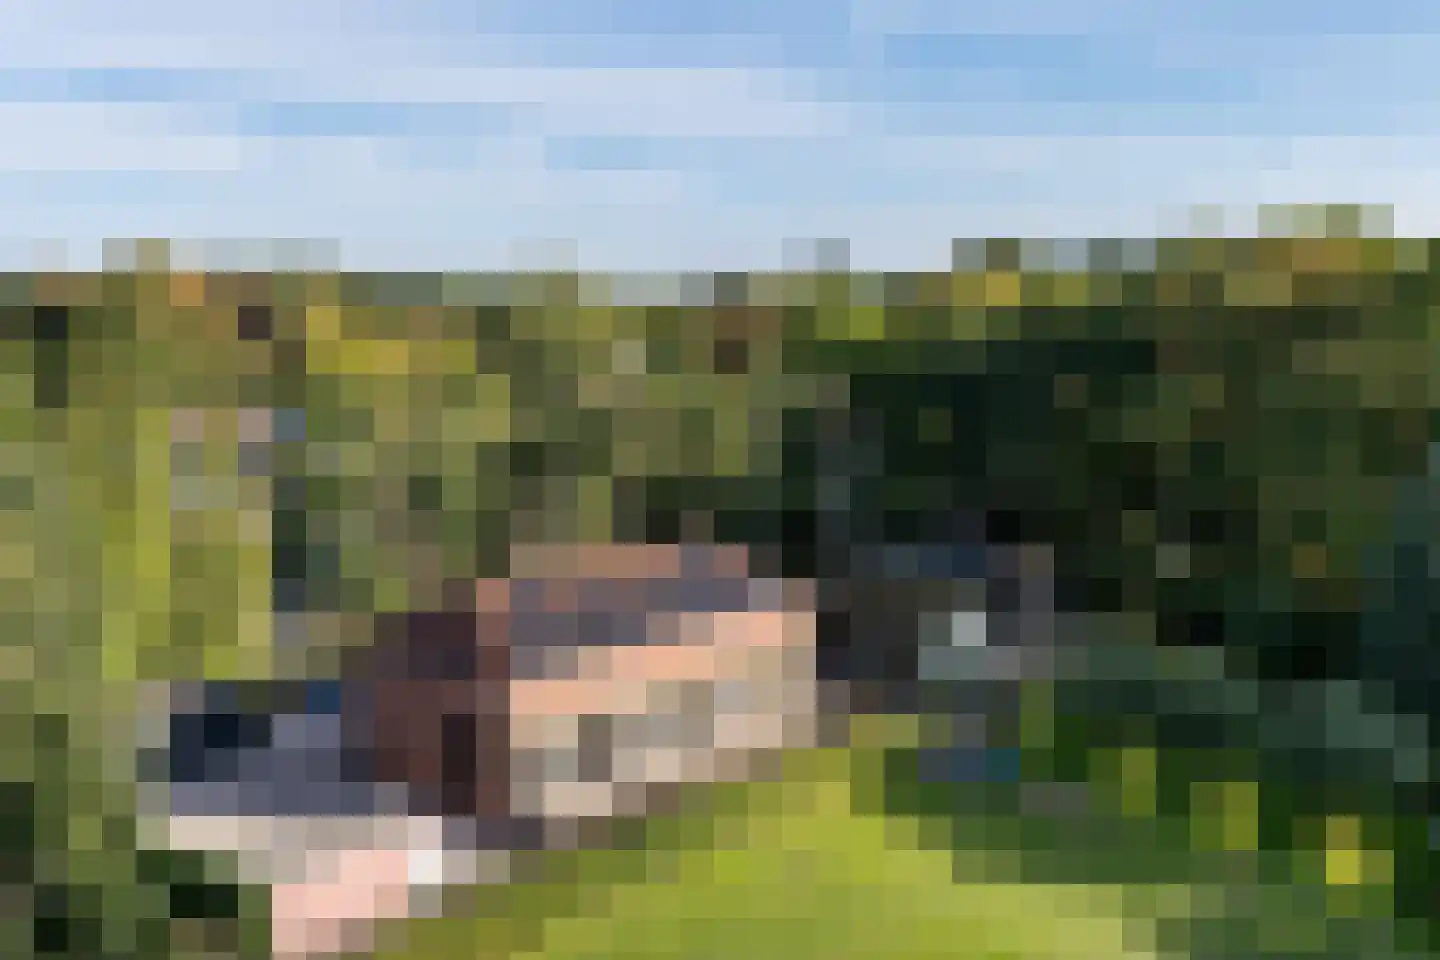
Koeveenweg 2
7441AS Nijverdal
€ 825.000 k.k.
€ 4.024/m²
ASave as favorite- Living area
- 205 m²
- Land area
- 995 m²
- Bedrooms
- 4
-
- Available
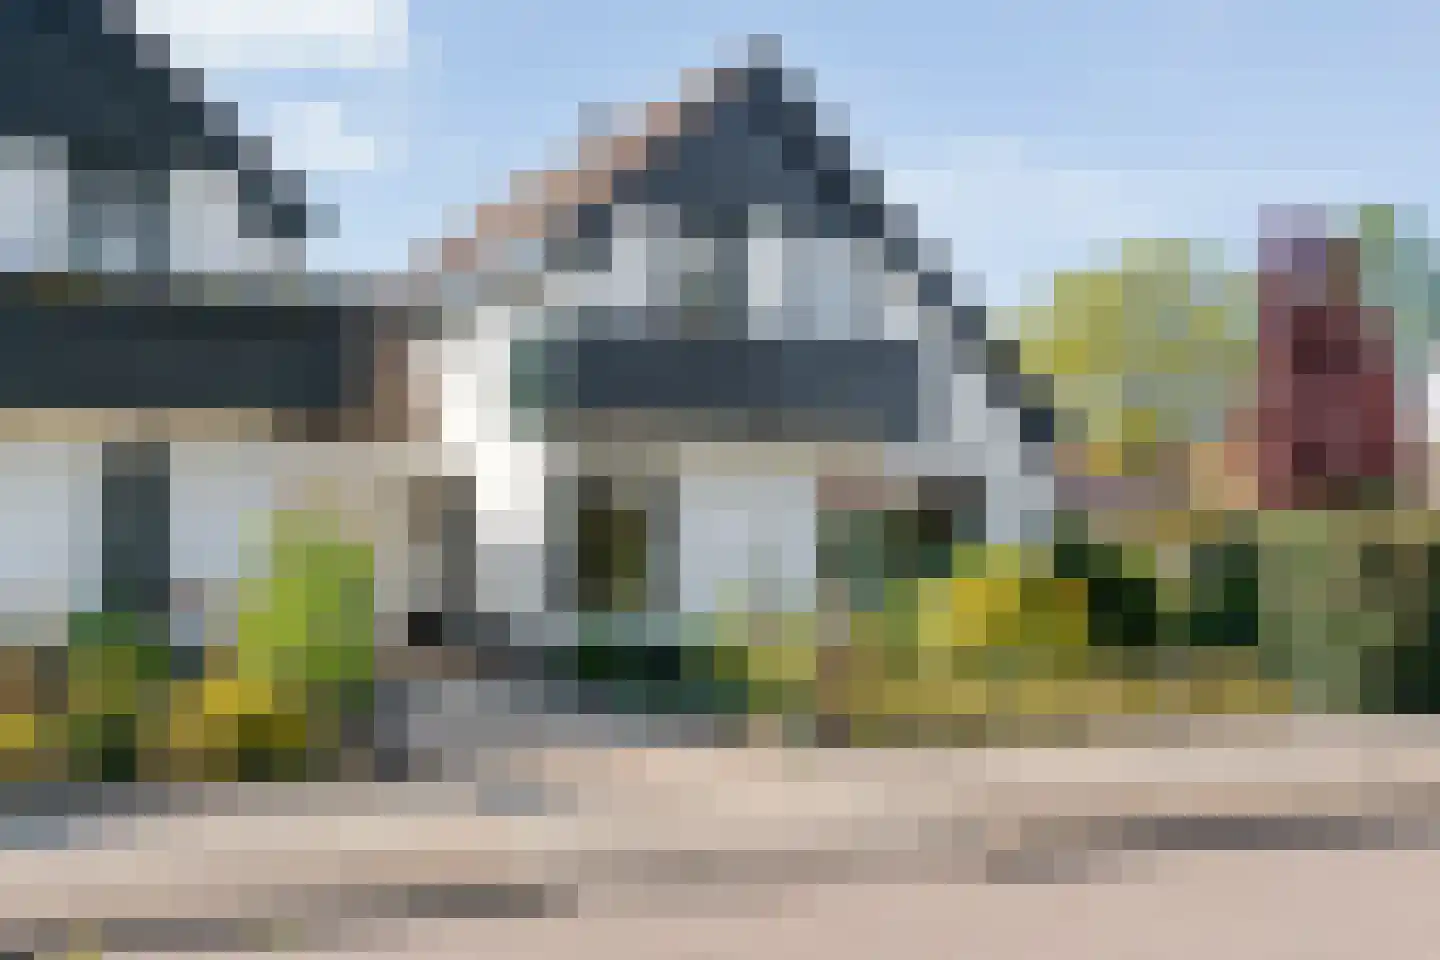
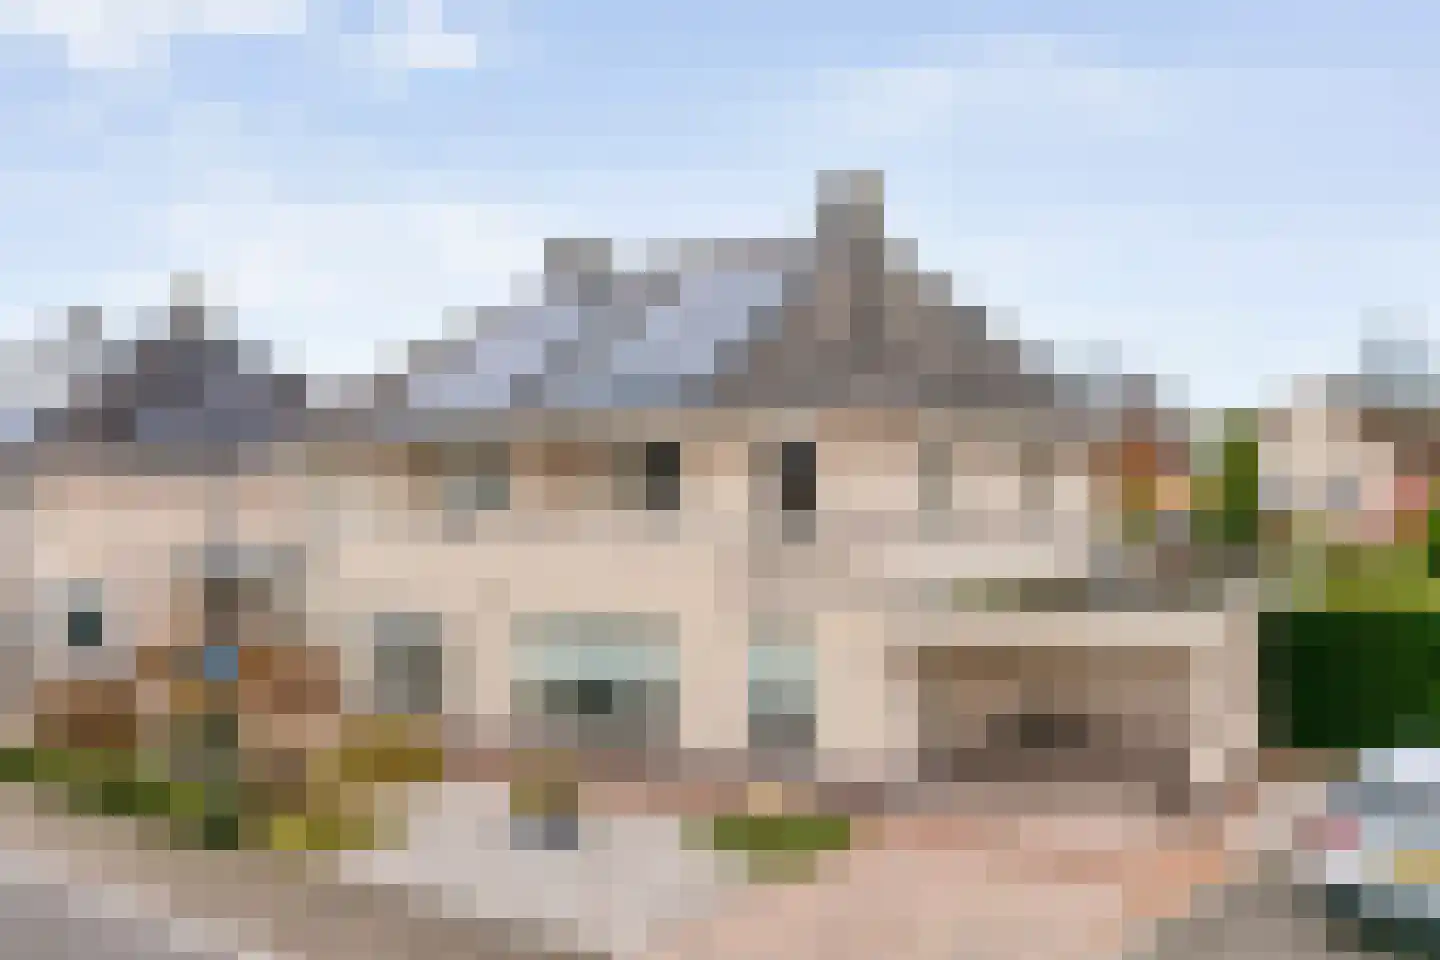
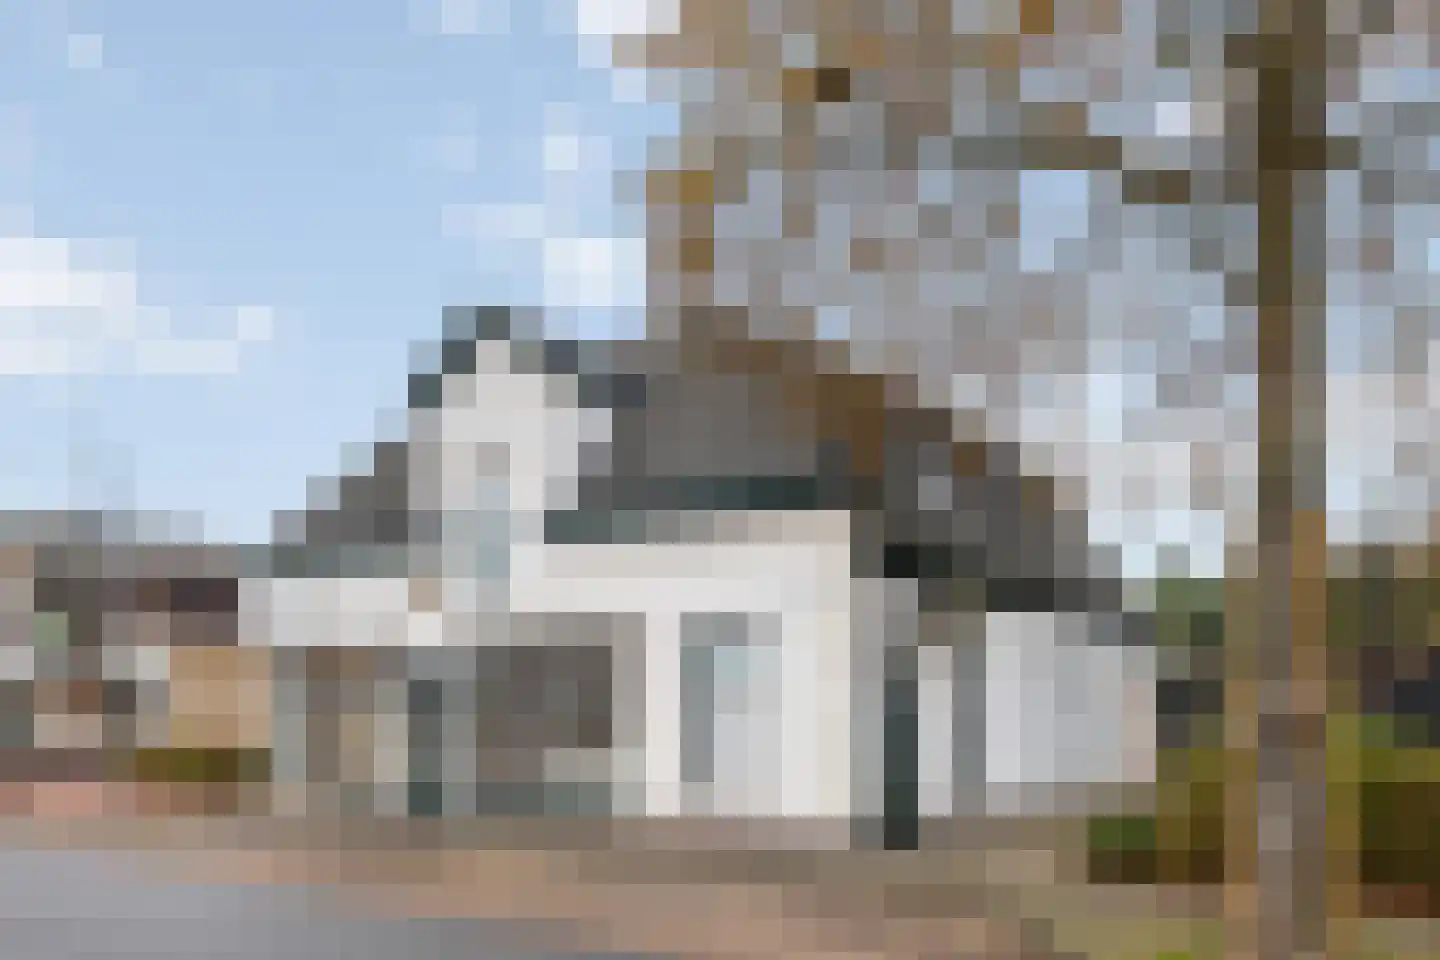
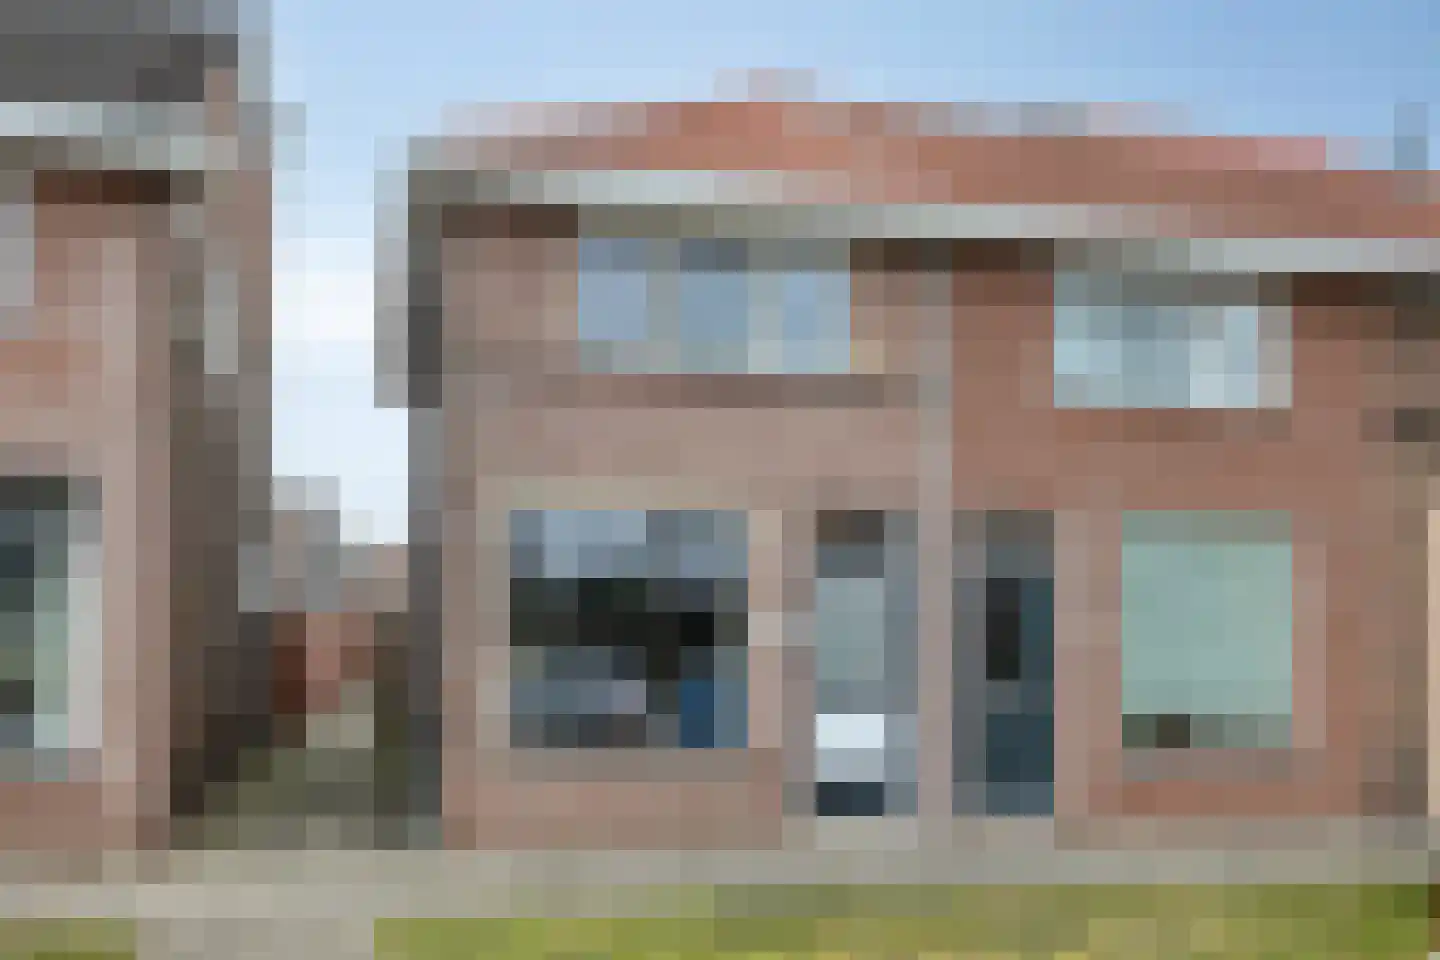
Derckinck 14
7683WZ Den Ham
€ 675.000 k.k.
BSave as favorite- Living area
- 199 m²
- Land area
- 495 m²
- Bedrooms
- 6
-
- Available
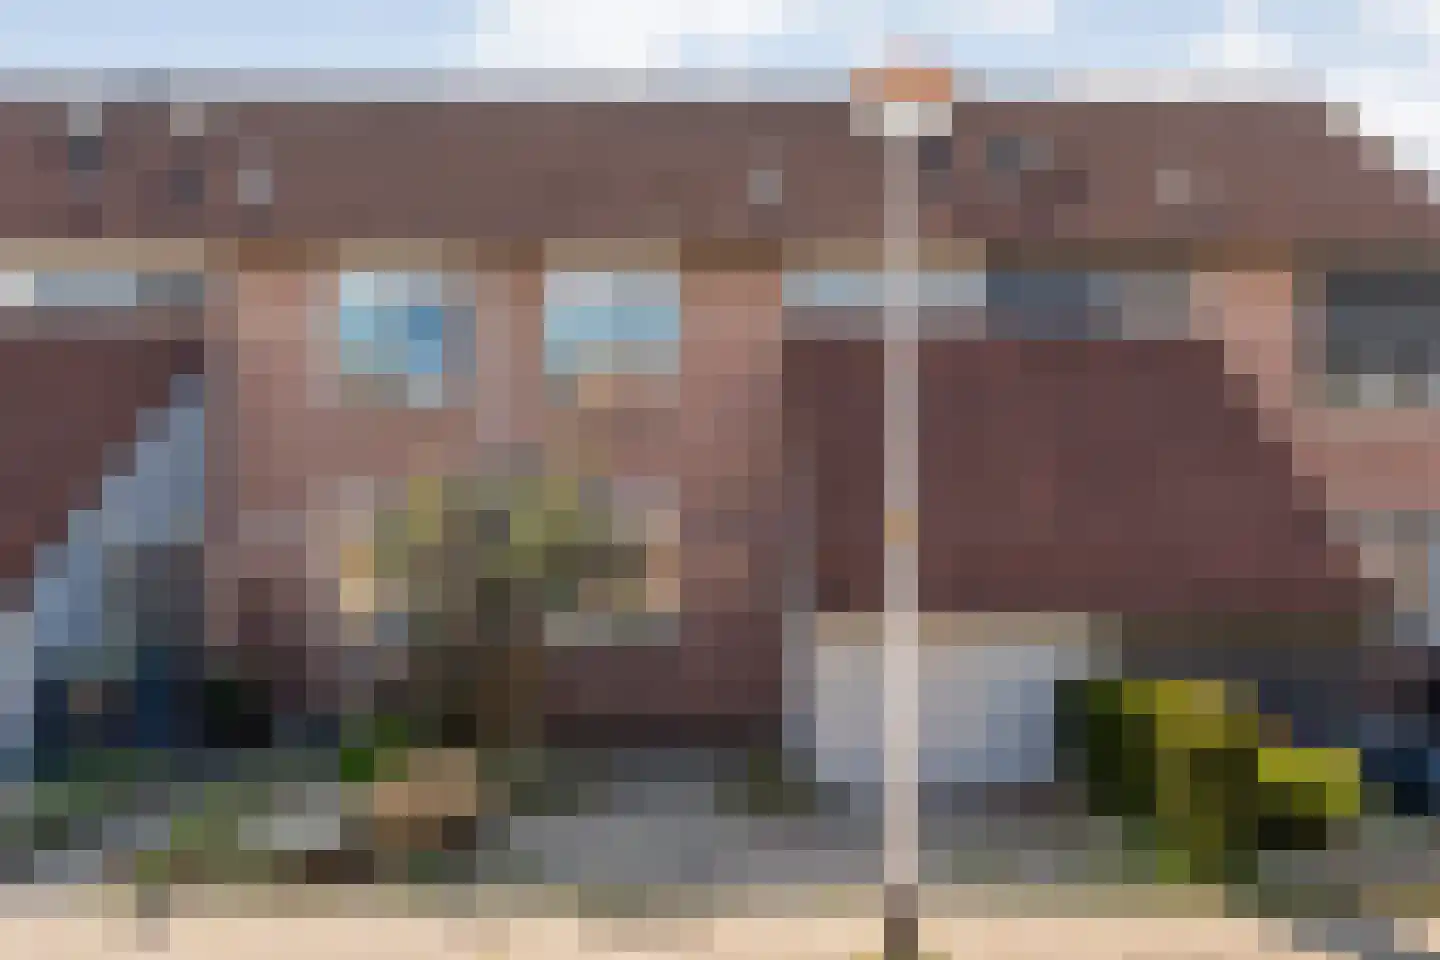
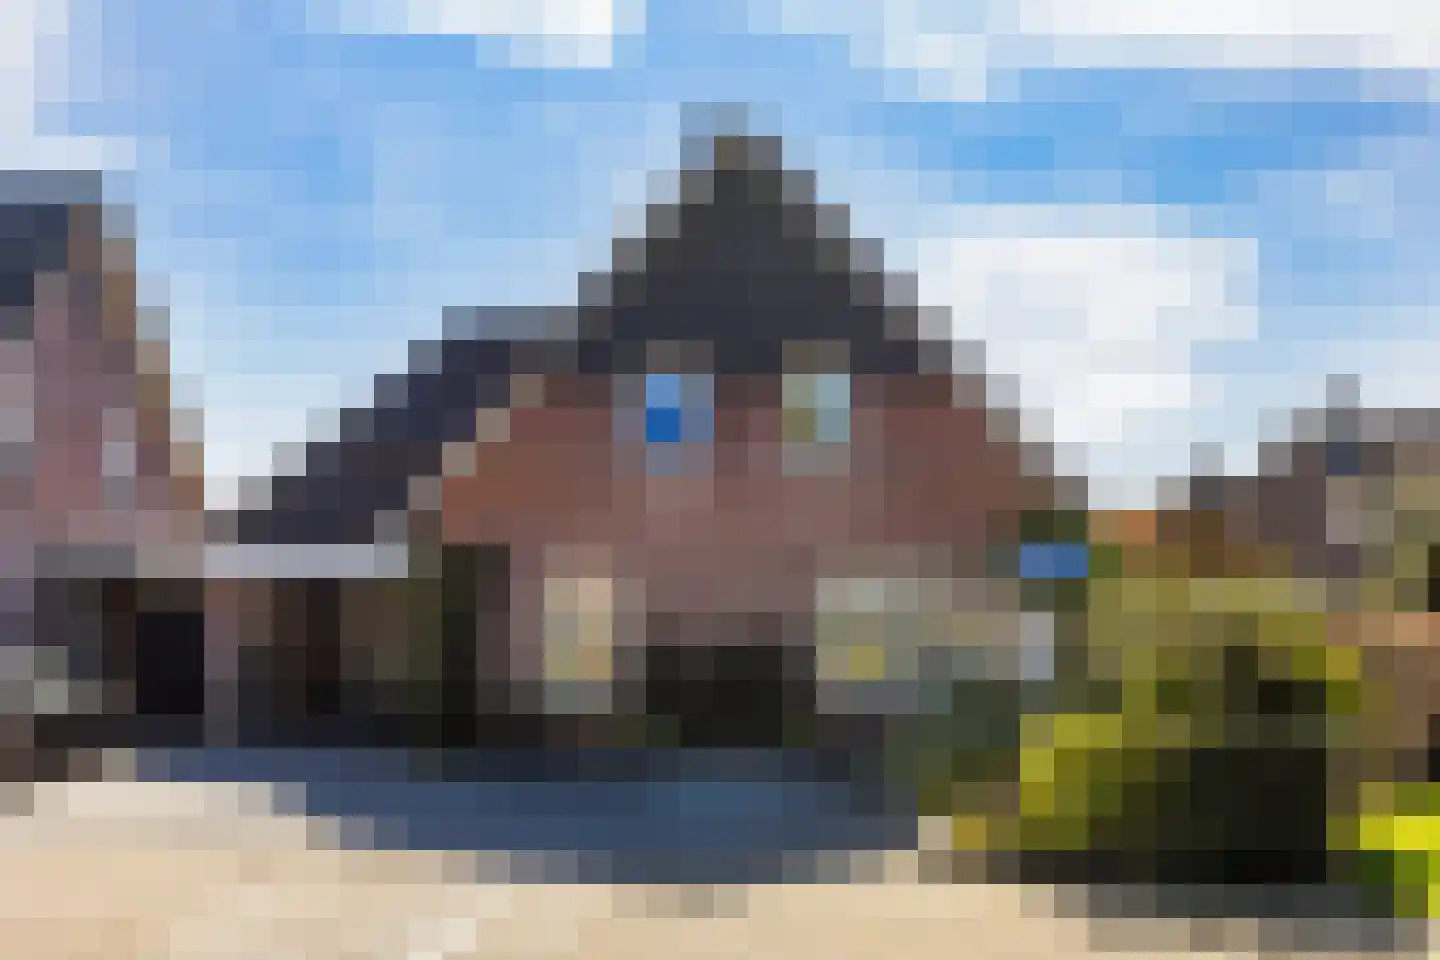
Meersendijk 26
7683PC Den Ham
€ 899.000 k.k.
BSave as favorite- Living area
- 235 m²
- Land area
- 4375 m²
- Bedrooms
- 4
-
- Available
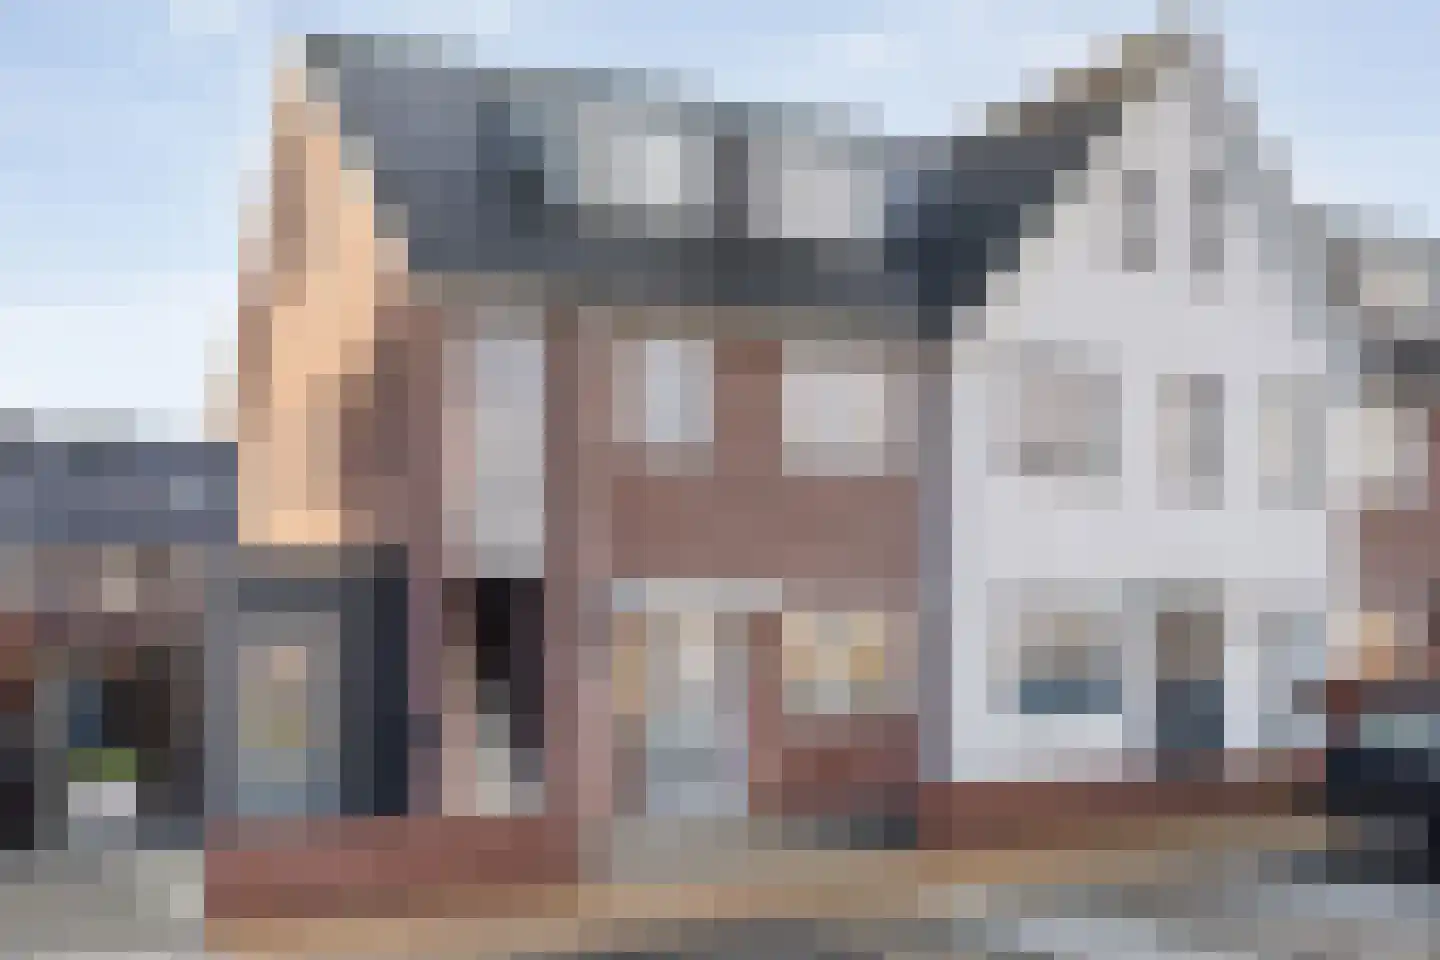
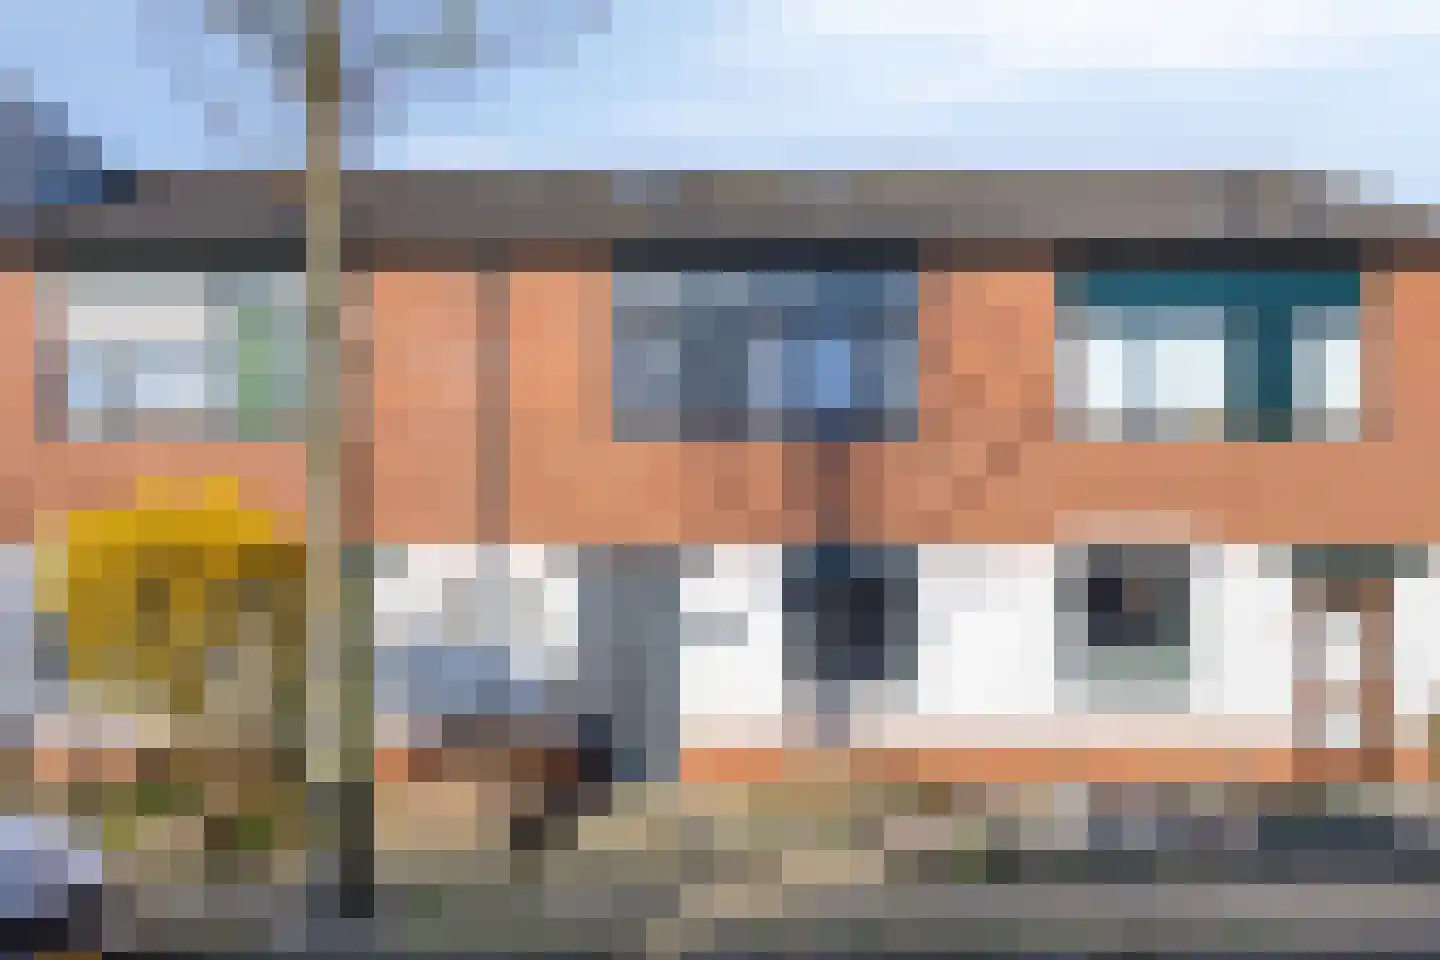
Thomas Ainsworthstraat 2
7442AZ Nijverdal
€ 489.000 k.k.
€ 3.349/m²
BSave as favorite- Living area
- 146 m²
- Land area
- 270 m²
- Bedrooms
- 6
-

- Available
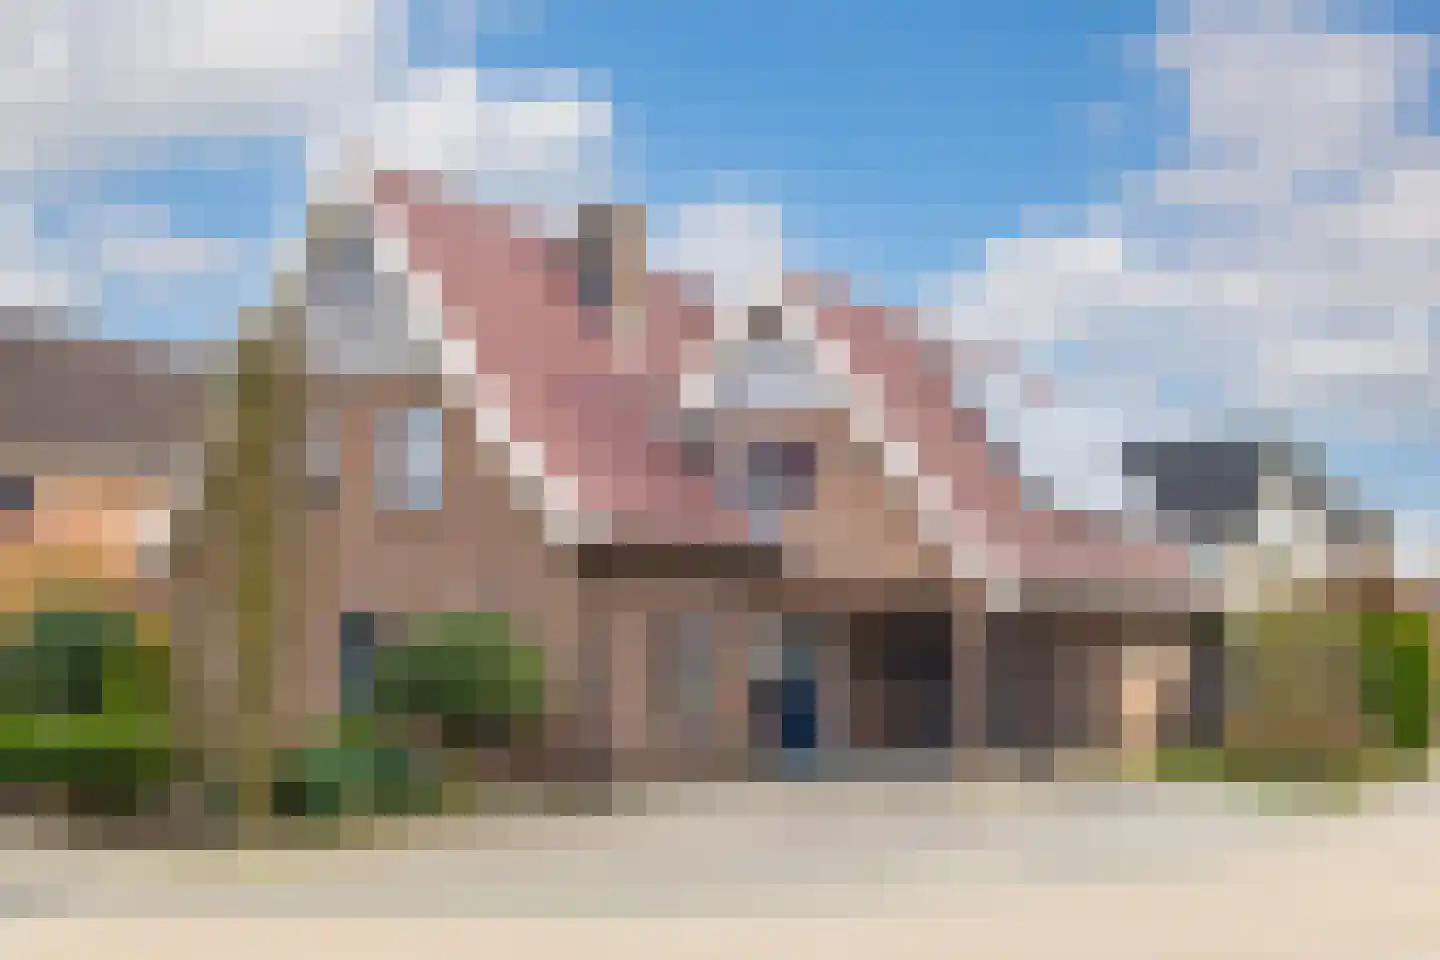
Kluversweg 5
7447JJ Hellendoorn
€ 850.000 k.k.
€ 3.680/m²
CSave as favorite- Living area
- 231 m²
- Land area
- 683 m²
- Bedrooms
- 6
-
- Available
Merelweg 40
7442CB Nijverdal
€ 410.000 k.k.
€ 3.333/m²
CSave as favorite- Living area
- 123 m²
- Land area
- 303 m²
- Bedrooms
- 4
Reviews (90)
Review platforms
BronscoresTotal score
90 total reviews

Funda
70 reviews on Funda

20 reviews on Google
-
Jacques Perkstraat 2
10Het contact met Anita en Kelly verliep erg prettig. We kregen goede adviezen van hen en dat gaf ons een fijn en vertrouwd gevoel. Het was erg fijn dat je na een bezichtiging een reactie kreeg hoe de bezichtiging verliep. Kortom we zijn meer dan tevreden. Dankjewel Anita en Kelly.
-
Wiegersstraat 12
9Dit was de eerste keer dat wij een huis te koop aanboden. Misschien iets meer begeleiding/ondersteuning. Want al met al heeft ons huis lang (bijna 1 jaar) te koop gestaan voordat het definitief verkocht was. Dus tussendoor misschien meer contact is wel wenselijk.
-
Pimpernel 24
9We hadden prettig contact met Anita en Kelly. We werden goed op de hoogte gehouden van alle informatie rond de verkoop van ons huis en ze hebben ons veel werk uit handen genomen.
-
Morgenster 34
10Wij zijn erg tevreden over de begeleiding door Reggedael bij de verkoop van onze woning. Het hele proces verliep duidelijk en professioneel, en we werden goed op de hoogte gehouden. Dankzij hun expertise hebben ze het maximale uit de verkoop weten te halen. Zeker een aanrader!
-
Nijveldserf 17
10Fijn contact met Anita en Kelly van Reggedael Makelaar. Korte lijntjes, snelle reactie op vragen en goede tips gekregen voor het verkoopklaar maken van de woning. Wij zijn 100% tevreden over de enthousiaste begeleiding bij de verkoop van het mooie appartement van onze moeder.
-
Reehorst 13
9Van een makelaar verwachten we professionele, deskundige en integere begeleiding. Anita Leestemaker van Reggedael Makelaardij voldeed daar in alle opzichten aan. We zijn zeer tevreden over de manier waarop ze ons heeft begeleid en geadviseerd bij de verkoop van onze woning.
-
Kruidenlaan 27
9Contact verliep prettig via bezoek, telefoon, WhatsApp en mail. Fijne service van advies wat betreft styling ed.
-
Anijs 14
10Erg vriendelijk. Communicatie verloopt vlot. Behulpzaam, snel antwoord op vragen. Ben erg tevreden.
-
de Marsjes 72
9Als dorpsgenoten zit je gelijk al in een 'ons-kent-ons'-modus, wat de communicatie en verstandhouding op een prettige manier ondersteunt. Maar daarnaast wordt dit gekoppeld aan een professionele en zakelijke benadering en behandeling van de situatie. Al deze aspecten op één hoop gooiend, vind ik dat de ondersteuning van het Reggedael-team prima was. Anita en Kelly hartelijk dank hiervoor!
-
Anemoon 19
9Een persoonlijke aanpak van de opdracht tot verkoop. Goede begeleiding en nuttige overwegingen worden aangedragen. Wat ons betreft TOP!
-
Kanaaldijk-noord 59
8We zijn erg fijn geholpen door Reggedael. We vonden het deskundige en fijne mensen om ons huis mee te kopen en daarna ook te verkopen.
-
Timmermansstraat 20
9Reggedael is een fijne makelaar en snap exact de klantvraag. Snelle en duidelijke communicatie. Echt een fijne club!!
-
Potgieterstraat 22
10Alles was super geregeld. Contact was prettig en duidelijk. Ze zijn goed bereikbaar voor vragen en denken graag met je mee.
-
Erve Boomcate 1
9Translated by AIFriendly and personal approach. Expert and involved. Good information during the sales process.
-
Rossinistraat 77
10Translated by AIWe are very pleased with Reggedael. The presentation was super and we fell in love with the house again ;) Our wishes were taken into account properly and the communication was clear and pleasant. Definitely a recommendation!
-
Helmkruidlaan 3
8Translated by AIWe are further very satisfied with the contact with the real estate agents of reggedeal. They are friendly and keep you well informed everywhere. And they keep their appointments well. And think about everything else well too.
-
Anemoon 16
7Translated by AIWas well assisted, among other things by regularly sending houses and received good explanations. In all facets of the purchase and sale it was prime, among other things the nice photoshoot.
-
Prins Mauritsstraat 18
9Translated by AIExcellent guidance, clear advice and same process. Anita and her team are ready for questions and/or advice. Get clear answers to questions. Very professional team.
-
Zufzuf
10Translated by AIFast service, friendly staff. Valuation for new home very professionally carried out!
-
Portlandweg 6
10Translated by AIAnita and Kelly have provided us with excellent guidance and valuable tips. Since the house also has a practice space, it is located in a slightly different market, which makes it a special home in a beautiful spot in Nijverdal. Thanks to the expert help and fine pointers from these two ladies, the sale went surprisingly smoothly and effortlessly. We are very pleased with their dedication and guidance!