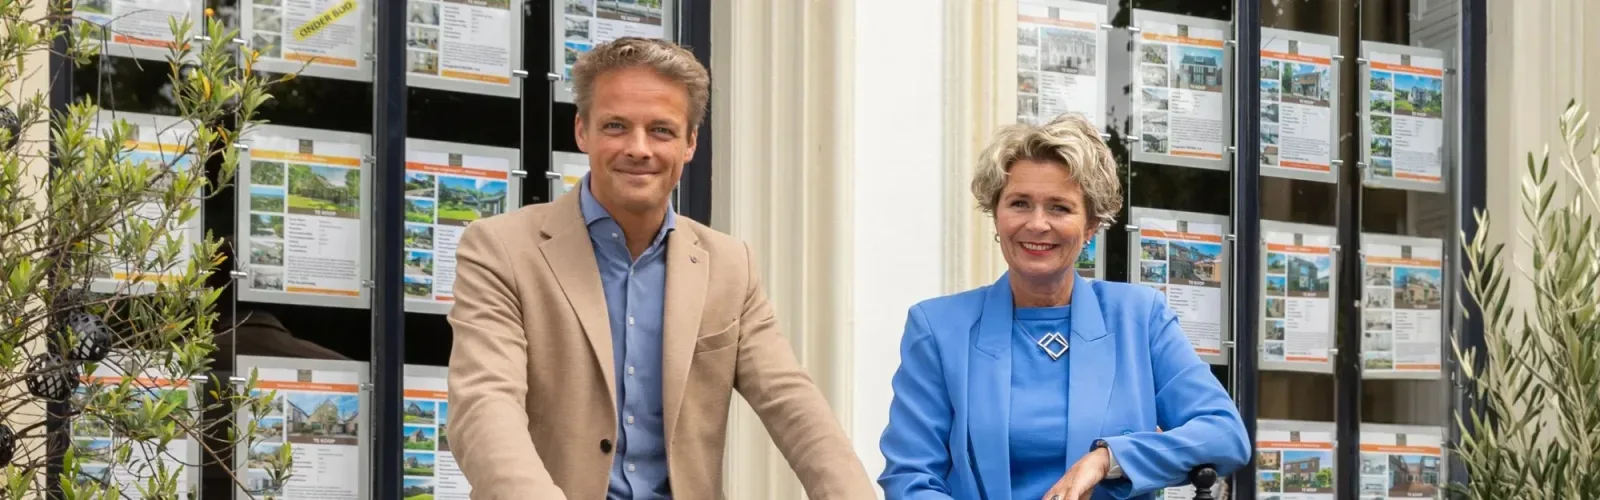
Xtra Makelaardij
"Extra Attention, Extra Result!"

Xtra Real Estate stands for a differentiated approach in which each sale is unique. We combine years of experience with up-to-date market knowledge and modern sales methods to present your home in the best possible way. Our clients appreciate our personal, flexible and professional approach, with passion, honesty and expertise at the center. We are fully certified, affiliated with the NVM and have a broad network. Our experience as an a...
Current housing stock
-

- Available
Largostraat 22
3223PN Hellevoetsluis
€ 499.900 k.k.
€ 4.201/m²
ASave as favorite- Living area
- 119 m²
- Land area
- 173 m²
- Bedrooms
- 3
-

- Available
Bever 4
3225RA Hellevoetsluis
€ 349.500 k.k.
€ 3.361/m²
BSave as favorite- Living area
- 104 m²
- Land area
- 97 m²
- Bedrooms
- 3
-

- Available
Aalbrecht van Beijerenstraat 91
3222CA Hellevoetsluis
€ 319.500 k.k.
€ 4.096/m²
DSave as favorite- Living area
- 78 m²
- Land area
- 95 m²
- Bedrooms
- 3
-

- Available
Parkweg 1 B353
3221LV Hellevoetsluis
€ 419.000 k.k.
BSave as favorite- Living area
- 99 m²
- Land area
- 381 m²
- Bedrooms
- 3
-

- Available
Boulevard 5
3181NX Rozenburg
€ 459.000 k.k.
BSave as favorite- Living area
- 95 m²
- Land area
- —
- Bedrooms
- 2
-

- Available
Nieuwe Zeedijk 1 K306
3221LZ Hellevoetsluis
€ 369.000 k.k.
BSave as favorite- Living area
- 103 m²
- Land area
- 448 m²
- Bedrooms
- 3
Reviews (82)
Review platforms
BronscoresTotal score
82 total reviews

Funda
60 reviews on Funda

22 reviews on Google
-
P C de Vinckstraat 9
10Duidelijk contact ,goede begeleiding Eerlijke en Vriendelijke makelaars Kundig en goed advies ,veel werk voor ons gedaan door zoë
-
Hazelaar 33
10Wat zijn wij tevreden met jullie geboden hulp en begeleiding. veel advies en altijd alle tijd. zulke lieve mensen. Die meedenken en heel erg betrokken zijn. een heel fijn, geduldig, lief en deskundig team.
-
Komeet 23
9Een prima contact ook met de mede werkers van de makelaar niks is teveel. Als er vragen waren werden deze beantwoord... Alles bij elkaar een prima makelaar
-
Richella van Mastrigt
10In 2016 positief in contact gekomen met Xtra Makelaardij, wij kochten hier toen ons eerste koophuis. In 2025 was het tijd om dit stekje te verlaten en hebben wij de andere kant bekeken met Xtra Makelaardij. Ook deze kant is ons zeer goed bevallen. Dankbaar voor de enthousiaste inzet, contact en de sneller verkoop van ons huis. Wij zouden jullie zeker aanbevelen. 👍🏻
-
Langemeetstraat 56
10Translated by AIProactive and working in accordance with agreements. Always providing feedback on progress. Thinks along and is flexible.
-
Spoorbaan 149
10Translated by AITop real estate agent, done multiple deals, everything always went as desired, true recommendation for buying/selling a property
-
Dibbetzplantsoen 50
10Translated by AIthe contact went very well. The viewings were planned within a week. A very good and friendly real estate agent.
-
Citroenvlinder 23
9Translated by AIGood approach, nice photos and film made. A bit more expensive but it was worth it. Only a pity that Stephanie is no longer there.
-
v Leijdenstraat 10
10Translated by AIXTRA is easy to reach by phone or e-mail. Their helpful expertise and they think with you. I definitely recommend XTRA Real Estate.
-
G S
10 -
Hoogwerf 4
9Translated by AIFriendly, helpful and above all good communication among each other. That is, I find very important.
-
Albert Schweitzerlaan 29
8Translated by AIGood communication. Expert and friendly staff are always ready to answer your questions.
-
Potgieterstraat 6
9Translated by AIA nice, friendly team that is well coordinated and also provides expert advice. Sincerely thank you at the sales and from the house.
-
Zeegat 140
10Translated by AIVery knowledgeable and friendly team. They were able to answer all my questions at this (for me) non-standard sale. Good follow-up after viewings. Proactive approach when the house was on the market a bit longer. In short, a pleasant collaboration!
-
Moeder Teresalaan 5
10Translated by AIGood service, taking everything out of your hands. Nice feedback and everything well organized. They also help with the extras after the viewings. Nice and clear communication.
-
Rijksstraatweg 208 b
9Translated by AIperfect agent,knowledgeable,nice,good guidance.know what they can and cannot do for the customer
-
Montanusstraat 10
10Translated by AIFrom start to finish, we were always kept up-to-date quickly and fully with everything a seller wants to know. I cannot compare it to other real estate agents, but I have no complaints about XTRA Real Estate and would choose them again without hesitation.
-
Westhilstraat 11
10Translated by AIStephanie and her colleagues have done fantastic work. Excellent guidance throughout the entire sales process. Enormous involvement. We were kept very well informed and they thought along with us. We recommend Xtra Makelaardij more than highly!
-
Wolterbeekstraat 2
10Translated by AISelling a house can be a stressful period. Xtra Real Estate was always there for us to answer questions and reassure us. We were quite apprehensive about the preparations for the photo report and viewings. Both real estate agents were present during the photography to tie up loose ends. This gave us a lot of peace of mind. Our house sold quickly to people whom we wholeheartedly wish well in our former place. We can therefore wholeheartedly recommend Xtra Real Estate...
-
Simon Zwaanpad 5
7Translated by AIHouse was sold quickly Thank you for everything Sad.