
Ruseler & Van Herk Makelaars offers reliable and effective real estate services in Pijnacker. Whether you want to sell, buy or appraise a house, we offer personal attention and professional support. Our experience in new builds, combined with market knowledge, ensures a focused and successful search or sales process. We are certified by several recognized authorities and speak multiple languages, so that we can offer the right solution...
Current housing stock
-

- Available
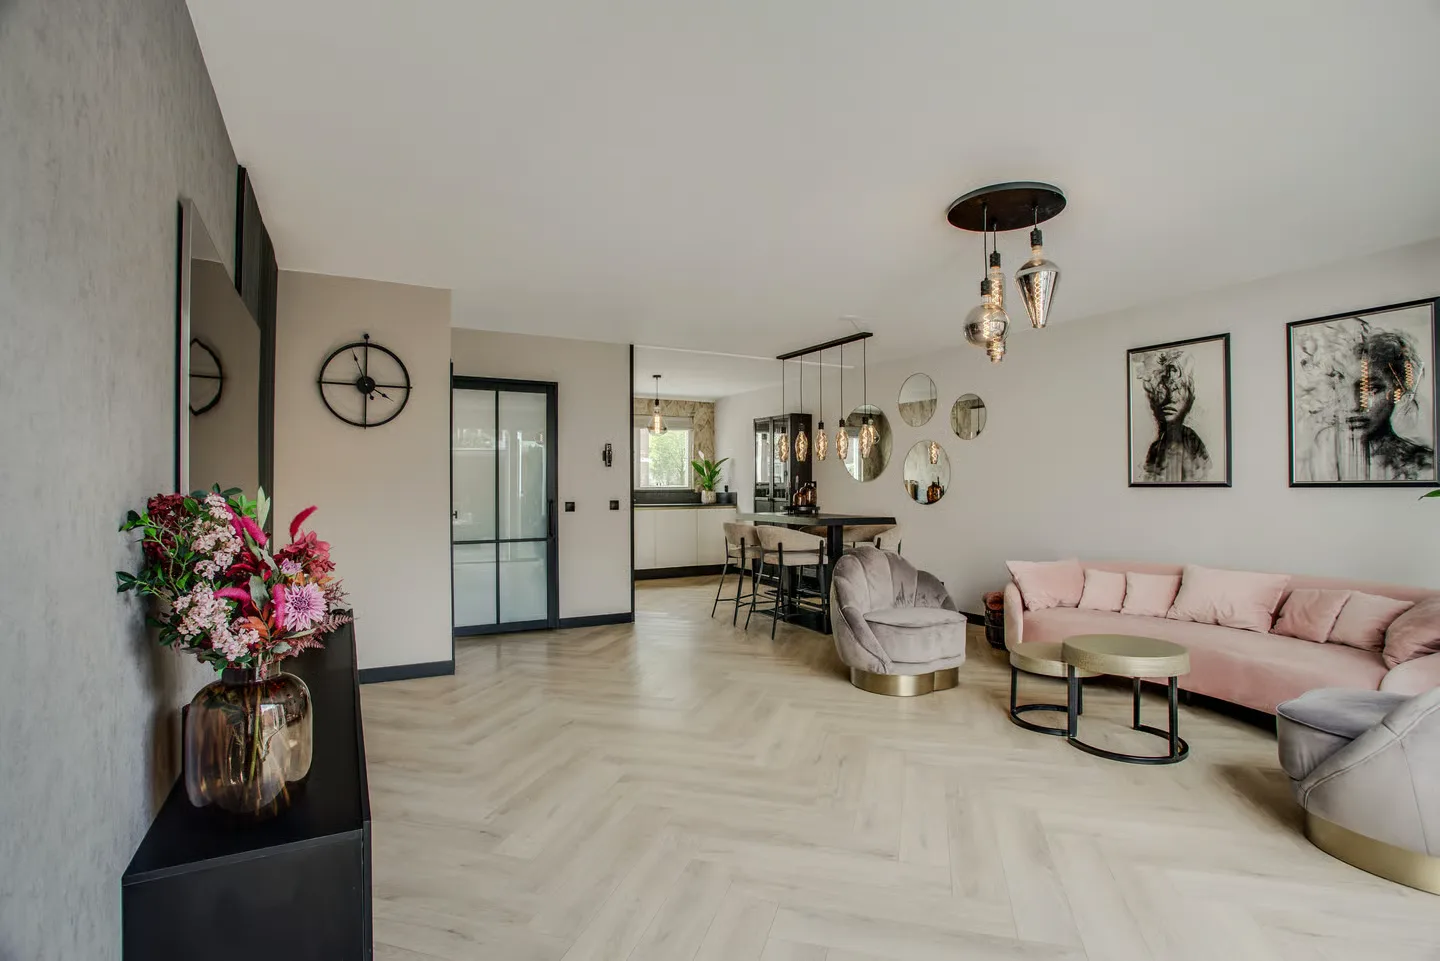
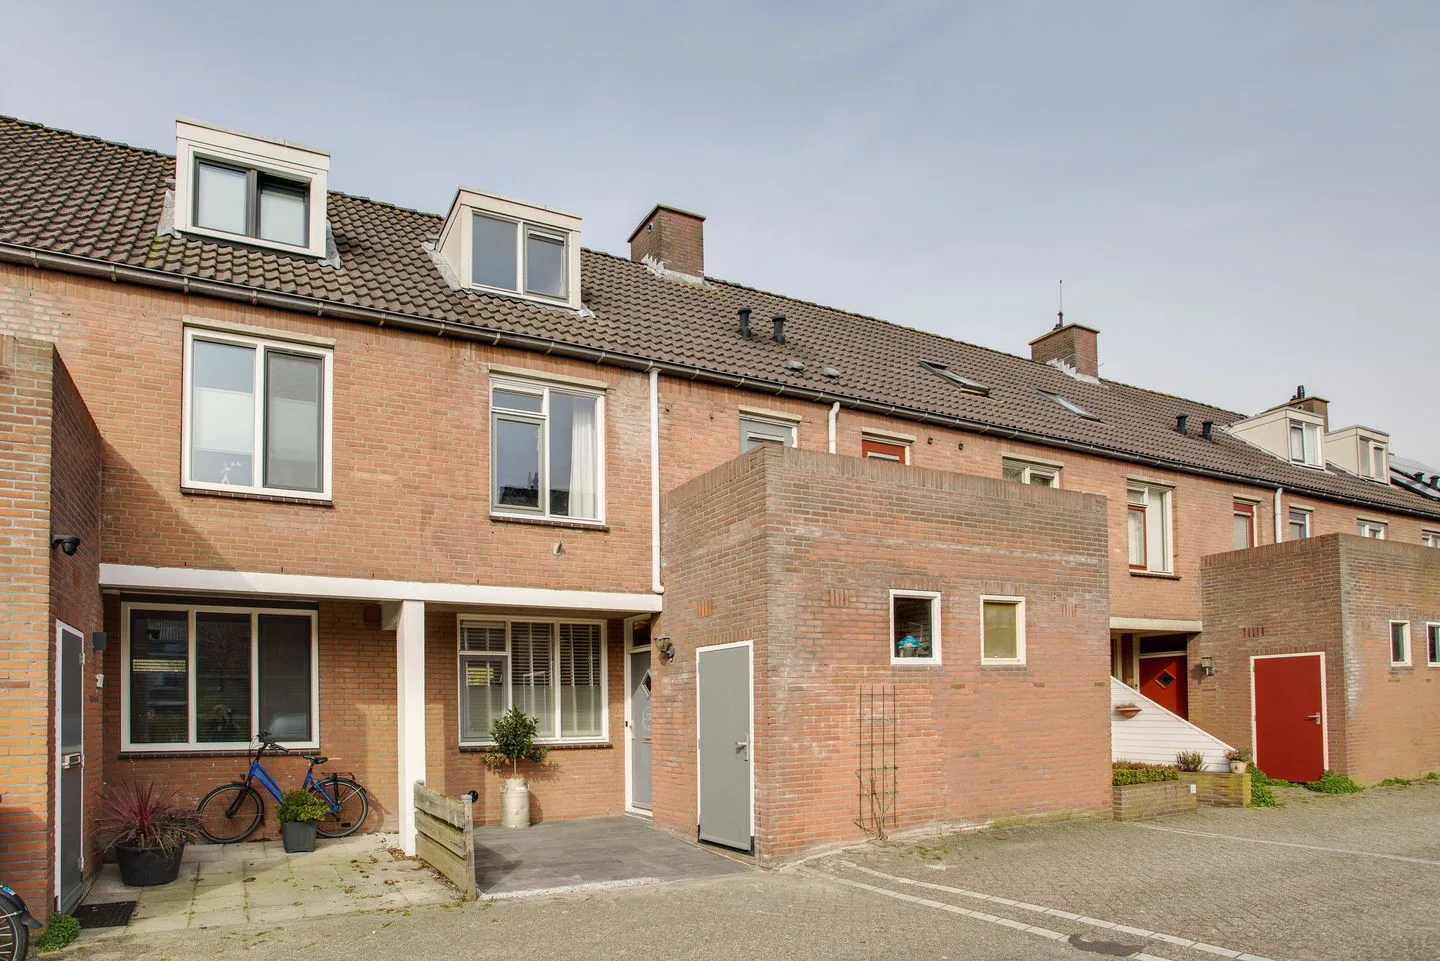
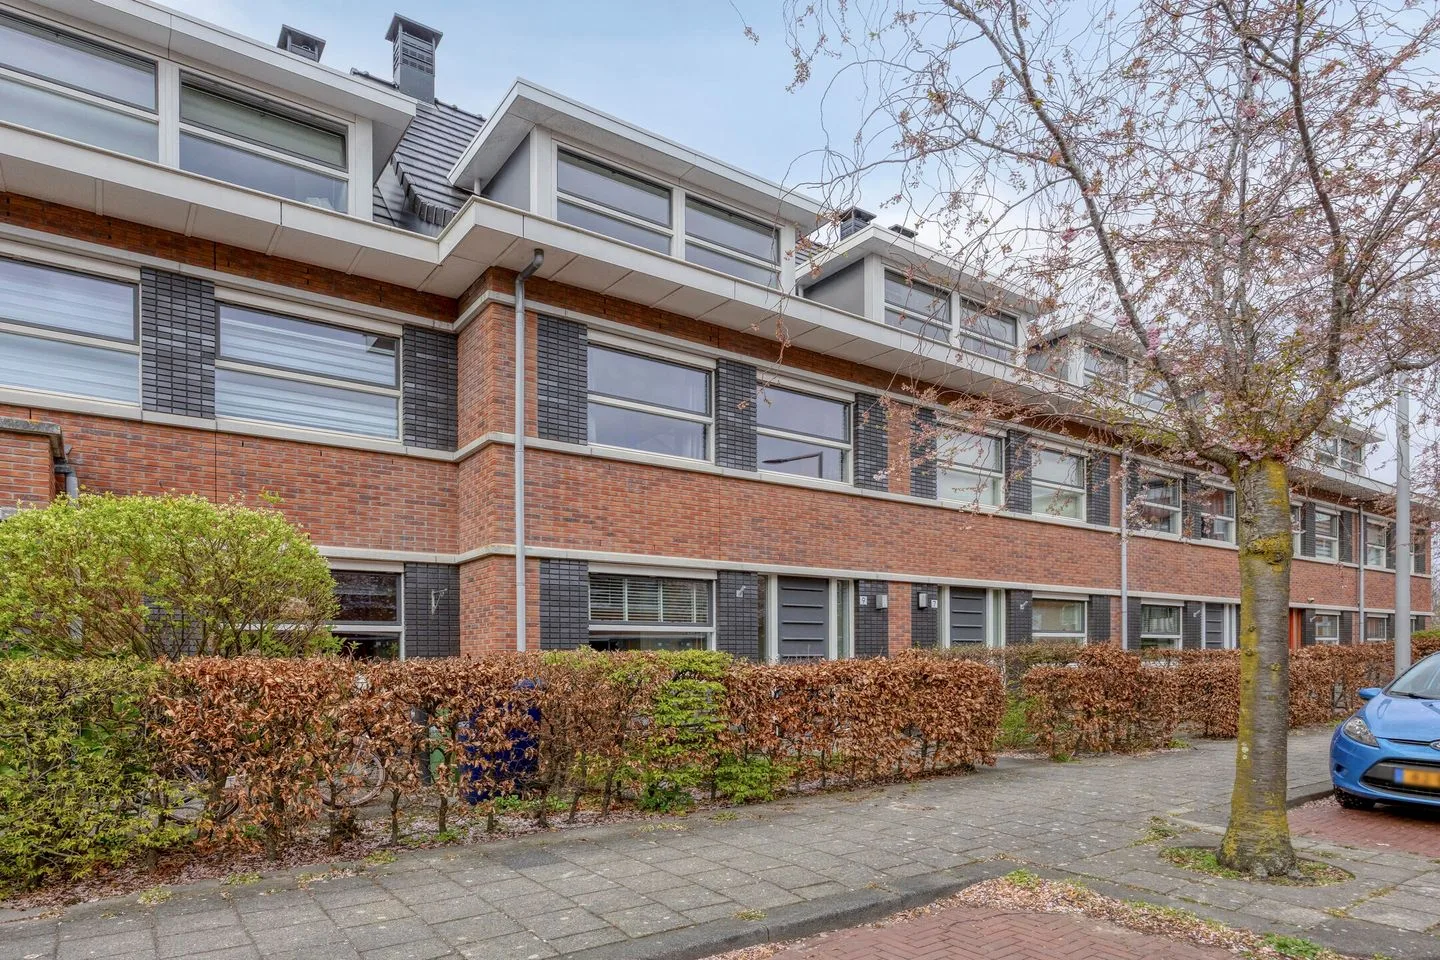
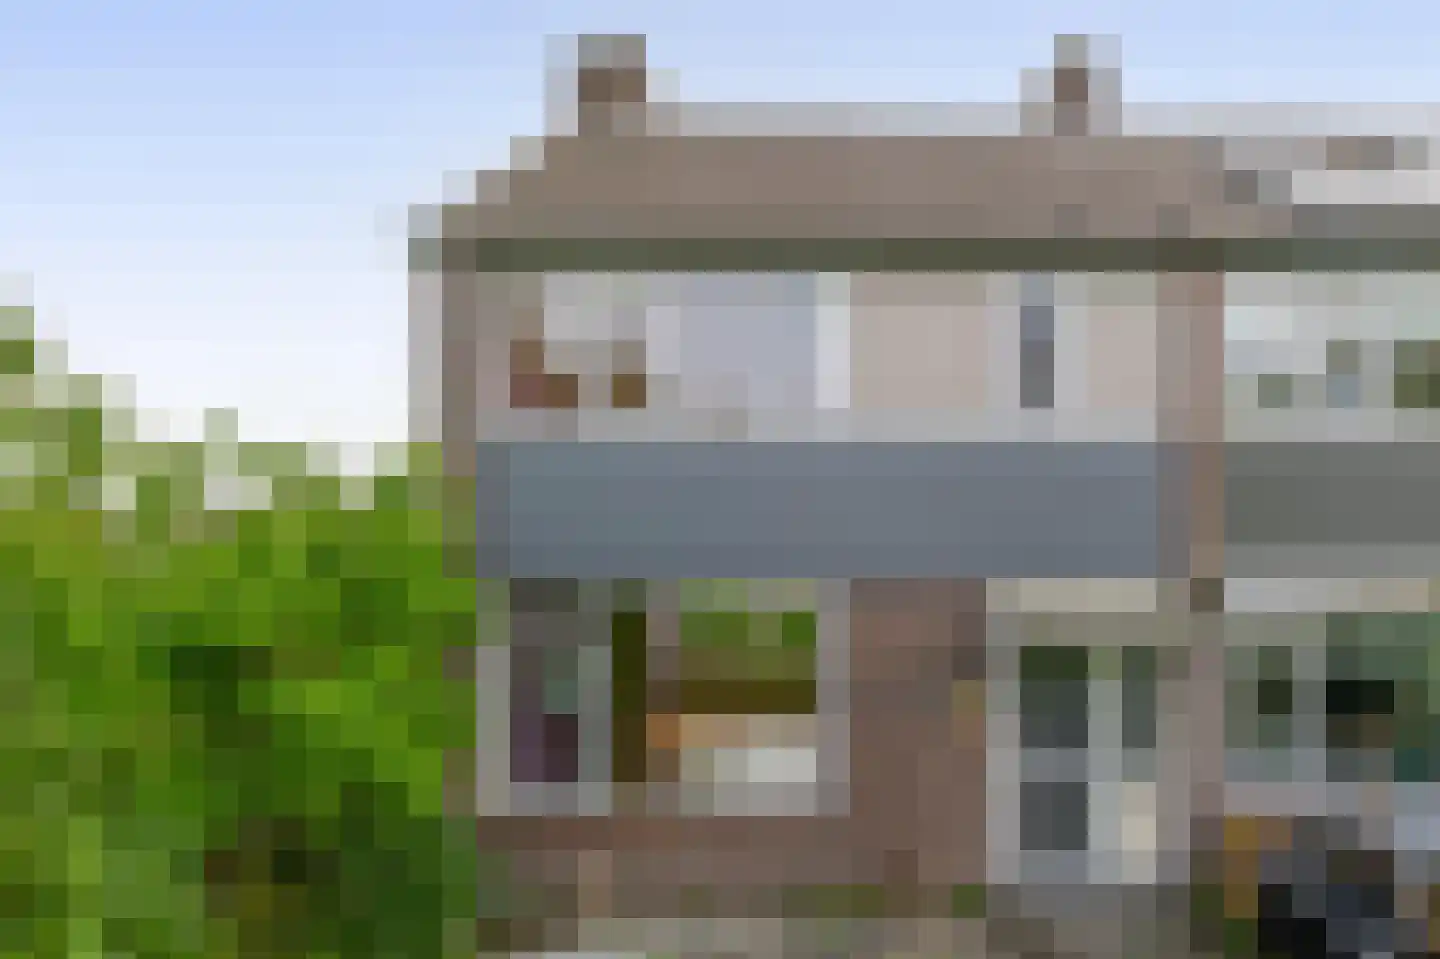
Freule van Dorthsingel 73
2642AX Pijnacker
€ 525.000 k.k.
€ 4.008/m²
ASave as favorite- Living area
- 131 m²
- Land area
- 132 m²
- Bedrooms
- 3
-

- Available
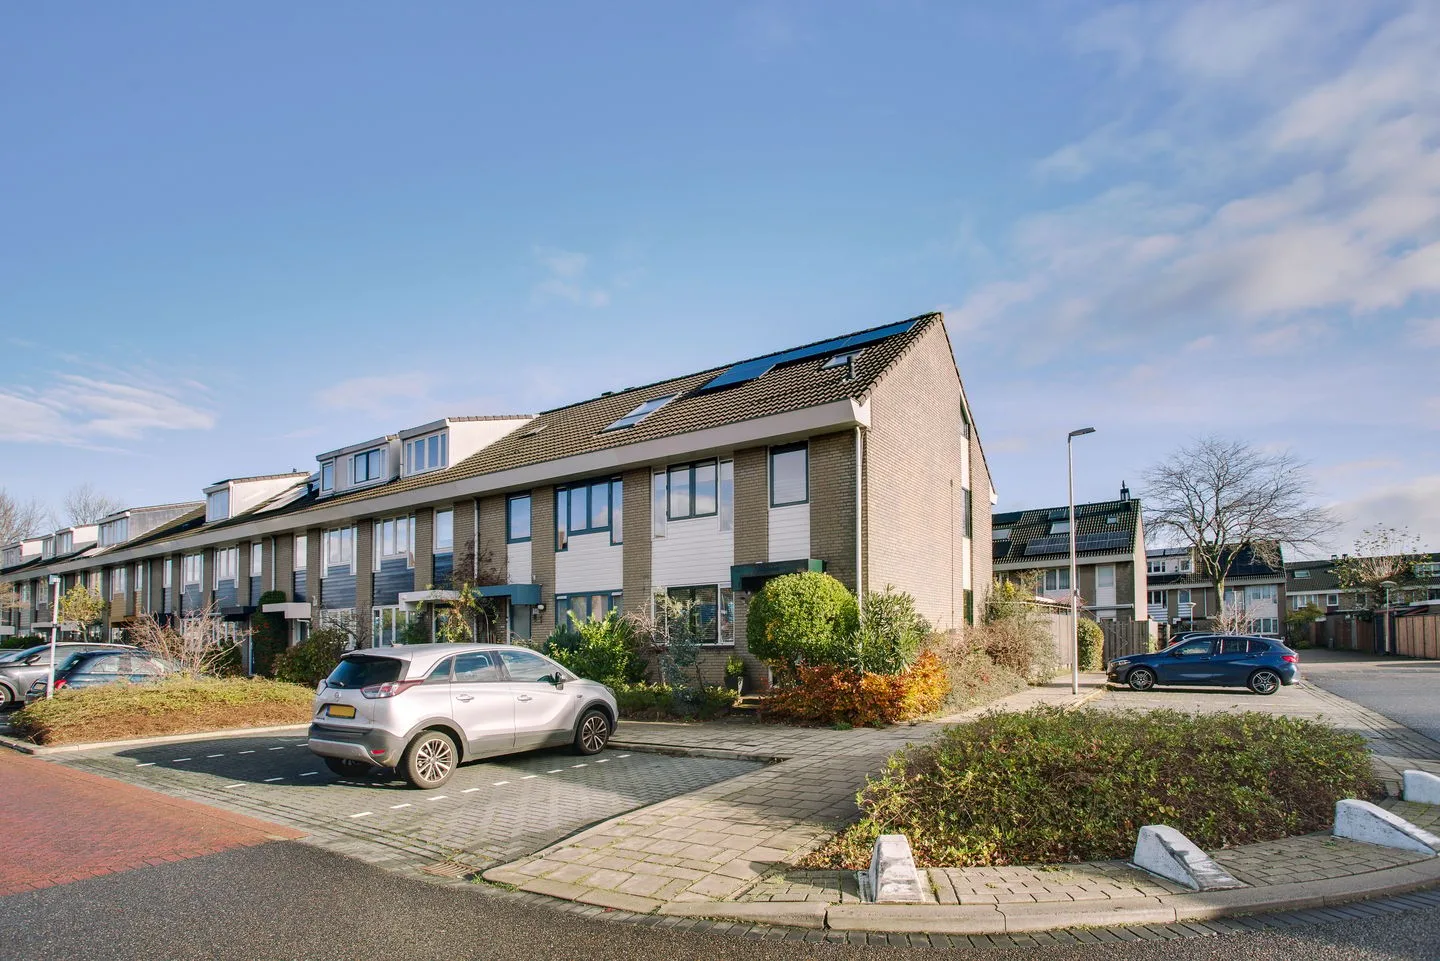
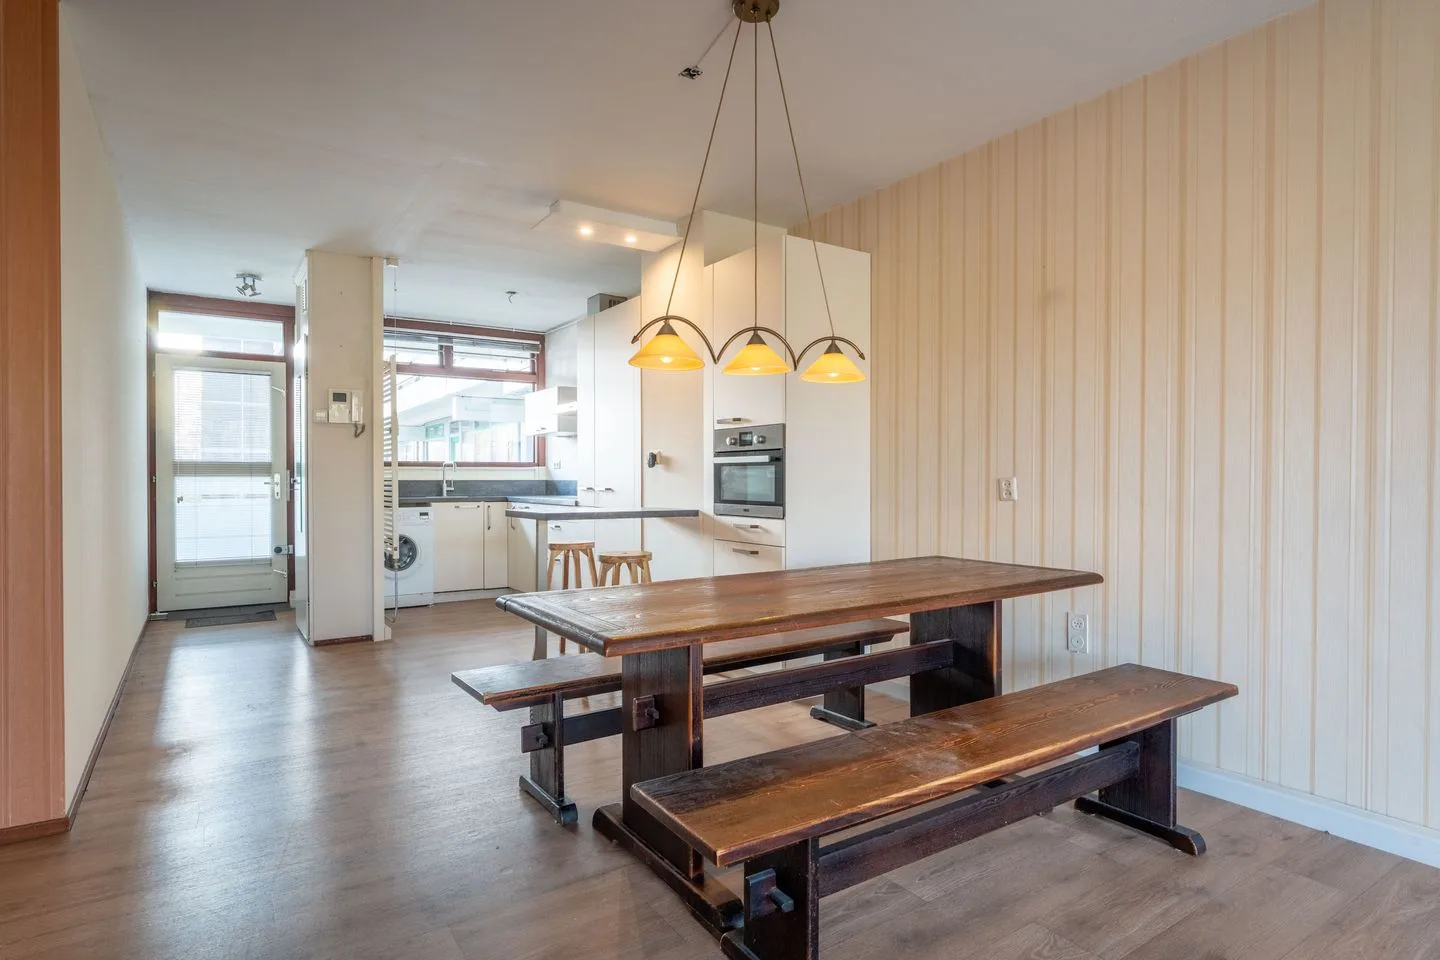
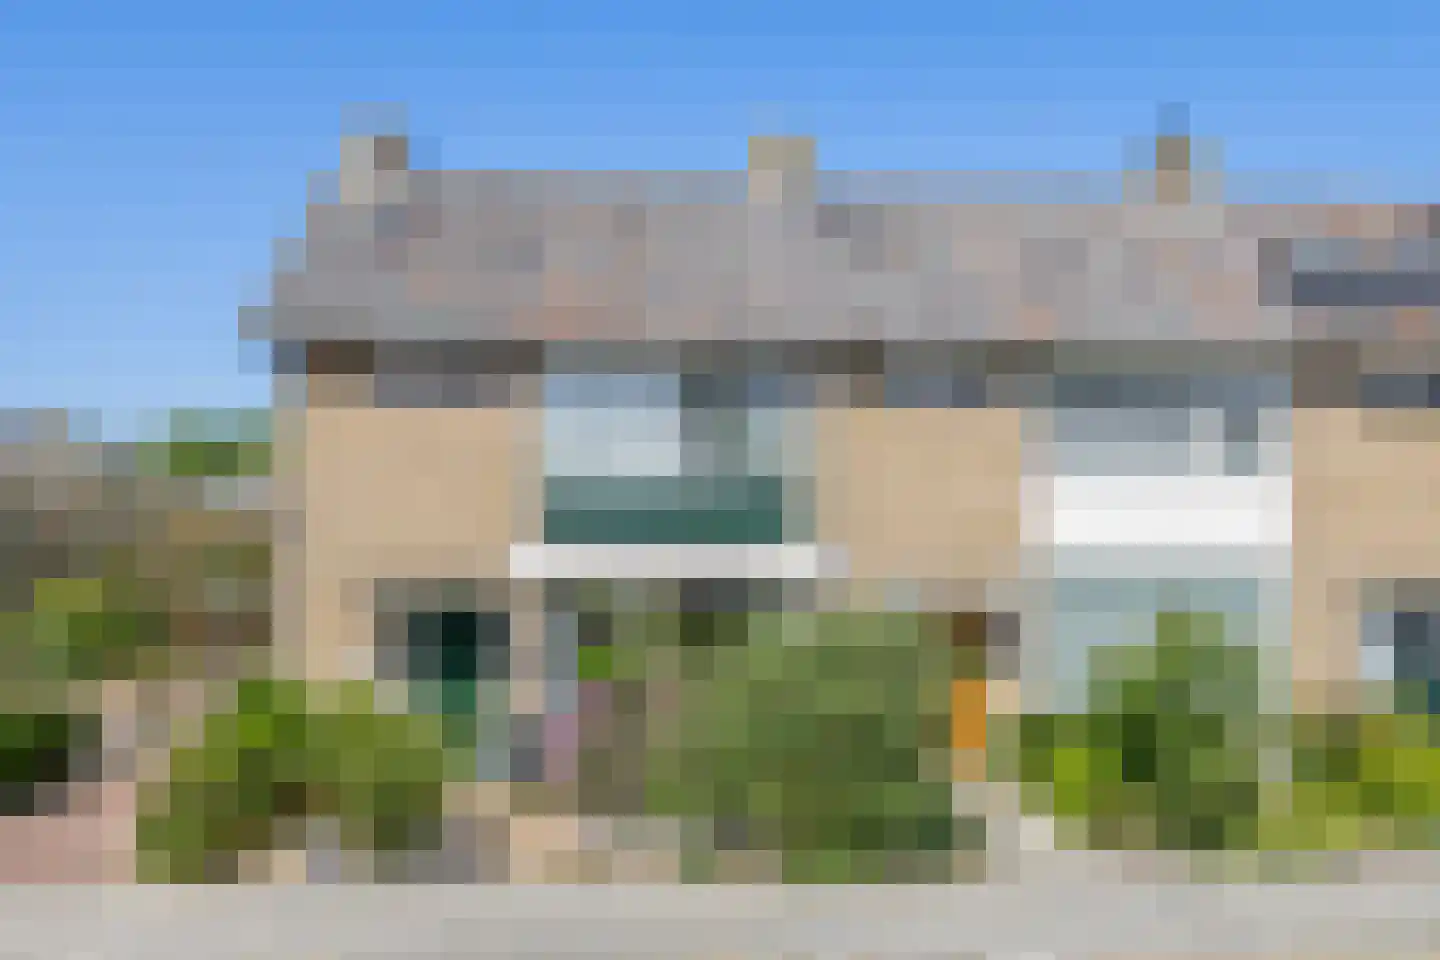
Kuifeend 19
2643MD Pijnacker
€ 725.000 k.k.
ASave as favorite- Living area
- 156 m²
- Land area
- 131 m²
- Bedrooms
- 4
-
- Available
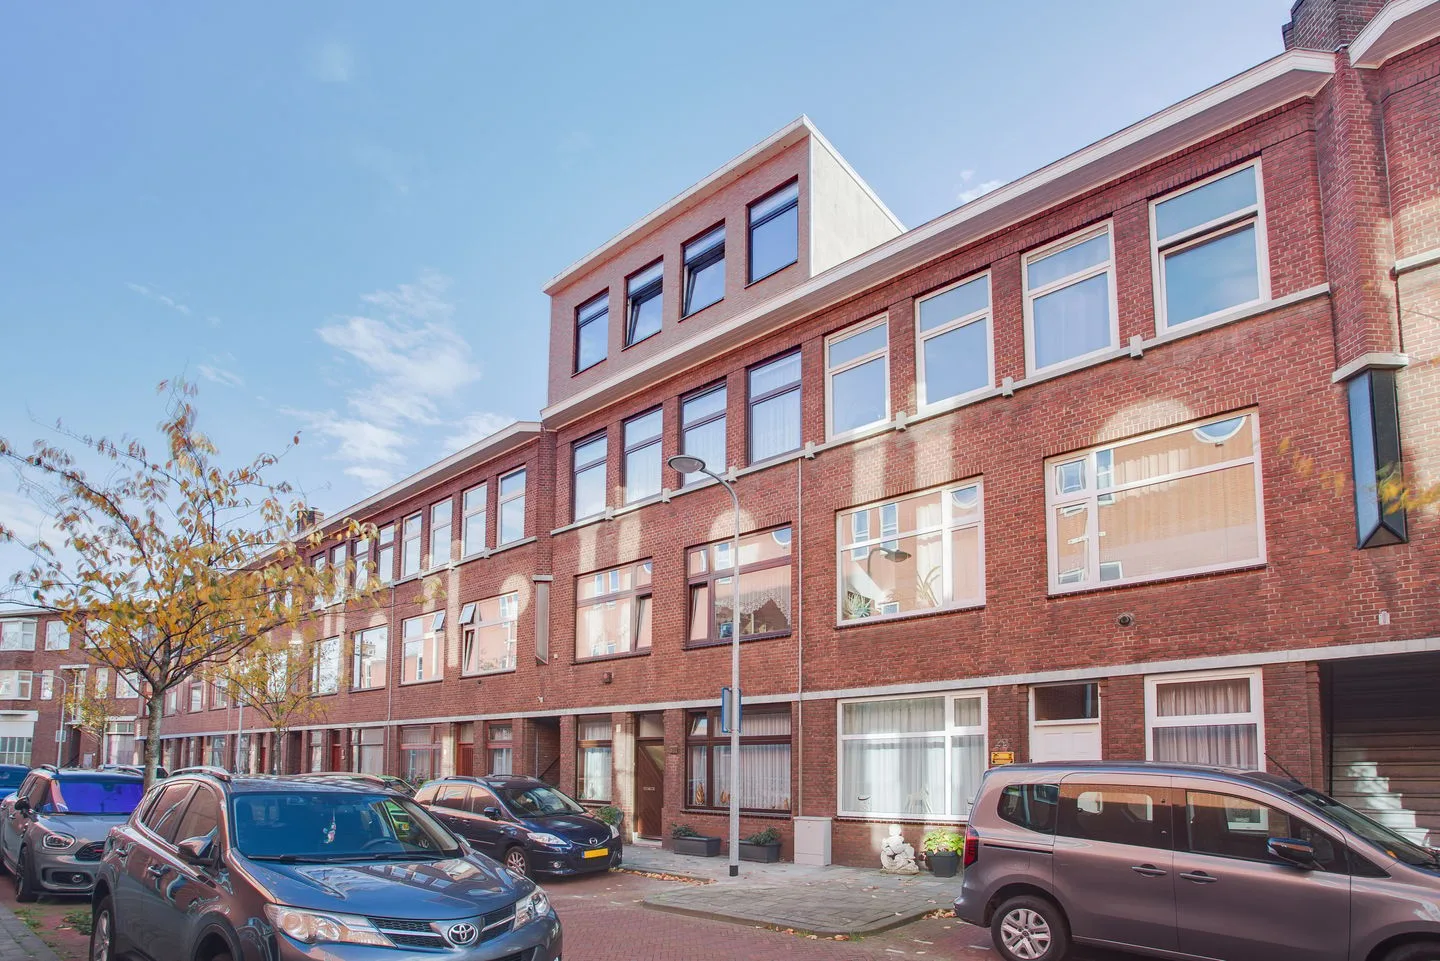
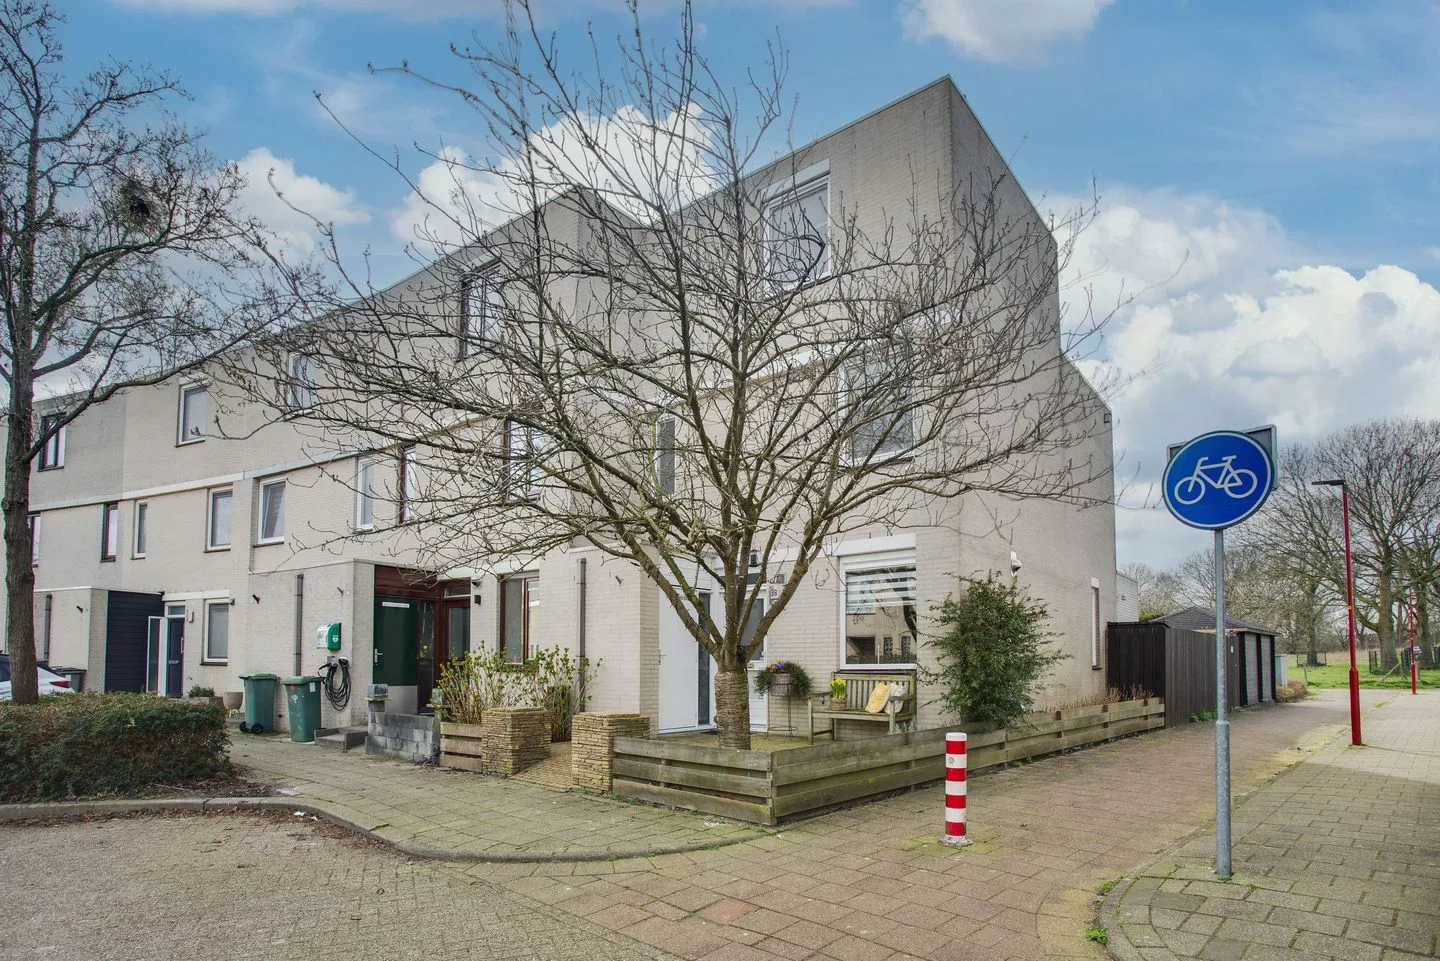
Weigelialaan 15
2641CC Pijnacker
€ 445.000 k.k.
ESave as favorite- Living area
- 108 m²
- Land area
- 145 m²
- Bedrooms
- 4
-

- Available
Thorbeckelaan 107
2641XE Pijnacker
€ 395.000 k.k.
BSave as favorite- Living area
- 88 m²
- Land area
- —
- Bedrooms
- 3
-
- Available
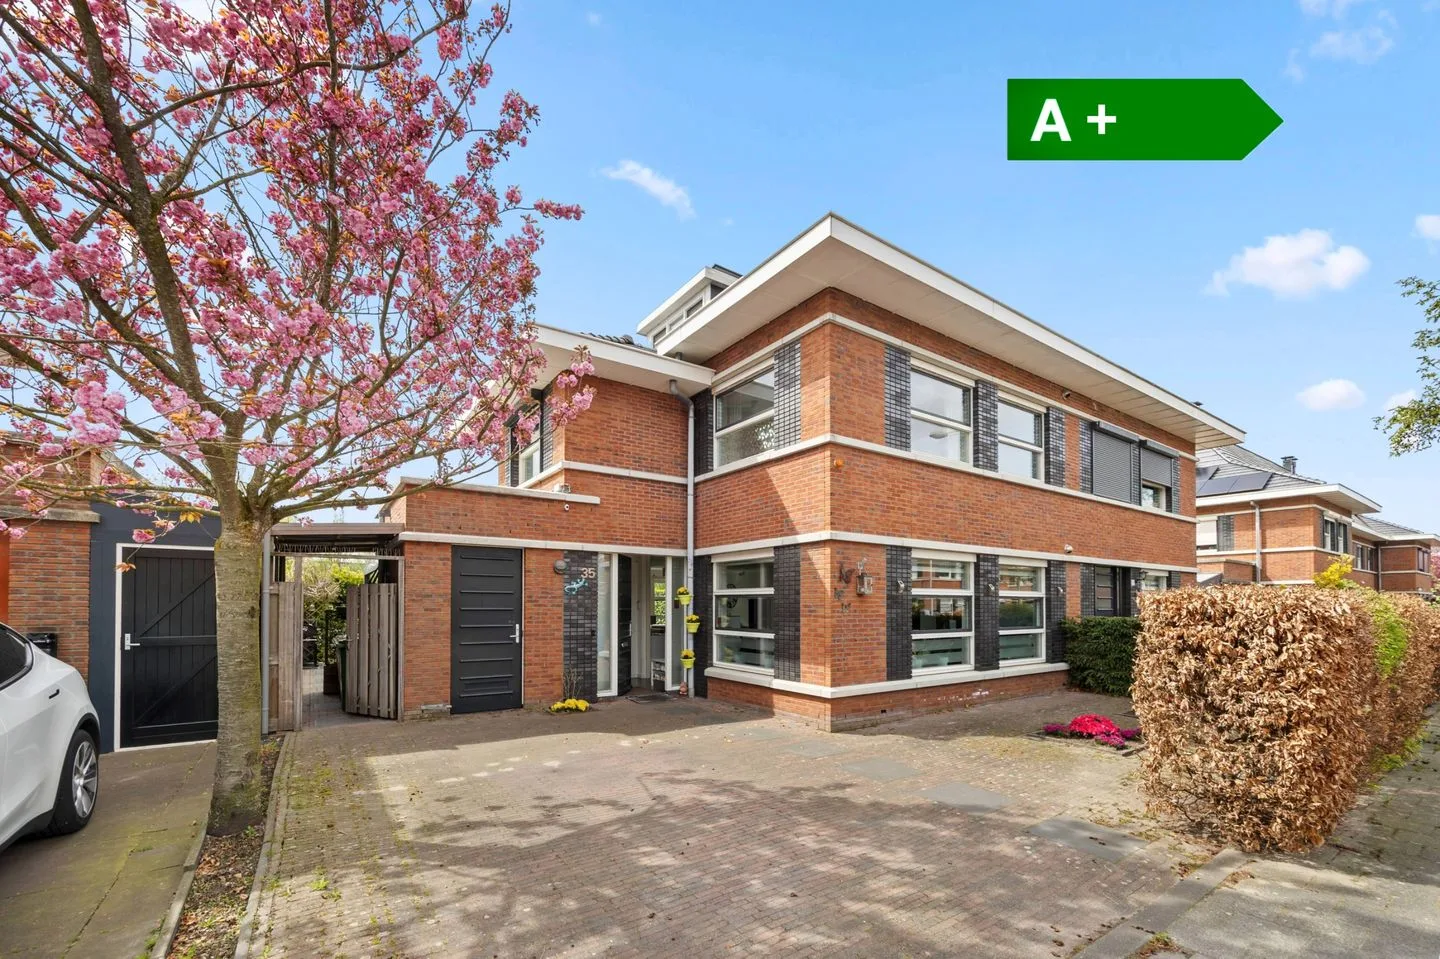
Thorbeckelaan 114
2641XJ Pijnacker
€ 475.000 k.k.
€ 4.167/m²
FSave as favorite- Living area
- 114 m²
- Land area
- 121 m²
- Bedrooms
- 5
-

- Available
Abtswoudseweg 13
2627AK Delft
€ 350.000 k.k.
€ 5.385/m²
BSave as favorite- Living area
- 65 m²
- Land area
- —
- Bedrooms
- 1
Reviews (54)
Review platforms
BronscoresTotal score
54 total reviews

Funda
22 reviews on Funda

32 reviews on Google
-
Westlaan 74
9Translated by AIThe real estate agent helped us with the sale of a property. The contact and communication with him and his colleagues has proceeded to great satisfaction.
-
Alperen Soydan
10Translated by AIWe had the chance to work with Twan on the purchase of our house. He helped us a lot and found a house for us within a month. He was very professional and at the same time friendly. I would absolutely recommend him!
-
Zuideindseweg 13
9Translated by AIFrom the first conversation, the right click and the feeling that this is the right real estate agent to sell my house. Out of 3 invited agents, in addition to the best feeling regarding expertise and knowledge of the local market, the best selling price. Good communication about taking photos, collecting documents, viewings (feedback by phone after each viewing day +++). Ultimately a correct offer was quickly accepted. Very satisfied with the entire process up to the notary's office v…
-
Vuurdoornlaan 42
8Translated by AIWe are very satisfied with how they have helped us. Friendly and service oriented. We will certainly recommend other sellers of their house to contact Ruseler & Van Herk Real Estate Agents.
-
Oostmeerlaan 197
10Translated by AIAbsolutely top quality of service. Available, responsive, attentive to our needs. Definitely recommended.
-
Overgauwseweg 54 a
10Translated by AIReally fantastic help with negotiations, advice, putting the right people in the right places and so much more!! They are now also working on selling my house, which is going very well and has involved a lot of preparatory work. These people really have passion for their work, which is almost daily noticeable.
-
Rivierenlaan 102
9Translated by AIThe people from Ruseler & Van Herk Makelaars were involved in the sale and pleasant to deal with. They ensured a 'stress-free' sale.
-
Ru Parésingel 44
10Translated by AIPleasant realtor to work with. Clear price agreements and good support throughout the process and during negotiations. Communication generally went well, had a small misunderstanding but it was quickly resolved.
-
Weegbree 6
10We are very happy with Ruseler & van Herk makelaars. They guided us through the whole process, and gave us valuable information.
-
William van Os
10Translated by AINice realtor. Good contact and pleasant interaction. Definitely recommended.
-
Melvin Klop
10Translated by AIRaymond Stolk is a very skilled appraiser who completed the report quickly and well.
-
Lucas van der Knaap
10Translated by AIRuseler & Van Herk Real Estate Agency is a professional and expert real estate agency with extensive market knowledge. They are committed to their clients and offer clear communication, honest advice, and a strong presentation of homes. The team is involved and always ready to answer questions and think along.
-
John
10Translated by AIClear and transparent
-
Arja Langeveld
2Translated by AICalled, left a voicemail and emailed, submitted a request via website. They do not make contact. Very difficult to reach.
-
Deez Smit
10Translated by AINice realtor, and happy with the choice to have Ruseler as our sales realtor; it was sold within 2 weeks.
-
Staalblauw 43
9Translated by AIExtremely positive experience. I have NO experience with buying a house but they arranged everything for me, including financial guidance. Despite the difficult time on the housing market, I was able to purchase a home in relatively short time. Top!
-
Pondstraat 25
9Translated by AIA fine real estate agent who always put our interests first. Provides support, transparent in communication and expertise.
-
Rosa Manuslaan 2
9Translated by AIWe had a pleasant and clear introductory meeting with Raymond. This made it easy to choose Ruseler & van Herk Makelaars. The sale of our house went well, thanks to the good and expert guidance. For questions and advice, we could always call or drop in. We are very satisfied!
-
Monnikenweg 30
10Translated by AIA very nice realtor who responds quickly, actively thinks along with you and truly protects your interests! Pleasant communication and always accessible!
-
Vossenzoom 252
10Translated by AIThe contact was characterized by short lines, resulting in direct answers to questions and complete satisfaction. Friendliness and expertise are paramount at Ruseler&Van Herk. The commitment scores very highly.