NoordHollandswonen is een moderne makelaar in Wieringerwaard die zich richt op duurzame en digitaal gerichte oplossingen voor woningtransacties. Met een flexibele werkwijze en een focus op klantgerichtheid, biedt het kantoor een transparante en efficiënte service die aansluit bij de huidige eisen van de markt. Het kantoor streeft naar betrouwbare dienstverlening in de regio, met een werkmethodiek die minimaal papiergebruik en maximale d...
Current housing stock
-

- Available
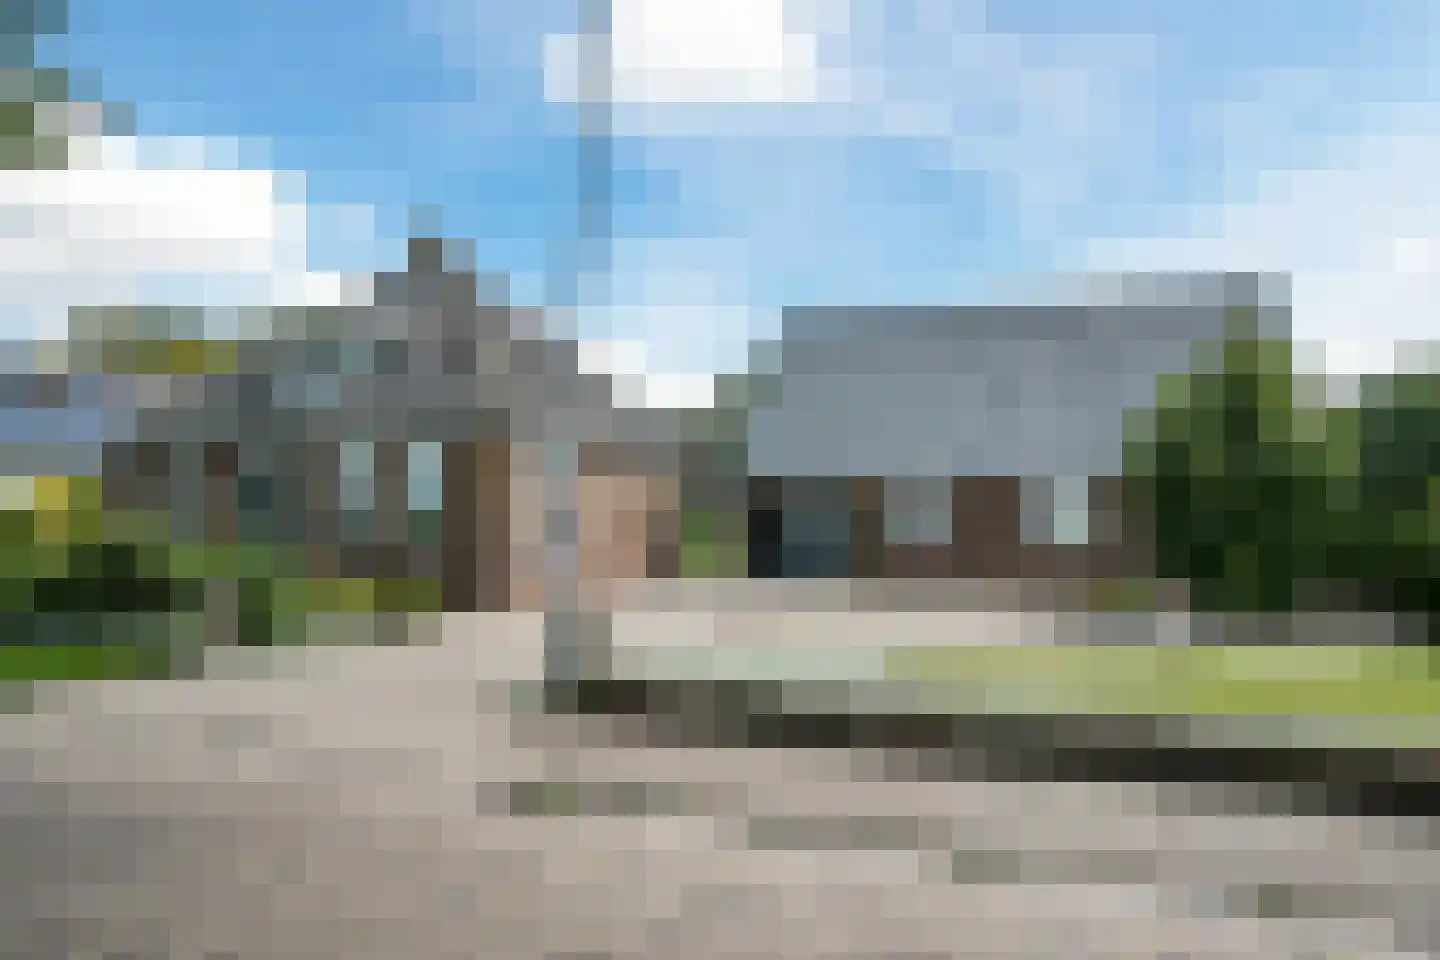
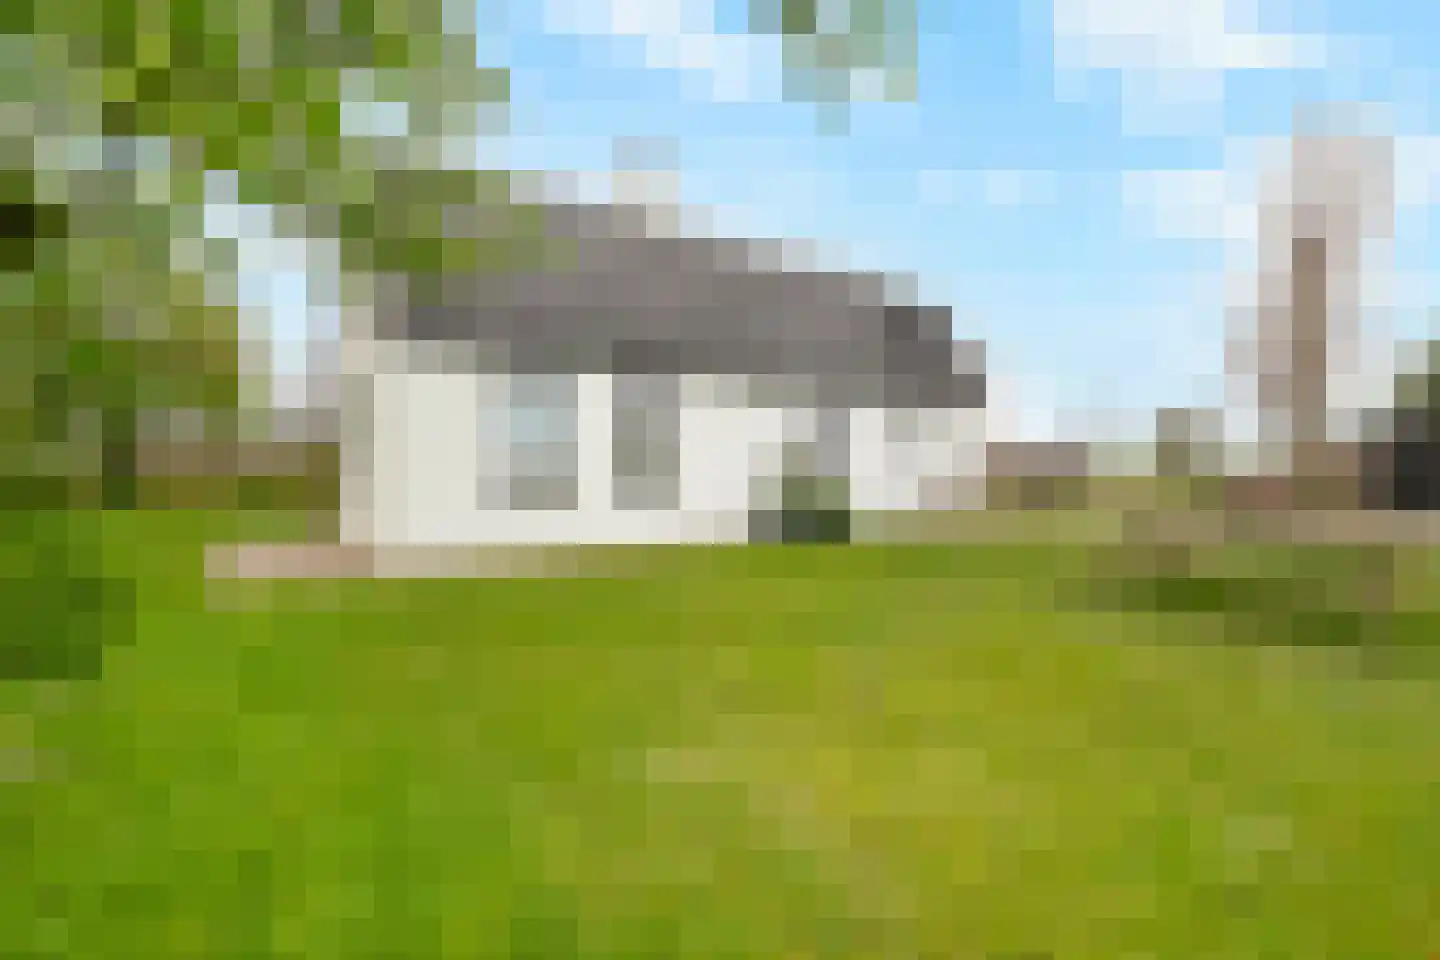
Vermeerstraat 5
1761WN Anna Paulowna
€ 729.000 k.k.
€ 3.758/m²
ASave as favorite- Living area
- 194 m²
- Land area
- 700 m²
- Bedrooms
- 6
-
- Available
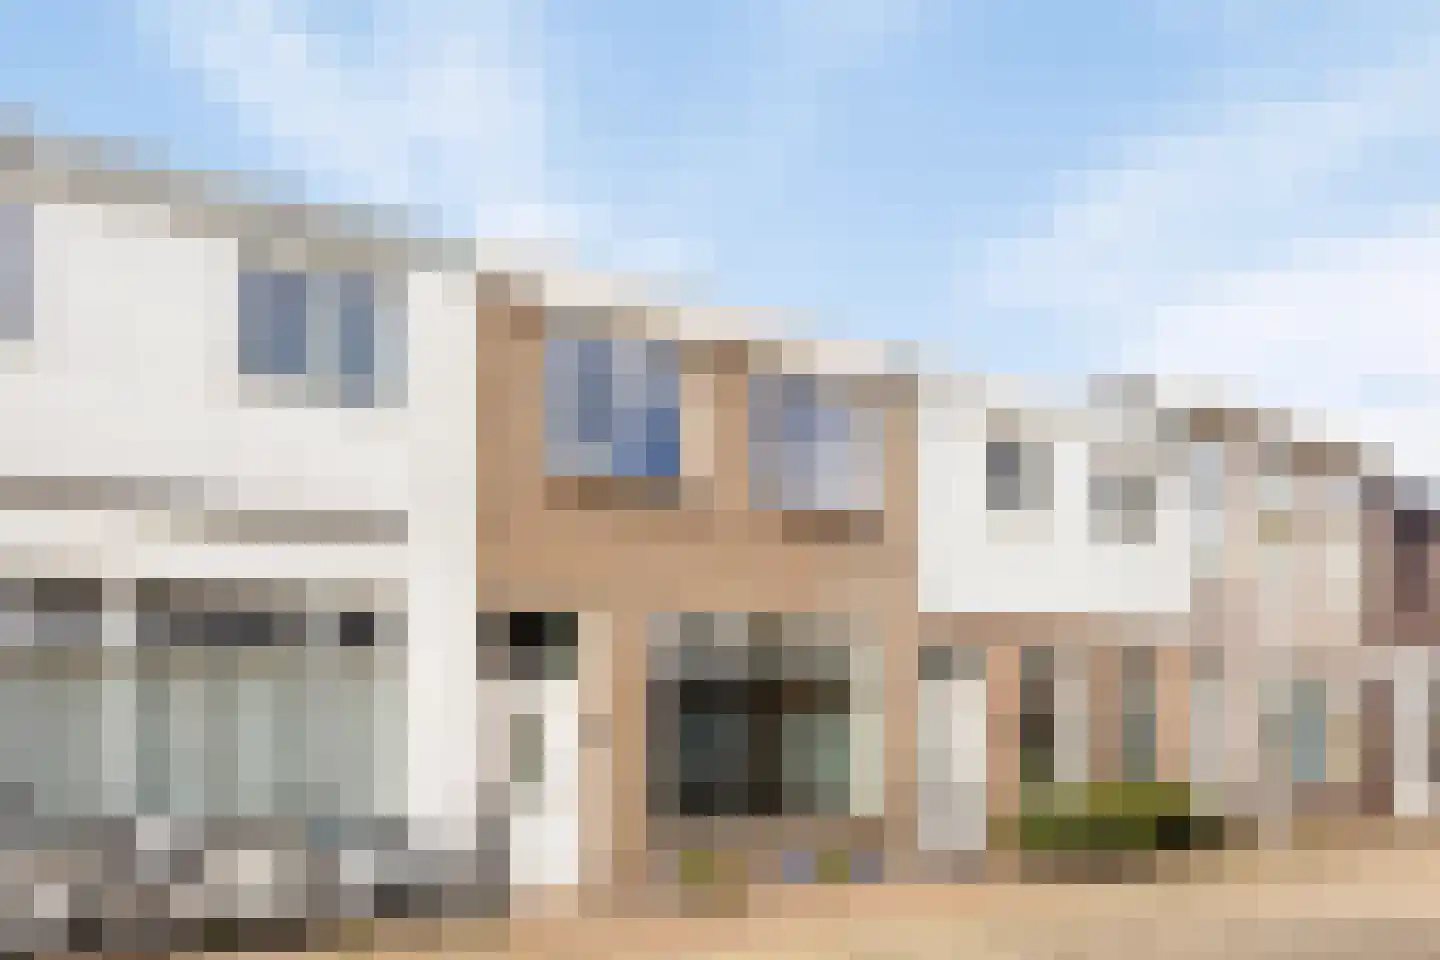
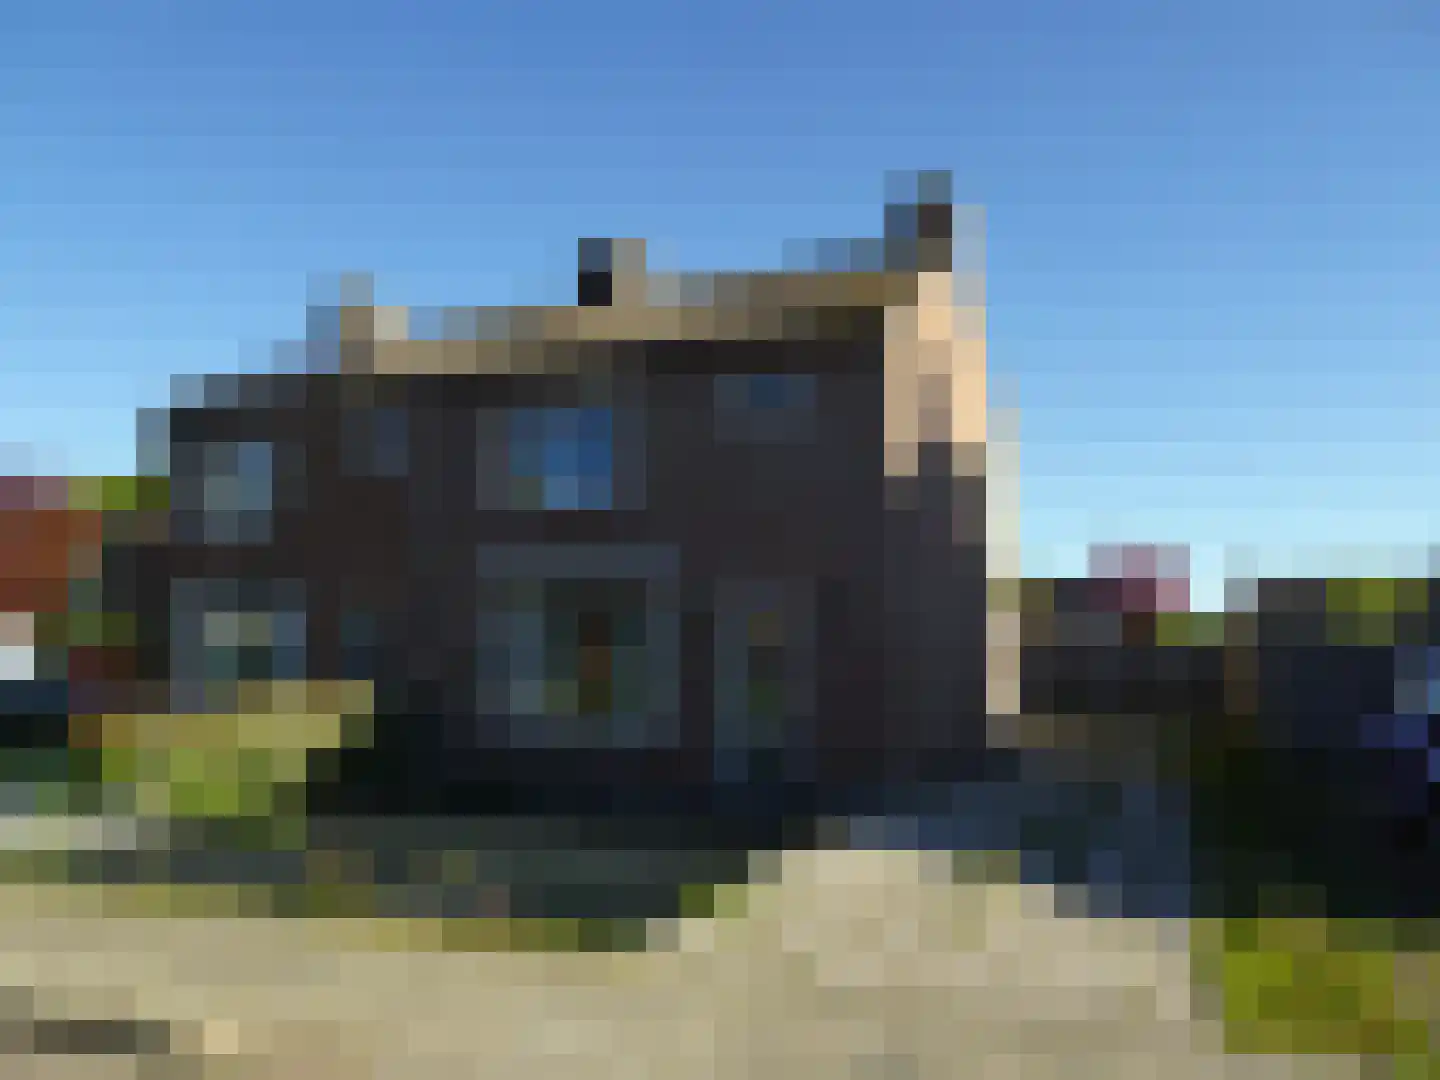
Scholeksterlaan 4
1766JZ Wieringerwaard
€ 300.000 k.k.
€ 3.191/m²
Save as favorite- Living area
- 94 m²
- Land area
- 148 m²
- Bedrooms
- 3
-

- Available
Molengang 122
1761BW Anna Paulowna
€ 300.000 k.k.
€ 4.286/m²
Save as favorite- Living area
- 70 m²
- Land area
- —
- Bedrooms
- 2
-

- Available
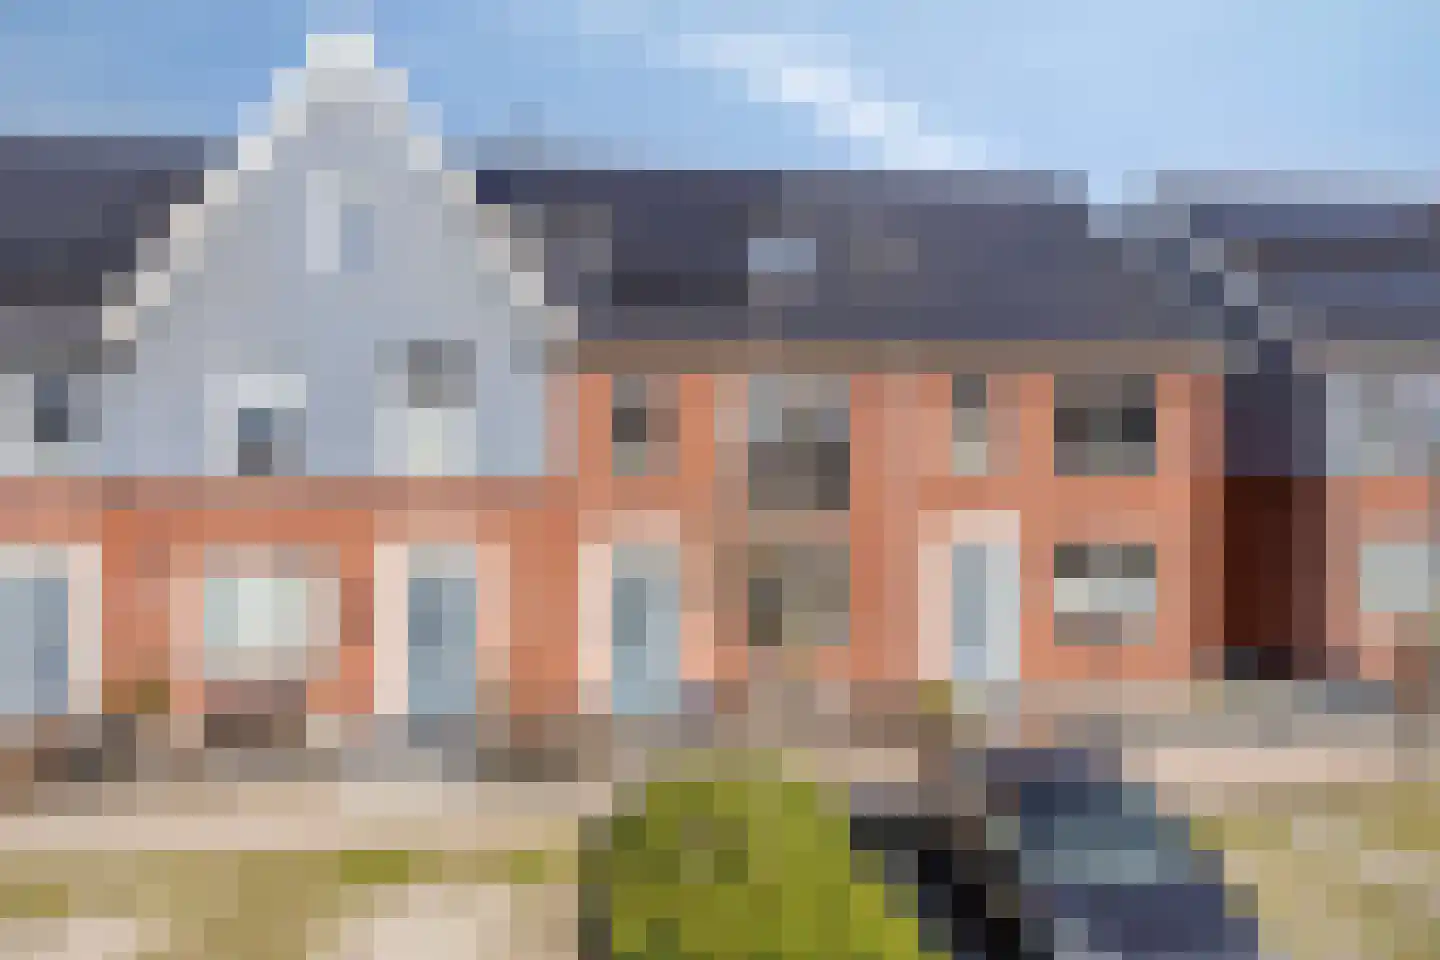
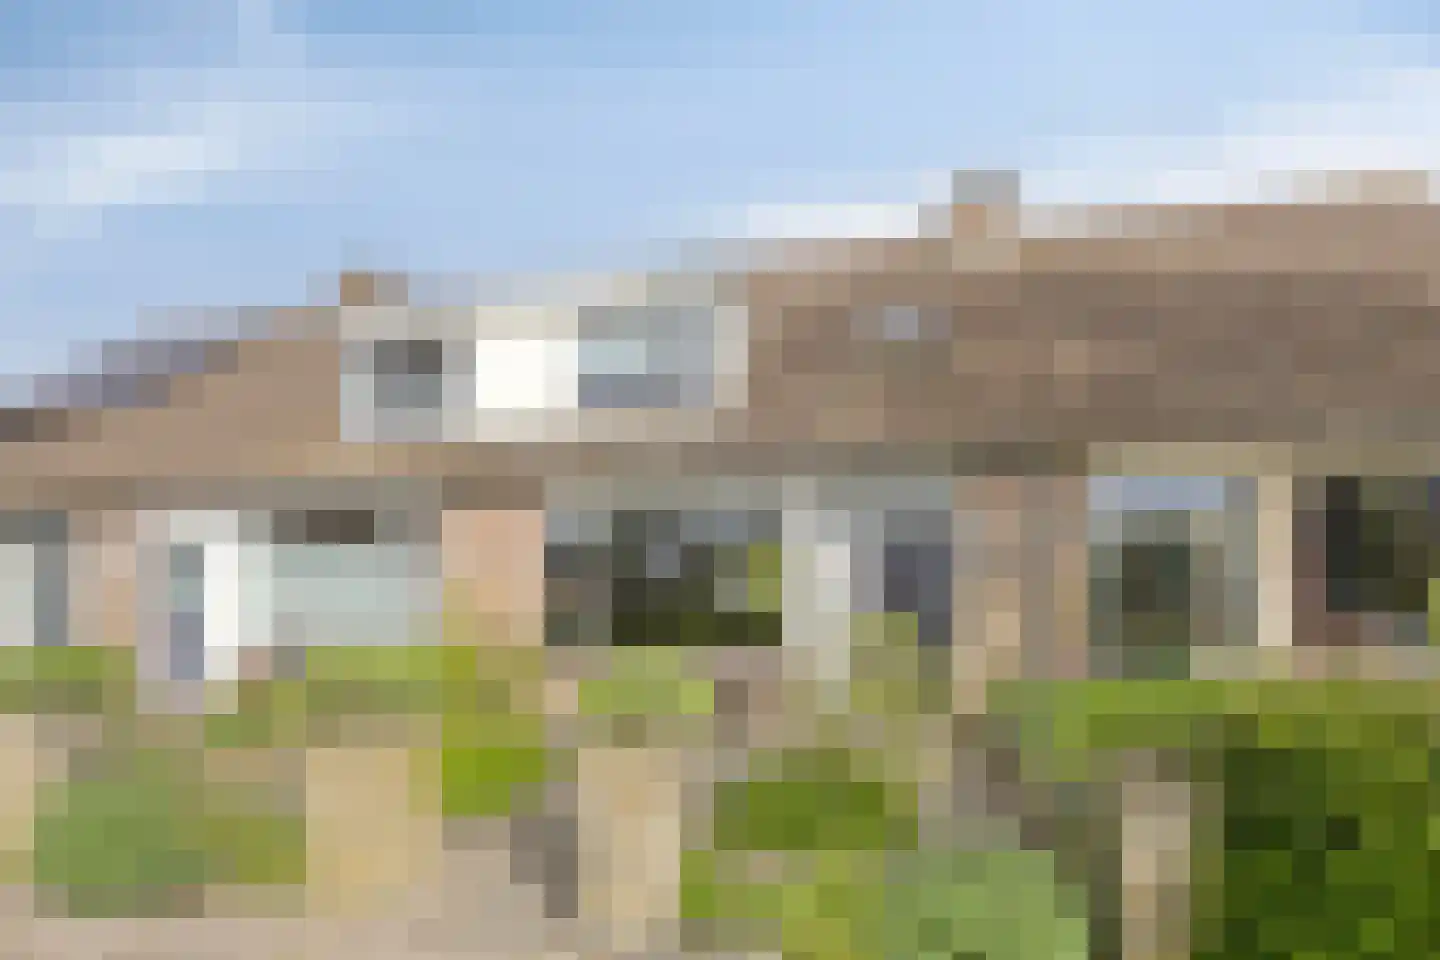
Diamant 8
1761VA Anna Paulowna
€ 419.000 k.k.
€ 3.463/m²
BSave as favorite- Living area
- 121 m²
- Land area
- 165 m²
- Bedrooms
- 4
-
- Available
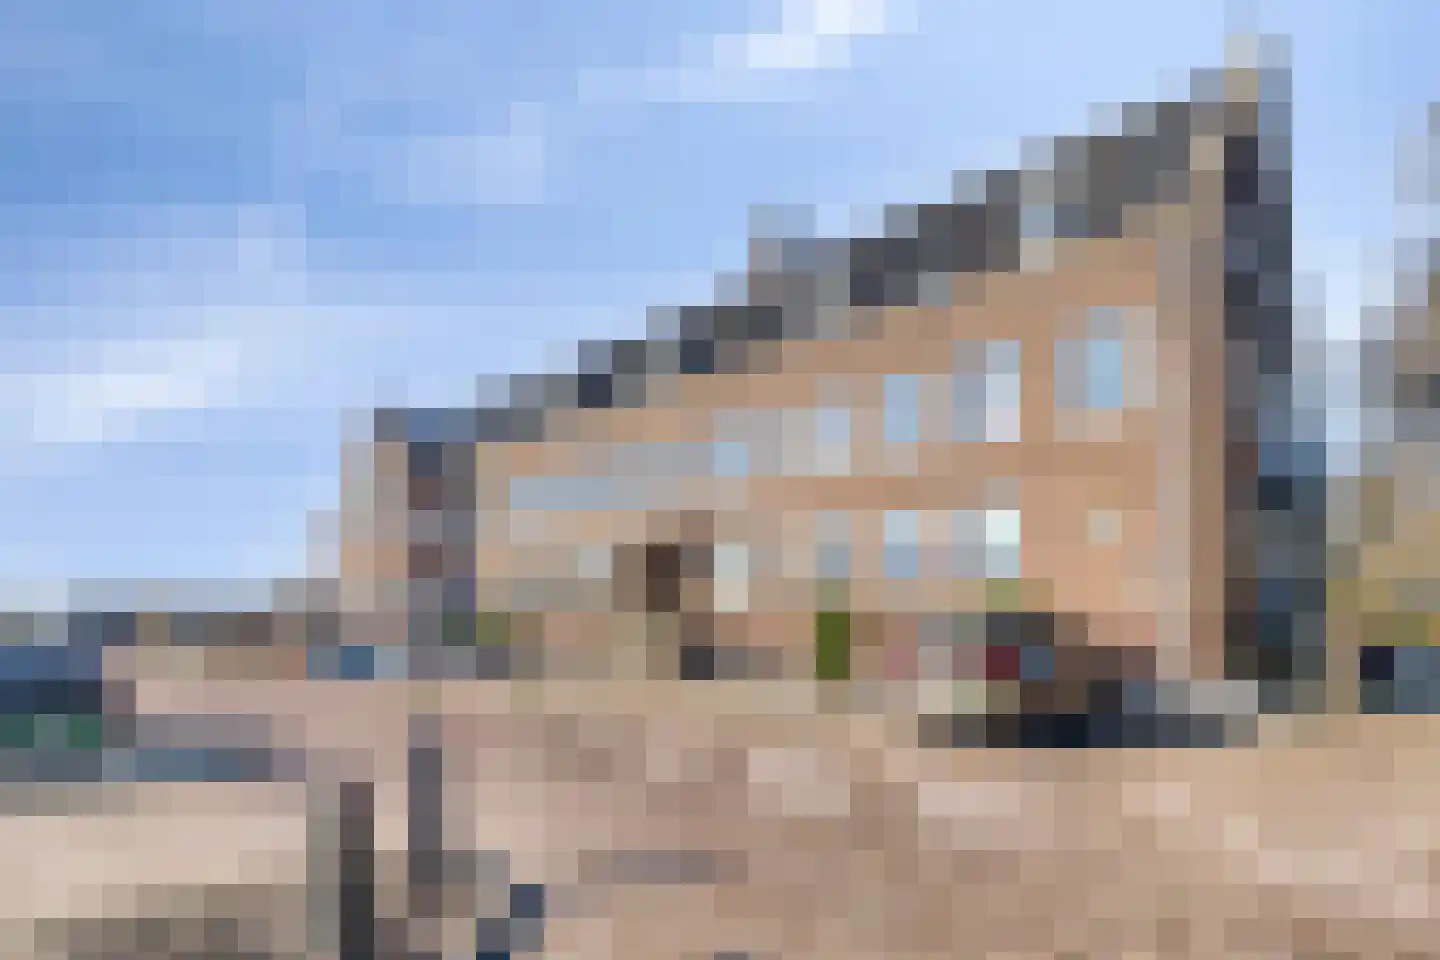
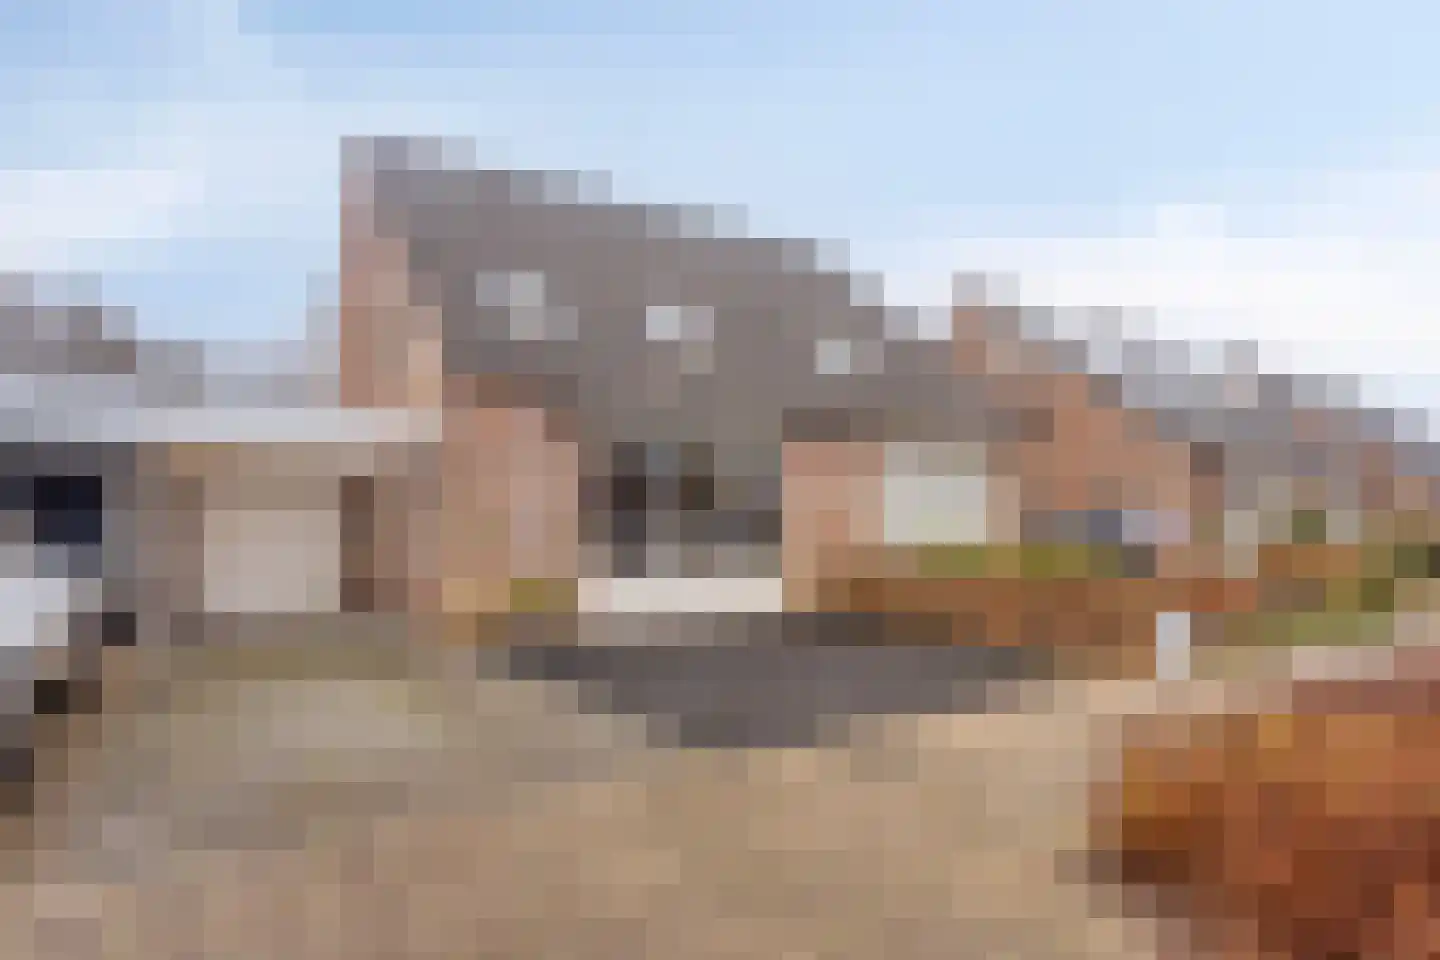
Kievitlaan 12
1766KL Wieringerwaard
€ 395.000 k.k.
€ 3.798/m²
BSave as favorite- Living area
- 104 m²
- Land area
- 213 m²
- Bedrooms
- 4
-

- Available
Merelweg 70
1706BE Heerhugowaard
€ 997.000 k.k.
€ 5.010/m²
A++Save as favorite- Living area
- 199 m²
- Land area
- 522 m²
- Bedrooms
- 5
Reviews (1)
Review platforms
BronscoresTotal score
1 total reviews

Funda
1 reviews on Funda
-
Molensingel 27
9Diana heeft geen 9 tot 5 instelling en is bereid om zich flexibel ook in het weekend beschikbaar te stellen. Ze is zeer gedreven en representatief ingesteld.