- Sold
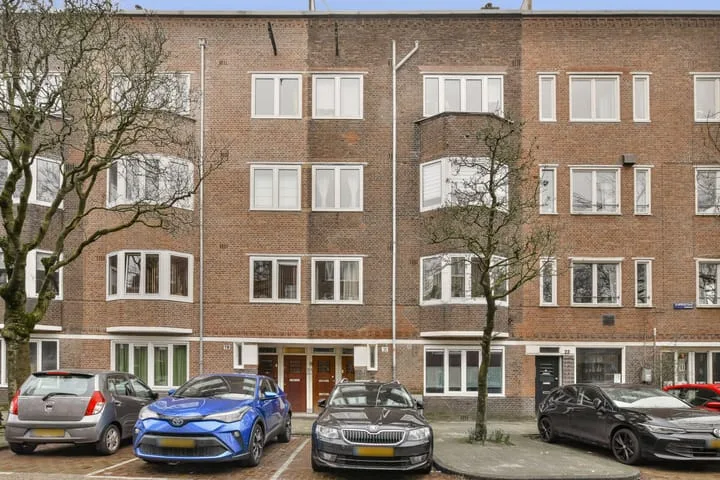
Sanderijnstraat 35 2
1055BP Amsterdam
€ 425.000 k.k.
€ 9.042/m²
- Living area
- 47 m²
- Land area
- —
- Bedrooms
- 2
View 9.383 sold houses in Amsterdam
Type to search. Use arrow down and arrow up to navigate through results and press Enter to open.
Hidden search suggestions.
Compare sold homes in Amsterdam or view the current offering in this location directly.
On this page you will find recently sold homes in Amsterdam. Use this overview to better estimate selling prices, popular neighborhoods, and the local housing supply before you choose a real estate agent. Also view the current housing supply with 14.803 houses in Amsterdam.
1055BP Amsterdam
€ 425.000 k.k.
€ 9.042/m²
1093NJ Amsterdam
€ 725.000 k.k.
€ 8.146/m²
1102VB Amsterdam
€ 245.000 k.k.
€ 5.568/m²
1051PB Amsterdam
€ 750.000 k.k.
€ 8.620/m²
1075CS Amsterdam
€ 675.000 k.k.
€ 10.714/m²
1021TW Amsterdam
€ 400.000 k.k.
€ 8.333/m²
1063ZK Amsterdam
€ 300.000 k.k.
€ 6.976/m²
1093EL Amsterdam
€ 450.000 k.k.
€ 9.000/m²
1056KA Amsterdam
€ 425.000 k.k.
€ 8.854/m²
1071RR Amsterdam
€ 995.000 k.k.
€ 10.698/m²
1093CP Amsterdam
€ 599.000 k.k.
€ 9.359/m²
1083TE Amsterdam
€ 480.000 k.k.
€ 6.153/m²
1021TR Amsterdam
€ 725.000 k.k.
€ 5.215/m²
1057RX Amsterdam
€ 600.000 k.k.
€ 8.333/m²
1078BK Amsterdam
€ 550.000 k.k.
€ 8.870/m²
1052ET Amsterdam
€ 525.000 k.k.
€ 9.051/m²
1017XR Amsterdam
€ 275.000 k.k.
€ 10.185/m²
1025XZ Amsterdam
€ 350.000 k.k.
€ 4.487/m²
1031AG Amsterdam
€ 300.000 k.k.
€ 5.882/m²
1031AG Amsterdam
€ 350.000 k.k.
€ 5.737/m²
1018ZS Amsterdam
€ 650.000 k.k.
€ 8.333/m²
1059AD Amsterdam
€ 875.000 k.k.
€ 9.020/m²
1060RE Amsterdam
€ 425.000 k.k.
€ 4.829/m²
1077VK Amsterdam
€ 1.180.000 k.k.
€ 9.516/m²
1066SL Amsterdam
€ 750.000 k.k.
€ 5.208/m²
1078GE Amsterdam
€ 695.000 k.k.
€ 7.554/m²
1076BN Amsterdam
€ 675.000 k.k.
€ 9.642/m²
1018MR Amsterdam
€ 625.000 k.k.
€ 8.561/m²
Get free quotes from realtors with local market knowledge in Amsterdam.
Selling a home in Amsterdam? Compare real estate agents who know the local housing market. Also check out all real estate agents in Amsterdam or the top 10 real estate agents in Amsterdam for extra context for your choice.
By comparing brokers and requesting quotes
Short answers about housing prices, sold homes and comparing real estate agents in Amsterdam.
The costs of a real estate agent in Amsterdam vary per office, property type and sales approach. Therefore, compare multiple quotes and also look at the real estate agents in Amsterdam to better compare rates, presentation and local experience.
On this page we currently show 9.383 sold houses in Amsterdam from our selection. This helps you to better assess recent transactions and the local housing market.
Houses sold in Amsterdam give insight into asking prices, house types and neighborhoods where recent transactions have taken place. Compare this also with the current housing stock in Amsterdam to better understand the market.
You can use sold homes as a first market indication, but a local real estate agent can better take into account finishing, location, maintenance and current demand in Amsterdam.
Compare realtors in Amsterdam on local sales experience, reviews, expected yield, commission and marketing approach. The top 10 realtors in Amsterdam helps to quickly discover strong offices.
View current location data on residents, WOZ development, housing stock, energy consumption, business activity and safety in Amsterdam. In 2026 were there 942.504 residents. The average WOZ value in 2025 is EUR 518.000.
These figures help to better assess and compare the housing stock in Amsterdam with recent sold homes. Orient yourself then on suitable top real estate agents in Amsterdam for sales advice in this region.
Residents
942.504
Last year: 2026
Average WOZ
EUR 518.000
Last year: 2025
Average income per person.
EUR 41.000
Source: AllNumbers
Crimes (current year)
80.268
Total registered
| Year | Residents |
|---|---|
| 2022 | 903.174 |
| 2023 | 918.117 |
| 2024 | 931.298 |
| 2025 | 934.526 |
| 2026 | 942.504 |
| Year | Average WOZ |
|---|---|
| 2021 | EUR 422.358 |
| 2022 | EUR 433.140 |
| 2023 | EUR 516.000 |
| 2024 | EUR 498.000 |
| 2025 | EUR 518.000 |
Hoger
50
Praktisch
22
Middelbaar
29
Europa
160.251
Nederland
372.256
Buiten Europa
402.019
Label A
132.143
Label C
105.983
Label B
68.263
Label G
55.878
Label D
45.856
Label E
34.978
Label A+
22.421
Label A++
16.470
Label F
15.844
Label A+++
11.226
Label A++++
1.048
Label A+++++
76
| Year | Gas (m3) | Electricity (kWh) |
|---|---|---|
| 2020 | 785 | 2.099 |
| 2021 | 888 | 2.145 |
| 2022 | 693 | 2.003 |
| 2023 | 600 | 1.880 |
| 2024 | 580 | 1.890 |
Hoekwoning
Gas: 870 • Electricity: 2.610
Huurwoning
Gas: 560 • Electricity: 1.690
Koopwoning
Gas: 690 • Electricity: 2.330
Appartement
Gas: 570 • Electricity: 1.760
Tussenwoning
Gas: 760 • Electricity: 2.600
Vrijstaande woning
Gas: 1.310 • Electricity: 4.140
Twee-onder-één-kap woning
Gas: 1.050 • Electricity: 3.200
Total number of company establishments: 209.480
| Period | Crimes |
|---|---|
| jan 2025 | 5.989 |
| jan 2026 | 5.946 |
| jul 2025 | 7.550 |
| jun 2025 | 6.798 |
| mei 2025 | 6.973 |
| mrt 2025 | 6.238 |
| nov 2024 | 6.431 |
| nov 2025 | 6.891 |
| okt 2024 | 7.792 |
| okt 2025 | 7.308 |
| sep 2024 | 7.190 |
| sep 2025 | 6.452 |
These figures give an indicative picture of safety trends in the living environment of Amsterdam.
Short answers based on current local statistics, handy for a quick comparison of the living environment.
Amsterdam telt in 2026 ongeveer 942.504 inwoners.
De gemiddelde WOZ-waarde in Amsterdam is in 2025 circa € 518.000.
Het gemiddelde inkomen per inwoner in Amsterdam ligt rond € 41.000 per jaar.
Voor het huidige jaar gaat het om ongeveer 80.268 geregistreerde misdrijven. Gebruik deze cijfers als indicatie en vergelijk trends per periode.
In Amsterdam komt vooral "Appartementen" veel voor, met ongeveer 452.118 woningen.