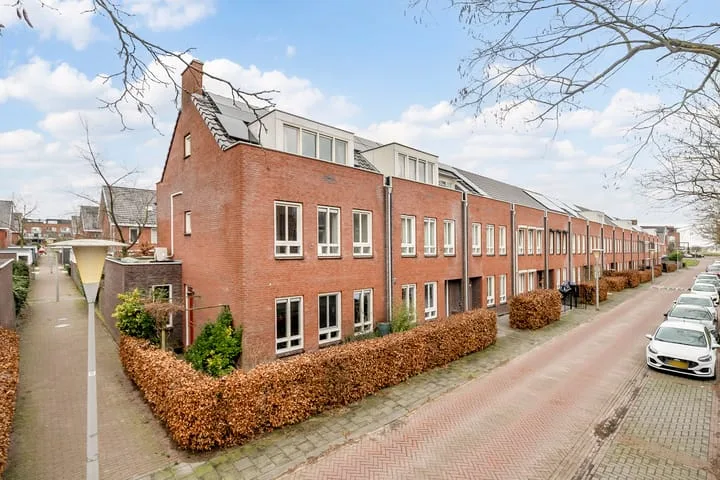
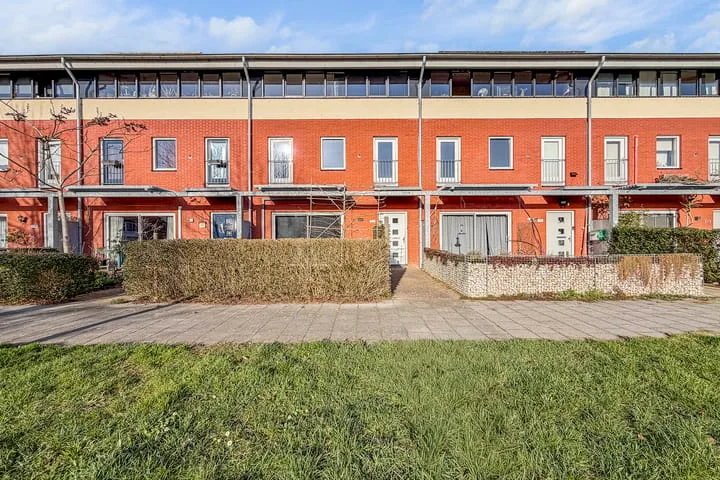
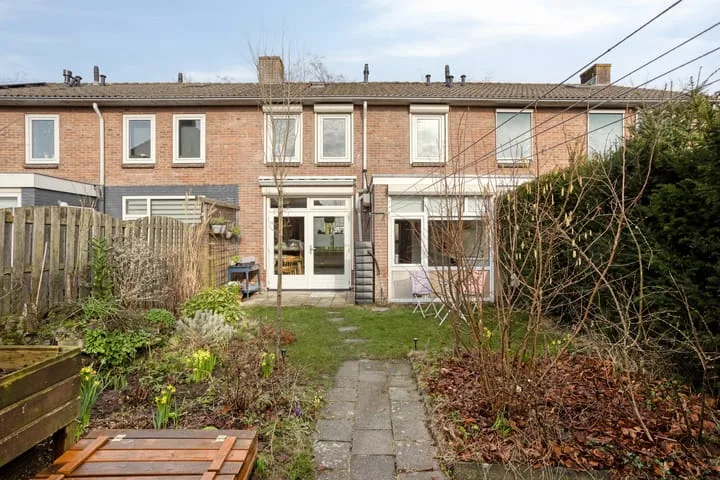
- Sold
Leoninusstraat 70
6821ET Arnhem
€ 435.000 k.k.
€ 4.223/m²
- Living area
- 103 m²
- Land area
- —
- Bedrooms
- 3
View 1.661 sold houses in Arnhem
Type to search. Use arrow down and arrow up to navigate through results and press Enter to open.
Hidden search suggestions.
Compare sold homes in Arnhem or view the current offering in this location directly.
On this page you will find recently sold homes in Arnhem. Use this overview to better estimate selling prices, popular neighborhoods, and the local housing supply before you choose a real estate agent. Also view the current housing supply with 2.293 houses in Arnhem.
6821ET Arnhem
€ 435.000 k.k.
€ 4.223/m²
6825BB Arnhem
€ 215.000 k.k.
€ 3.412/m²
6824EN Arnhem
€ 329.500 k.k.
€ 4.576/m²
6841AD Arnhem
€ 445.000 k.k.
€ 4.734/m²
6835GL Arnhem
€ 275.000 k.k.
€ 5.729/m²
6843RA Arnhem
Price upon request
6826VD Arnhem
€ 435.000 k.k.
€ 3.782/m²
6825AV Arnhem
€ 525.000 k.k.
€ 4.646/m²
6844DJ Arnhem
€ 395.000 k.k.
€ 3.558/m²
6813HG Arnhem
€ 849.000 k.k.
€ 4.614/m²
6835CD Arnhem
€ 450.000 k.k.
€ 3.543/m²
6814JN Arnhem
€ 398.000 k.k.
€ 4.326/m²
6843NA Arnhem
€ 375.000 k.k.
€ 3.205/m²
6826NK Arnhem
€ 279.500 k.k.
€ 3.140/m²
6827AS Arnhem
€ 395.000 k.k.
€ 5.064/m²
6824LR Arnhem
€ 659.000 k.k.
€ 5.230/m²
6825AT Arnhem
€ 435.000 k.k.
€ 4.065/m²
6833HN Arnhem
€ 245.000 k.k.
€ 3.500/m²
6833LJ Arnhem
€ 535.000 k.k.
€ 3.474/m²
6811DR Arnhem
€ 300.000 k.k.
€ 5.084/m²
6828AG Arnhem
€ 215.000 k.k.
€ 6.718/m²
6845AM Arnhem
€ 379.000 k.k.
€ 3.542/m²
6833GJ Arnhem
€ 524.000 k.k.
€ 3.175/m²
6824LH Arnhem
€ 285.000 k.k.
€ 3.958/m²
6824LA Arnhem
€ 275.000 k.k.
€ 3.125/m²
6828JX Arnhem
€ 350.000 k.k.
€ 3.017/m²
6823MC Arnhem
€ 389.000 k.k.
€ 4.420/m²
6831MH Arnhem
€ 275.000 k.k.
€ 3.873/m²
Get free quotes from realtors with local market knowledge in Arnhem.
Selling a home in Arnhem? Compare real estate agents who know the local housing market. Also check out all real estate agents in Arnhem or the top 10 real estate agents in Arnhem for extra context for your choice.
By comparing brokers and requesting quotes
Short answers about housing prices, sold homes and comparing real estate agents in Arnhem.
The costs of a real estate agent in Arnhem vary per office, property type and sales approach. Therefore, compare multiple quotes and also look at the real estate agents in Arnhem to better compare rates, presentation and local experience.
On this page we currently show 1.661 sold houses in Arnhem from our selection. This helps you to better assess recent transactions and the local housing market.
Verkochte woningen in Arnhem geven inzicht in vraagprijzen, woningtypes en buurten waar recent transacties hebben plaatsgevonden. Vergelijk dit ook met het actuele woningaanbod in Arnhem om de markt beter te duiden.
Je kunt verkochte woningen gebruiken als eerste marktindicatie, maar een lokale makelaar kan beter rekening houden met afwerking, ligging, onderhoud en actuele vraag in Arnhem.
Vergelijk makelaars in Arnhem op lokale verkoopervaring, reviews, verwachte opbrengst, courtage en marketingaanpak. De top 10 makelaars in Arnhem helpt om snel sterke kantoren te ontdekken.
View current location data on residents, WOZ development, housing stock, energy consumption, business activity and safety in Arnhem. In 2026 were there 172.002 residents. The average WOZ value in 2025 is EUR 350.000.
These figures help to better assess and compare the housing stock in Arnhem with recent sold homes. Orient yourself then on suitable top real estate agents in Arnhem for sales advice in this region.
Residents
172.002
Last year: 2026
Average WOZ
EUR 350.000
Last year: 2025
Average income per person.
EUR 33.300
Source: AllNumbers
Crimes (current year)
11.361
Total registered
| Year | Residents |
|---|---|
| 2022 | 163.888 |
| 2023 | 165.770 |
| 2024 | 167.632 |
| 2025 | 169.364 |
| 2026 | 172.002 |
| Year | Average WOZ |
|---|---|
| 2021 | EUR 240.000 |
| 2022 | EUR 265.000 |
| 2023 | EUR 322.000 |
| 2024 | EUR 335.000 |
| 2025 | EUR 350.000 |
Hoger
38
Praktisch
26
Middelbaar
37
Europa
15.436
Nederland
105.513
Buiten Europa
48.415
Label A
21.789
Label C
20.317
Label B
11.072
Label D
6.974
Label E
6.628
Label G
6.375
Label F
4.142
Label A+
3.314
Label A++
2.112
Label A+++
1.128
Label A++++
154
Label A+++++
9
| Year | Gas (m3) | Electricity (kWh) |
|---|---|---|
| 2020 | 960 | 2.470 |
| 2021 | 1.080 | 2.510 |
| 2022 | 850 | 2.370 |
| 2023 | 720 | 2.230 |
| 2024 | 710 | 2.280 |
Hoekwoning
Gas: 890 • Electricity: 2.620
Huurwoning
Gas: 640 • Electricity: 1.910
Koopwoning
Gas: 830 • Electricity: 2.660
Appartement
Gas: 600 • Electricity: 1.800
Tussenwoning
Gas: 750 • Electricity: 2.440
Vrijstaande woning
Gas: 1.330 • Electricity: 4.210
Twee-onder-één-kap woning
Gas: 1.000 • Electricity: 3.180
Total number of company establishments: 25.615
| Period | Crimes |
|---|---|
| jan 2025 | 958 |
| jan 2026 | 888 |
| jul 2025 | 914 |
| jun 2025 | 1.024 |
| mei 2025 | 941 |
| mrt 2025 | 972 |
| nov 2024 | 962 |
| nov 2025 | 849 |
| okt 2024 | 1.081 |
| okt 2025 | 1.122 |
| sep 2024 | 1.021 |
| sep 2025 | 871 |
These figures give an indicative picture of safety trends in the living environment of Arnhem.
Short answers based on current local statistics, handy for a quick comparison of the living environment.
Arnhem telt in 2026 ongeveer 172.002 inwoners.
De gemiddelde WOZ-waarde in Arnhem is in 2025 circa € 350.000.
Het gemiddelde inkomen per inwoner in Arnhem ligt rond € 33.300 per jaar.
Voor het huidige jaar gaat het om ongeveer 11.361 geregistreerde misdrijven. Gebruik deze cijfers als indicatie en vergelijk trends per periode.
In Arnhem komt vooral "Appartementen" veel voor, met ongeveer 41.243 woningen.