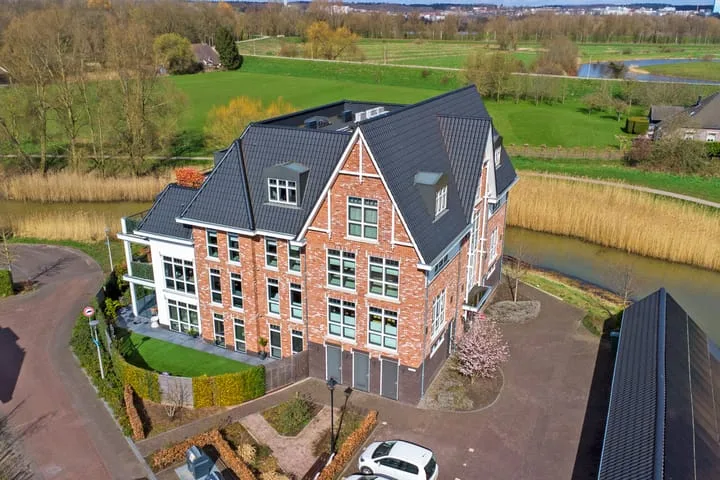
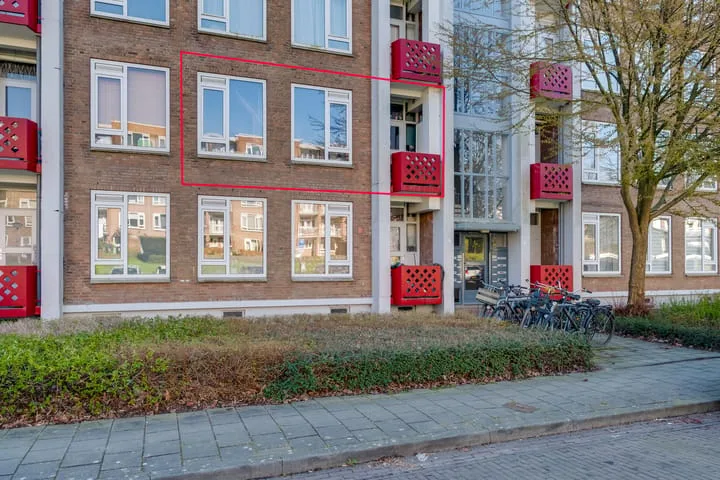
- Sold
Klarendalseweg 343
6822GP Arnhem
€ 250.000 k.k.
- Living area
- 63 m²
- Land area
- —
- Bedrooms
- 1
View 1.664 sold houses in Arnhem
Type to search. Use arrow down and arrow up to navigate through results and press Enter to open.
Hidden search suggestions.
Compare sold homes in Arnhem or view the current offering in this location directly.
On this page you will find recently sold homes in Arnhem. Use this overview to better estimate selling prices, popular neighborhoods, and the local housing supply before you choose a real estate agent. Also view the current housing supply with 2.296 houses in Arnhem.
6822GP Arnhem
€ 250.000 k.k.
6827AS Arnhem
€ 675.000 k.k.
€ 4.245/m²
6836PL Arnhem
€ 450.000 k.k.
€ 3.879/m²
6813HA Arnhem
€ 695.000 k.k.
€ 4.894/m²
6846DB Arnhem
€ 825.000 k.k.
€ 4.342/m²
6822HR Arnhem
€ 495.000 k.k.
€ 5.892/m²
6821GN Arnhem
€ 250.000 k.k.
€ 5.102/m²
6821LD Arnhem
€ 509.000 k.k.
€ 5.532/m²
6842DM Arnhem
€ 749.000 k.k.
€ 6.190/m²
6821CE Arnhem
€ 519.000 k.k.
€ 5.295/m²
6821DR Arnhem
€ 425.000 k.k.
€ 4.166/m²
6822KS Arnhem
€ 525.000 k.k.
€ 4.906/m²
6833BR Arnhem
€ 375.000 k.k.
€ 4.213/m²
6824DG Arnhem
€ 265.000 k.k.
€ 4.274/m²
6846XW Arnhem
€ 470.000 k.k.
€ 3.884/m²
6823BA Arnhem
€ 275.000 k.k.
€ 4.044/m²
6813JL Arnhem
€ 795.000 k.k.
€ 5.559/m²
6821CX Arnhem
€ 320.000 k.k.
€ 5.818/m²
6828CH Arnhem
€ 250.000 k.k.
€ 4.385/m²
6826MC Arnhem
€ 299.000 k.k.
€ 2.931/m²
6846XN Arnhem
€ 520.000 k.k.
€ 3.354/m²
6826NK Arnhem
€ 235.000 k.k.
€ 3.916/m²
6846HN Arnhem
€ 595.000 k.k.
€ 4.473/m²
6828XN Arnhem
€ 215.000 k.k.
€ 3.644/m²
6828JN Arnhem
€ 240.000 k.k.
€ 5.106/m²
6842AC Arnhem
€ 585.000 k.k.
€ 4.239/m²
6825GM Arnhem
€ 289.000 k.k.
€ 3.141/m²
6814BC Arnhem
€ 1.250.000 k.k.
€ 3.511/m²
Get free quotes from realtors with local market knowledge in Arnhem.
Selling a home in Arnhem? Compare real estate agents who know the local housing market. Also check out all real estate agents in Arnhem or the top 10 real estate agents in Arnhem for extra context for your choice.
By comparing brokers and requesting quotes
Short answers about housing prices, sold homes and comparing real estate agents in Arnhem.
The costs of a real estate agent in Arnhem vary per office, property type and sales approach. Therefore, compare multiple quotes and also look at the real estate agents in Arnhem to better compare rates, presentation and local experience.
On this page we currently show 1.664 sold houses in Arnhem from our selection. This helps you to better assess recent transactions and the local housing market.
Houses sold in Arnhem give insight into asking prices, house types and neighborhoods where recent transactions have taken place. Compare this also with the current housing stock in Arnhem to better understand the market.
You can use sold homes as a first market indication, but a local real estate agent can better take into account finishing, location, maintenance and current demand in Arnhem.
Compare realtors in Arnhem on local sales experience, reviews, expected yield, commission and marketing approach. The top 10 realtors in Arnhem helps to quickly discover strong offices.
View current location data on residents, WOZ development, housing stock, energy consumption, business activity and safety in Arnhem. In 2026 were there 171.822 residents. The average WOZ value in 2025 is EUR 350.000.
These figures help to better assess and compare the housing stock in Arnhem with recent sold homes. Orient yourself then on suitable top real estate agents in Arnhem for sales advice in this region.
Residents
171.822
Last year: 2026
Average WOZ
EUR 350.000
Last year: 2025
Average income per person.
EUR 33.300
Source: AllNumbers
Crimes (current year)
11.361
Total registered
| Year | Residents |
|---|---|
| 2022 | 163.888 |
| 2023 | 165.770 |
| 2024 | 167.632 |
| 2025 | 169.364 |
| 2026 | 171.822 |
| Year | Average WOZ |
|---|---|
| 2021 | EUR 240.000 |
| 2022 | EUR 265.000 |
| 2023 | EUR 322.000 |
| 2024 | EUR 335.000 |
| 2025 | EUR 350.000 |
Hoger
38
Praktisch
26
Middelbaar
37
Europa
15.436
Nederland
105.513
Buiten Europa
48.415
Label A
21.789
Label C
20.317
Label B
11.072
Label D
6.974
Label E
6.628
Label G
6.375
Label F
4.142
Label A+
3.314
Label A++
2.112
Label A+++
1.128
Label A++++
154
Label A+++++
9
| Year | Gas (m3) | Electricity (kWh) |
|---|---|---|
| 2020 | 960 | 2.470 |
| 2021 | 1.080 | 2.510 |
| 2022 | 850 | 2.370 |
| 2023 | 720 | 2.230 |
| 2024 | 710 | 2.280 |
Hoekwoning
Gas: 890 • Electricity: 2.620
Huurwoning
Gas: 640 • Electricity: 1.910
Koopwoning
Gas: 830 • Electricity: 2.660
Appartement
Gas: 600 • Electricity: 1.800
Tussenwoning
Gas: 750 • Electricity: 2.440
Vrijstaande woning
Gas: 1.330 • Electricity: 4.210
Twee-onder-één-kap woning
Gas: 1.000 • Electricity: 3.180
Total number of company establishments: 25.615
| Period | Crimes |
|---|---|
| jan 2026 | 894 |
| jul 2025 | 914 |
| jun 2025 | 1.024 |
| mei 2025 | 941 |
| mrt 2025 | 972 |
| mrt 2026 | 909 |
| nov 2024 | 962 |
| nov 2025 | 849 |
| okt 2024 | 1.081 |
| okt 2025 | 1.122 |
| sep 2024 | 1.021 |
| sep 2025 | 871 |
These figures give an indicative picture of safety trends in the living environment of Arnhem.
Short answers based on current local statistics, handy for a quick comparison of the living environment.
Arnhem telt in 2026 ongeveer 171.822 inwoners.
De gemiddelde WOZ-waarde in Arnhem is in 2025 circa € 350.000.
Het gemiddelde inkomen per inwoner in Arnhem ligt rond € 33.300 per jaar.
Voor het huidige jaar gaat het om ongeveer 11.361 geregistreerde misdrijven. Gebruik deze cijfers als indicatie en vergelijk trends per periode.
In Arnhem komt vooral "Appartementen" veel voor, met ongeveer 41.243 woningen.