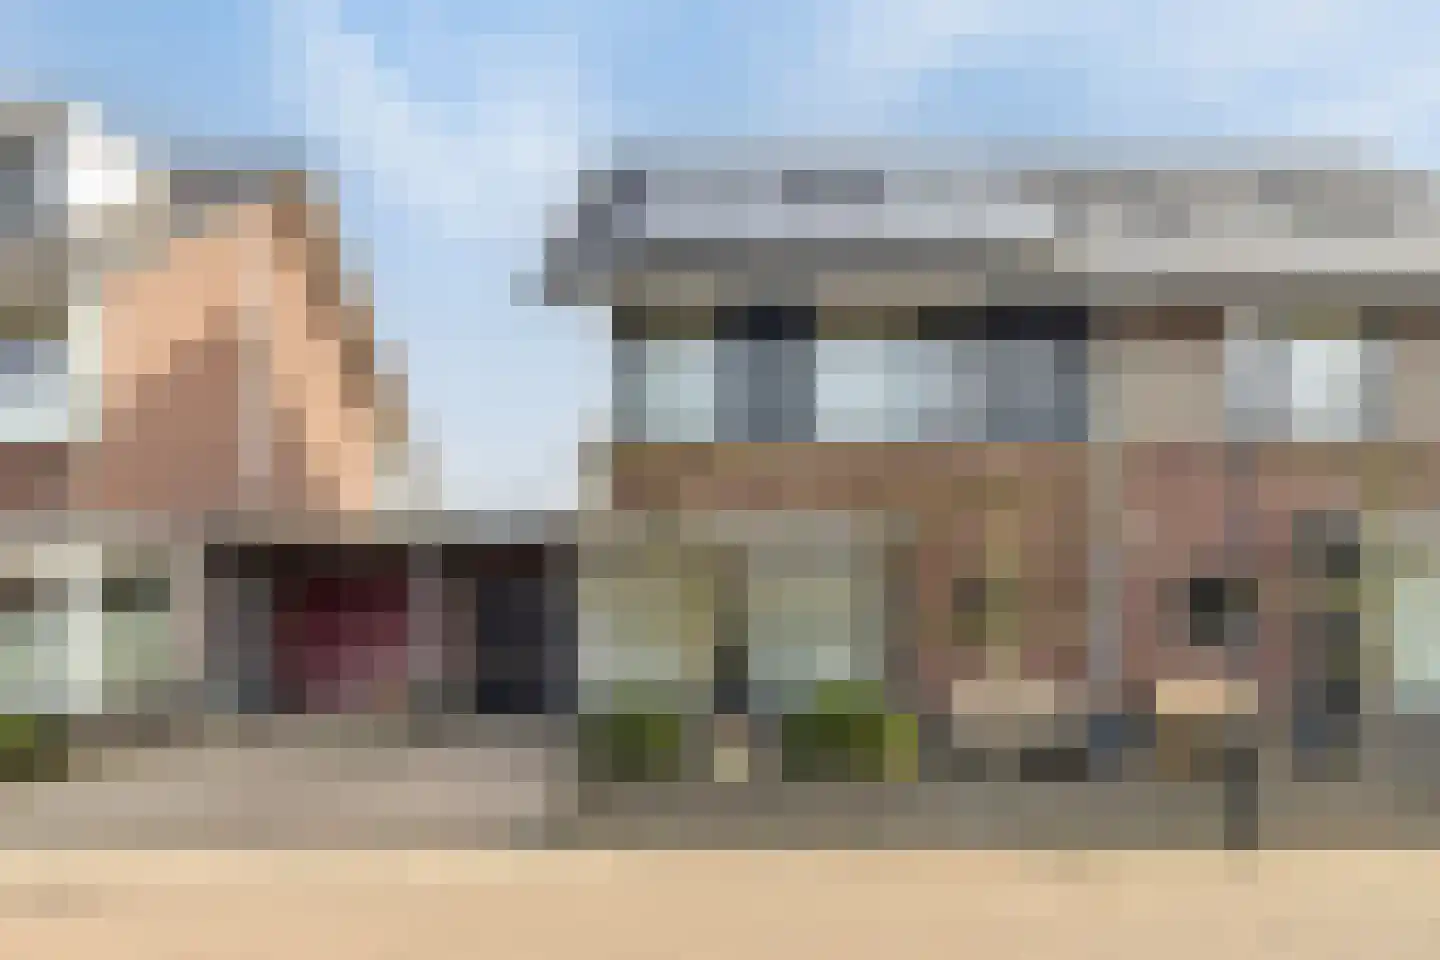
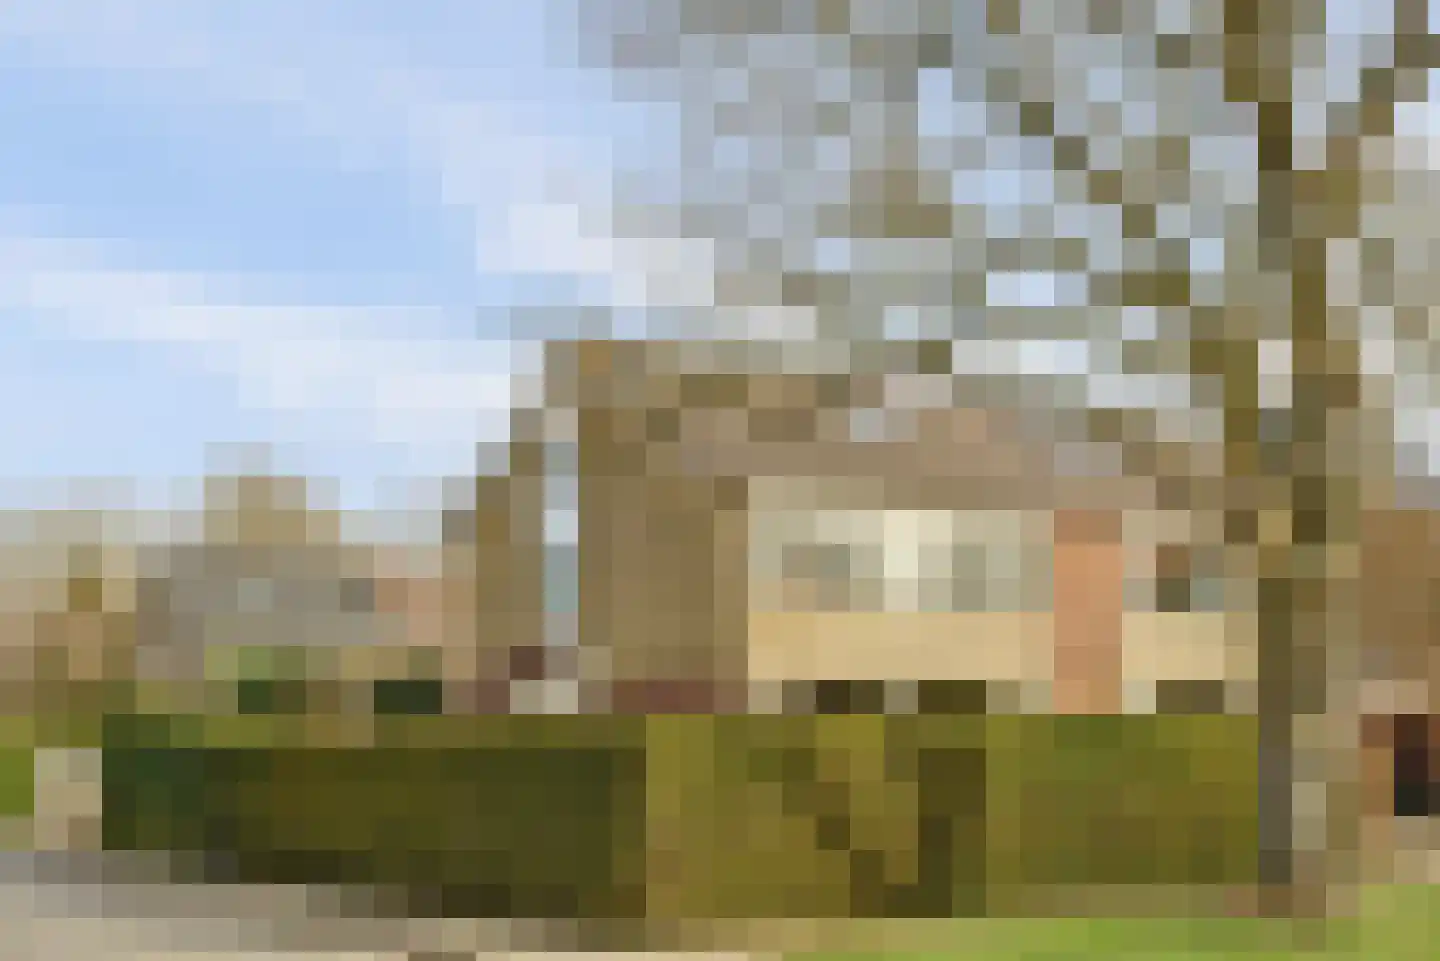
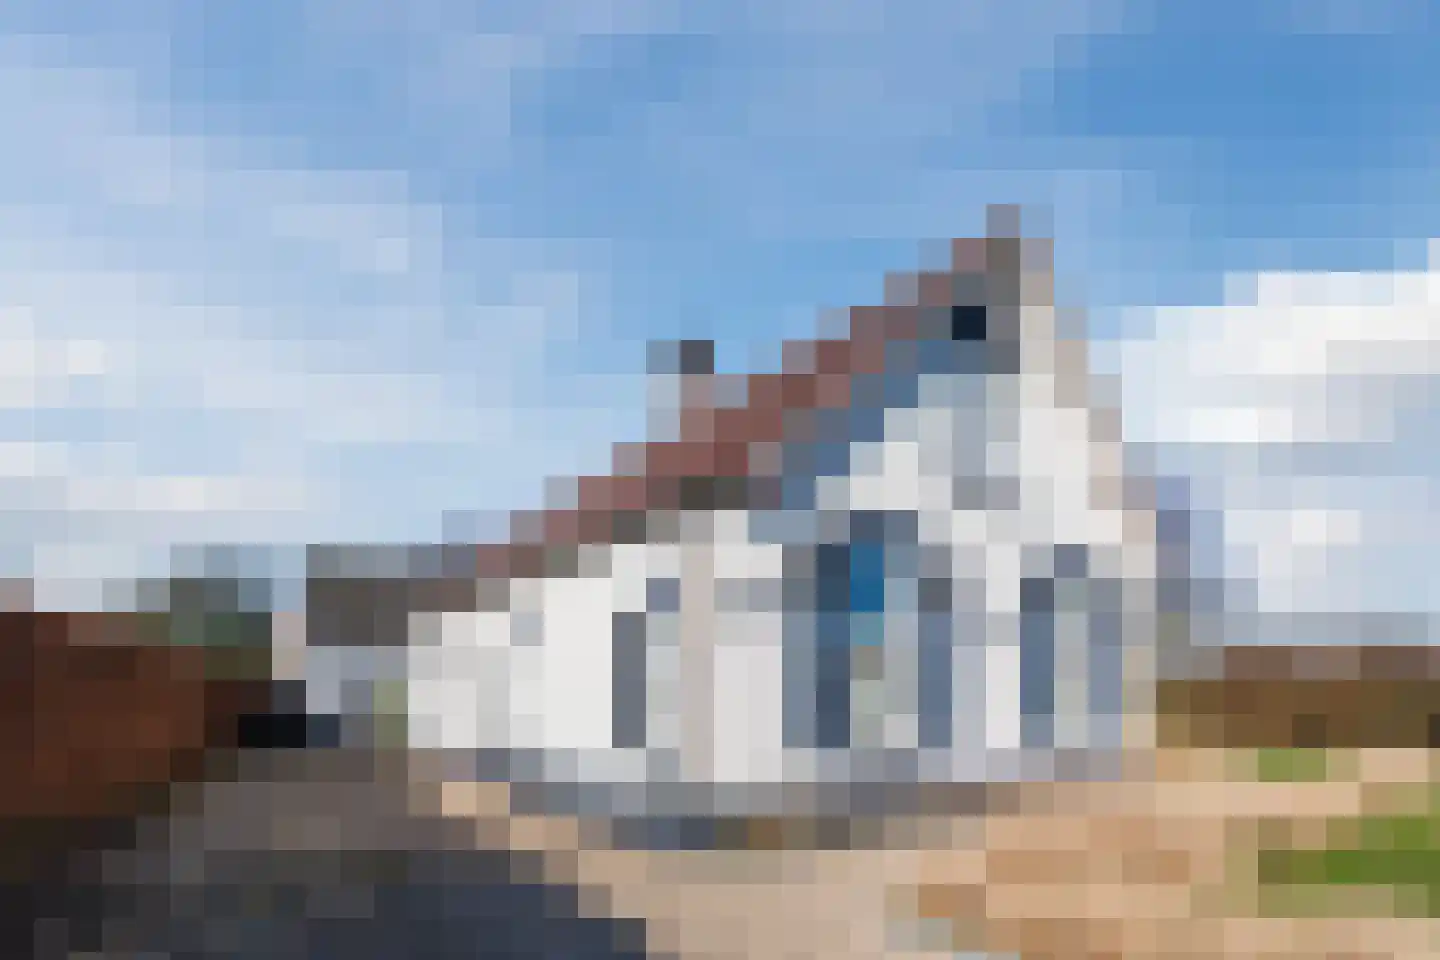
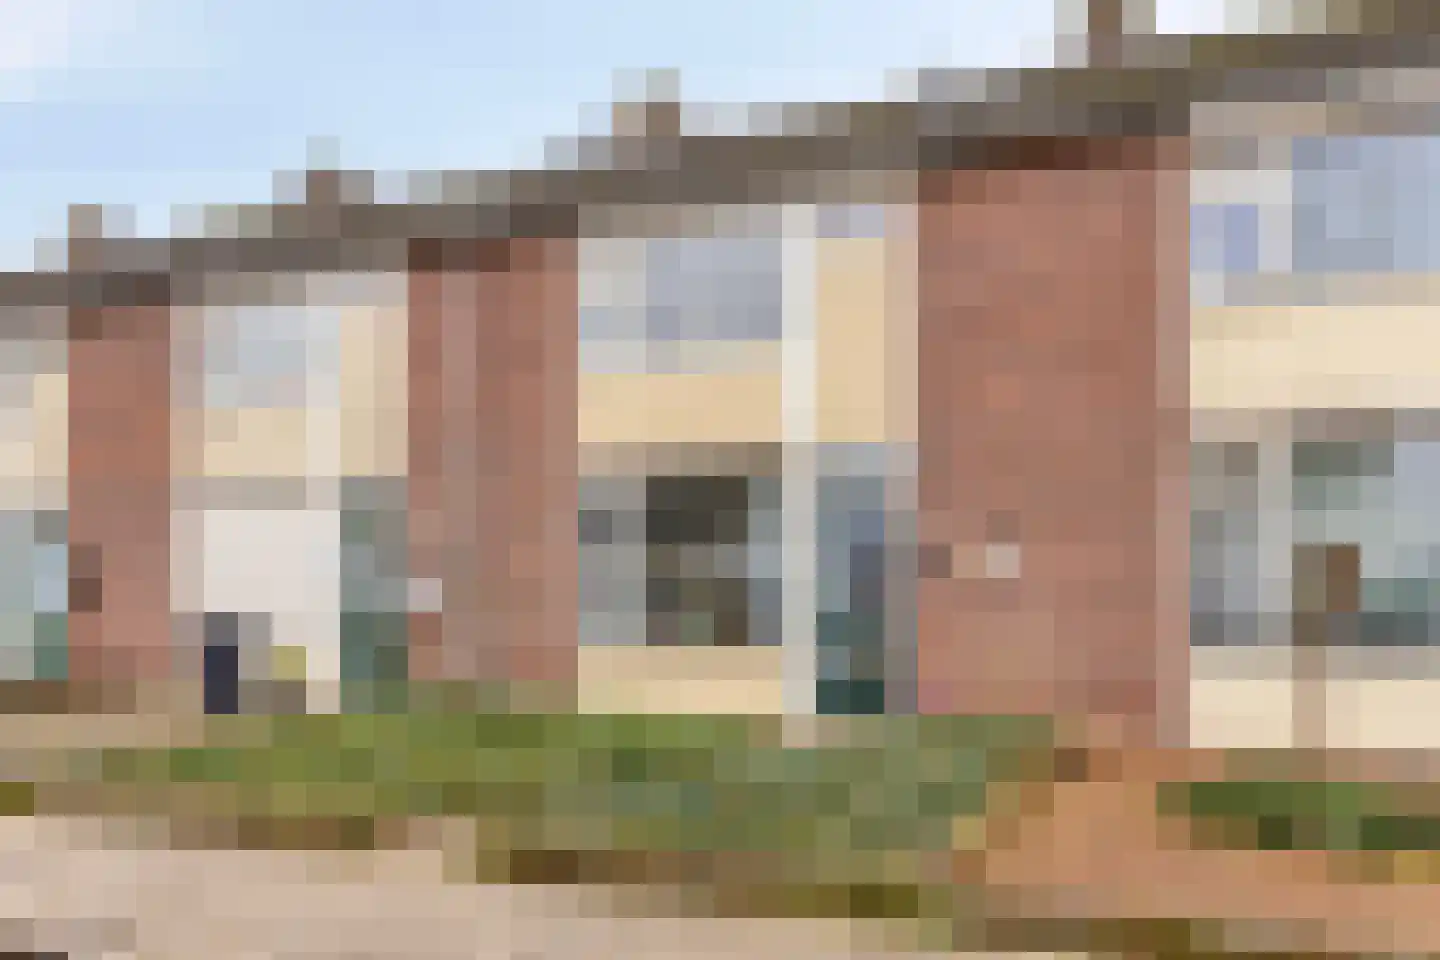
Houses sold in Bemmel

View 94 sold houses in Bemmel

Connected to: Vastgoed Nederland NVM Makelaars

On this page you will find recently sold homes in Bemmel. Use this overview to better estimate selling prices, popular neighborhoods, and the local housing supply before you choose a real estate agent. Also view the current housing supply with 133 houses in Bemmel.

Selection

Search and filter homes

Set your preferences and discover homes that suit you.

Total supply 241.450
Filters

Set price, area and other characteristics. Adjust a filter or click on Show homes. Location changes directly above.

Reset filters

You search for

  • Place Bemmel
  • Status Sold

Huis verkopen in Bemmel? Vergelijk verkoopmakelaars

Bekijk recente verkopen en ontvang gratis offertes van lokale verkoopmakelaars in Bemmel.

Free request a quote

  • Quotes in Bemmel
  • Non-binding
  • Personal
  • Gratis tarieven vergelijken

Recent verkocht in Bemmel? Lees de verkoopgerichte gids huis verkopen in Bemmel, vergelijk verkoopmakelaars in Bemmel of bekijk de beste verkoopmakelaars in Bemmel voor referentie bij jouw keuze.

Vergelijk meerdere offertes

Makelaars maken scherpere voorstellen als ze weten dat je vergelijkt — vraag offertes aan voor verkoop of aankoop.

Frequently asked questions about sold homes in Bemmel

Short answers about housing prices, sold homes and comparing real estate agents in Bemmel.

Residential and neighborhood statistics in Bemmel

View current location data on residents, WOZ development, housing stock, energy consumption, business activity and safety in Bemmel. In 2025 were there 12.265 residents. The average WOZ value in 2025 is EUR 429.000.

These figures help to better assess and compare the housing stock in Bemmel with recent sold homes. Orient yourself then on suitable top real estate agents in Bemmel for sales advice in this region.

Residents

12.265

Last year: 2025

Average WOZ

EUR 429.000

Last year: 2025

Average income per person.

EUR 36.300

Source: AllNumbers

Crimes (current year)

256

Total registered

Demographics and WOZ development

Inhabitants per year

Inhabitants per year in Bemmel
Year Residents
2021 12.206
2022 12.205
2023 12.325
2024 12.260
2025 12.265

Annual WOZ value

WOZ value per year in Bemmel
Year Average WOZ
2021 EUR 309.000
2022 EUR 345.000
2023 EUR 394.000
2024 EUR 414.000
2025 EUR 429.000

Composition of residents

Age build-up

65+: 3.100 0-15: 1.740 15-25: 1.480 25-45: 2.295 45-65: 3.650

Education level

Hoger

3.080

Praktisch

2.300

Middelbaar

3.710

Origin of residents (2025)

Europa

670

Nederland

10.775

Buiten Europa

815

Housing stock and construction periods

Types of homes

Hoekwoningen 987
Appartementen 958
Tussenwoningen 1.731
Vrijstaande woningen 1.067
Twee-onder-één-kap woningen 608

Construction period of buildings

Voor 1700 7
1700 tot 1900 66
1900 tot 1925 87
1925 tot 1950 227
1950 tot 1970 896
1970 tot 1980 1.187
1980 tot 1990 586
1990 tot 2000 842
2000 tot 2010 854
2010 tot 2020 86
2020 en later 144

Energy and sustainability

Energy label distribution

Label A

1.549

Label B

1.254

Label C

1.135

Label D

415

Label F

284

Label G

205

Label E

117

Label A+

99

Label A+++

91

Label A++

49

Label A++++

9

Label A+++++

3

Average energy consumption per year

Average energy consumption per year in Bemmel
Year Gas (m3) Electricity (kWh)
2020 1.340 3.200
2021 1.520 3.220
2022 1.130 2.860
2023 910 2.740
2024 900 2.880

Consumption per house type

Hoekwoning

Gas: 880 • Electricity: 2.600

Huurwoning

Gas: 690 • Electricity: 1.780

Koopwoning

Gas: 990 • Electricity: 3.070

Appartement

Gas: 620 • Electricity: 1.710

Tussenwoning

Gas: 800 • Electricity: 2.520

Vrijstaande woning

Gas: 1.300 • Electricity: 3.870

Twee-onder-één-kap woning

Gas: 1.070 • Electricity: 3.210

Business activity in Bemmel (2025)

Handel en HORECA 250
Nijverheid en energie 180
Zakelijke dienstverlening 360
Overheid, onderwijs en zorg 325
Landbouw, bosbouw en visserij 45
Vervoer, informatie en communicatie 80
Financiele diensten en onroerendgoed 95
Cultuur, recreatie en overige diensten 145

Total number of company establishments: 1.475

Recent crime statistics

Recent crime statistics in Bemmel
Period Crimes
jan 2025 15
jan 2026 23
jul 2025 14
jun 2025 27
mei 2025 17
mrt 2025 14
nov 2024 20
nov 2025 25
okt 2024 19
okt 2025 30
sep 2024 18
sep 2025 26

These figures give an indicative picture of safety trends in the living environment of Bemmel.

Frequently asked questions about living in Bemmel

Short answers based on current local statistics, handy for a quick comparison of the living environment.

Hoeveel inwoners heeft Bemmel?

Bemmel telt in 2025 ongeveer 12.265 inwoners.

Wat is de gemiddelde WOZ-waarde in Bemmel?

De gemiddelde WOZ-waarde in Bemmel is in 2025 circa € 429.000.

Wat is het gemiddelde inkomen per inwoner in Bemmel?

Het gemiddelde inkomen per inwoner in Bemmel ligt rond € 36.300 per jaar.

Hoe veilig is wonen in Bemmel?

Voor het huidige jaar gaat het om ongeveer 256 geregistreerde misdrijven. Gebruik deze cijfers als indicatie en vergelijk trends per periode.

Welke woningtypen komen het meest voor in Bemmel?

In Bemmel komt vooral "Tussenwoningen" veel voor, met ongeveer 1.731 woningen.

Gratis vrijblijvende offertes ontvangen

Vergelijk meerdere makelaars en kies de beste match.