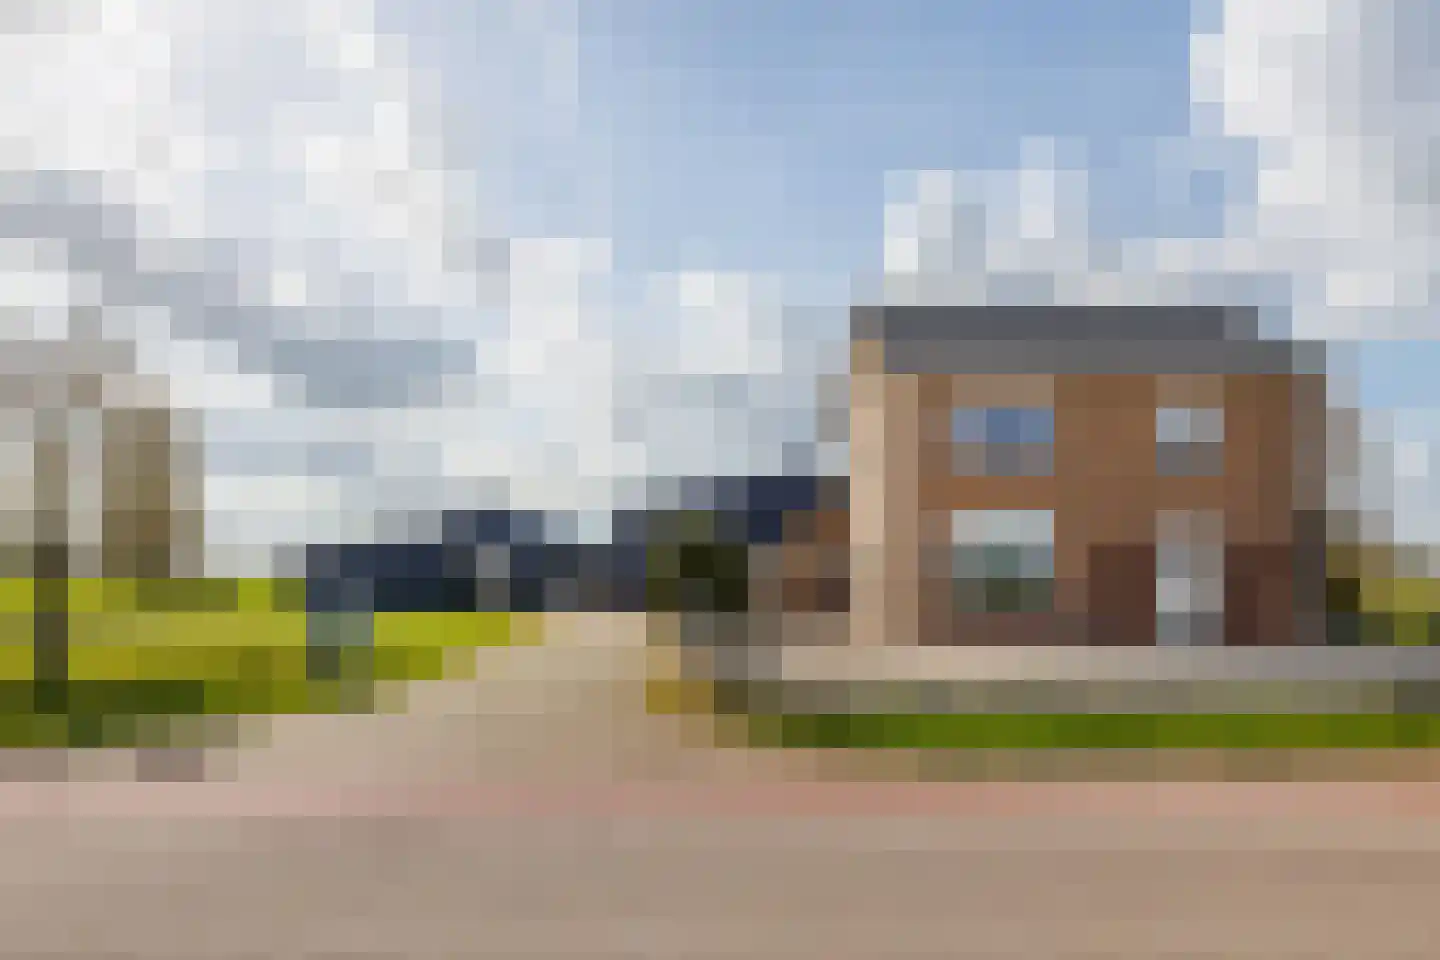
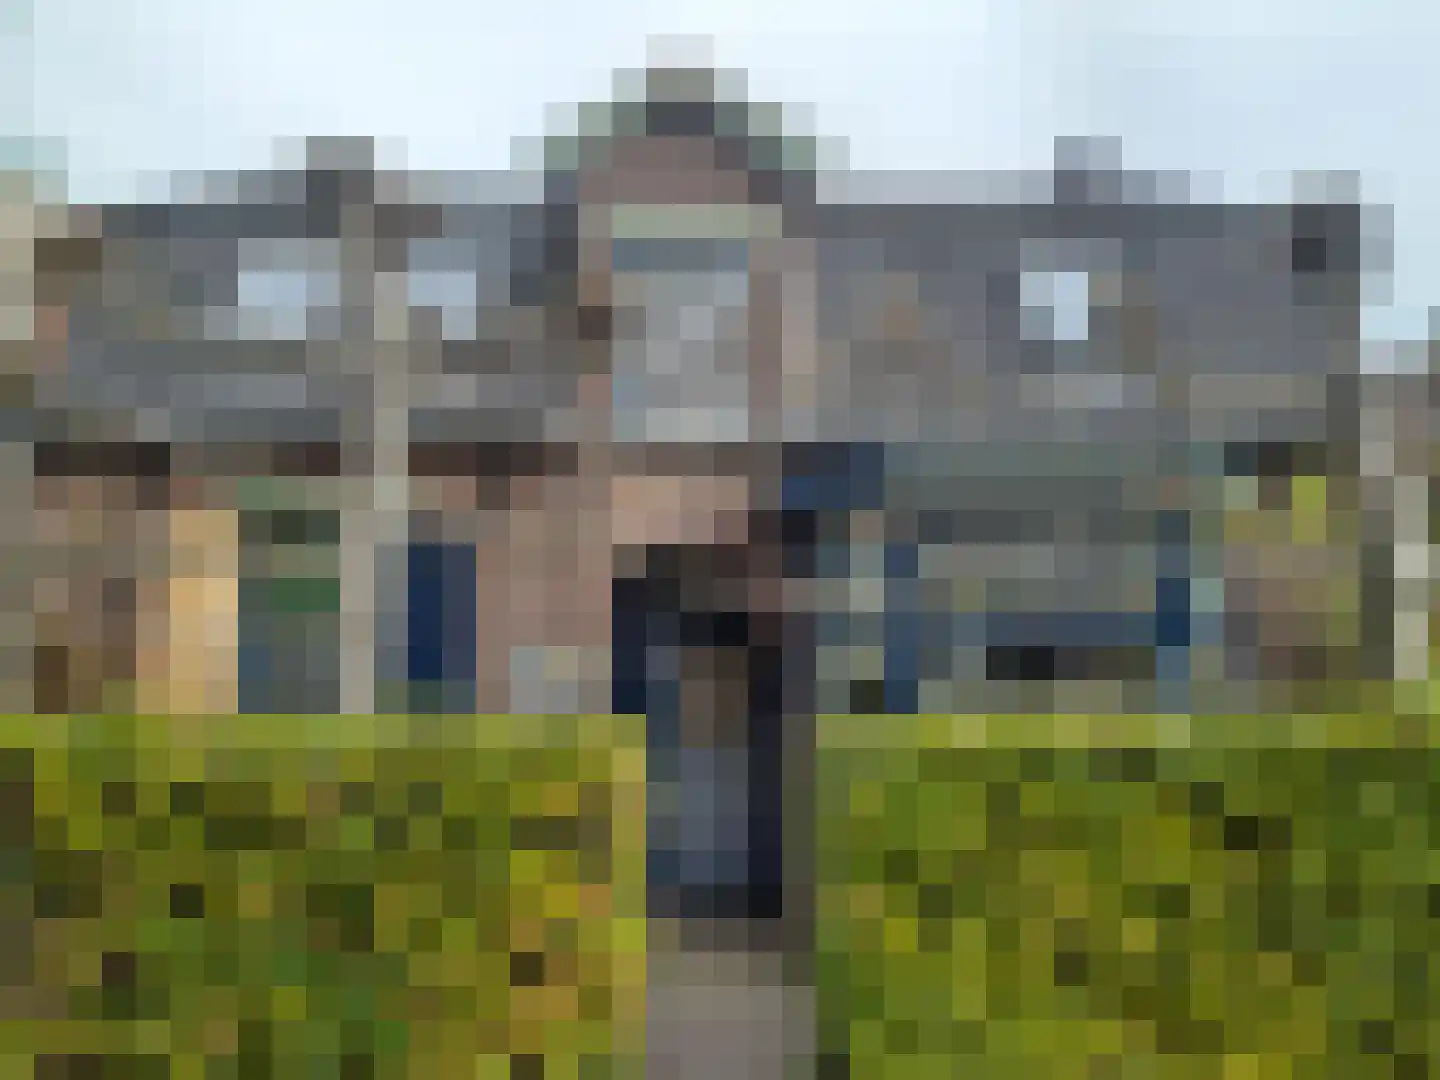
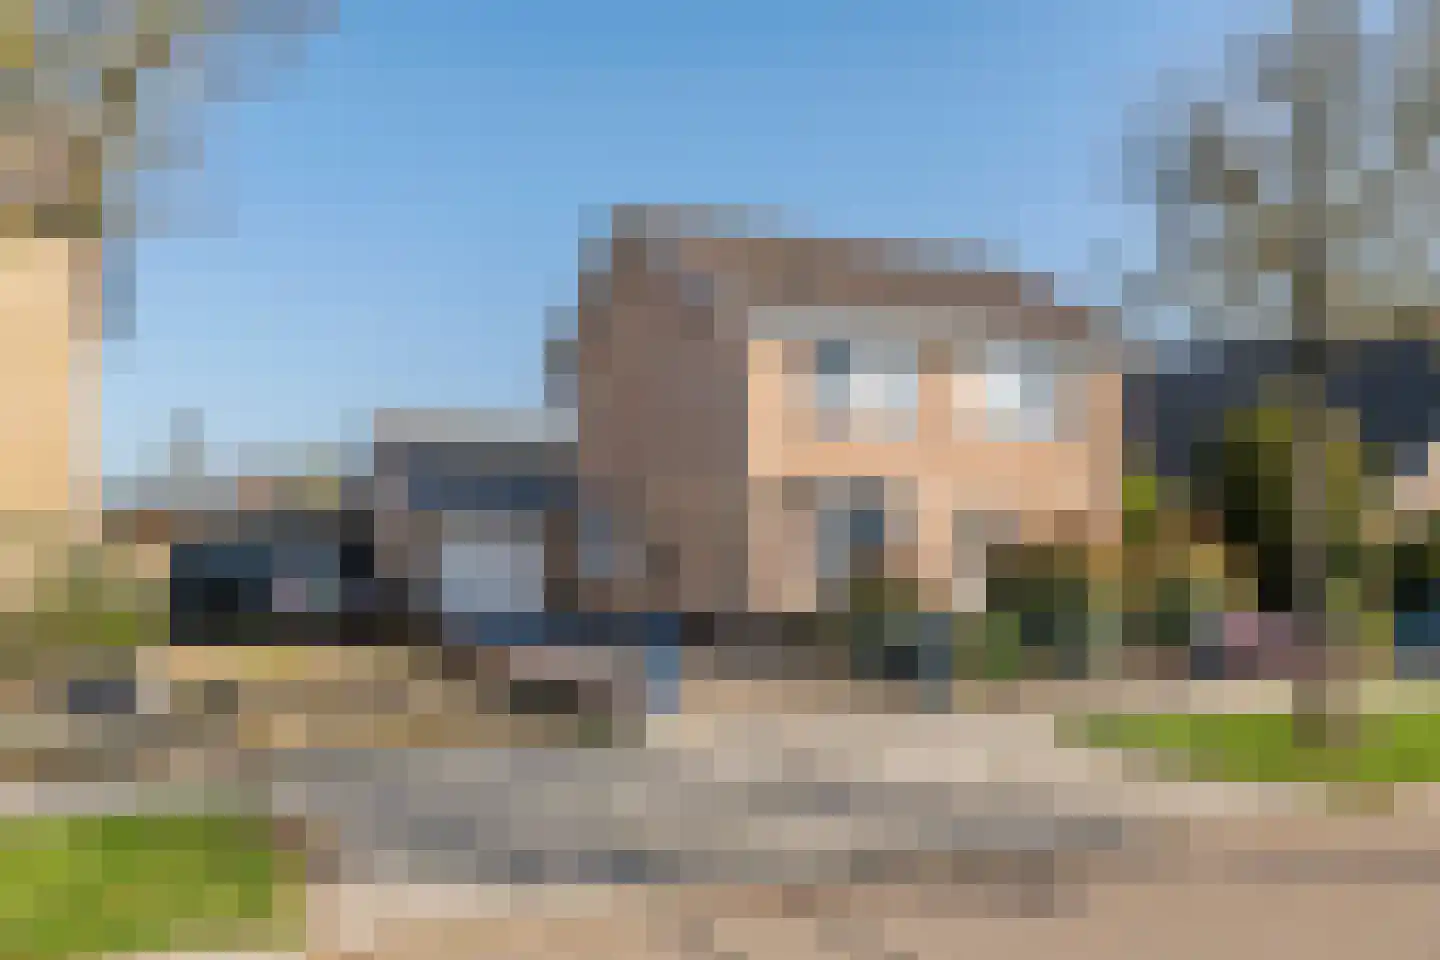
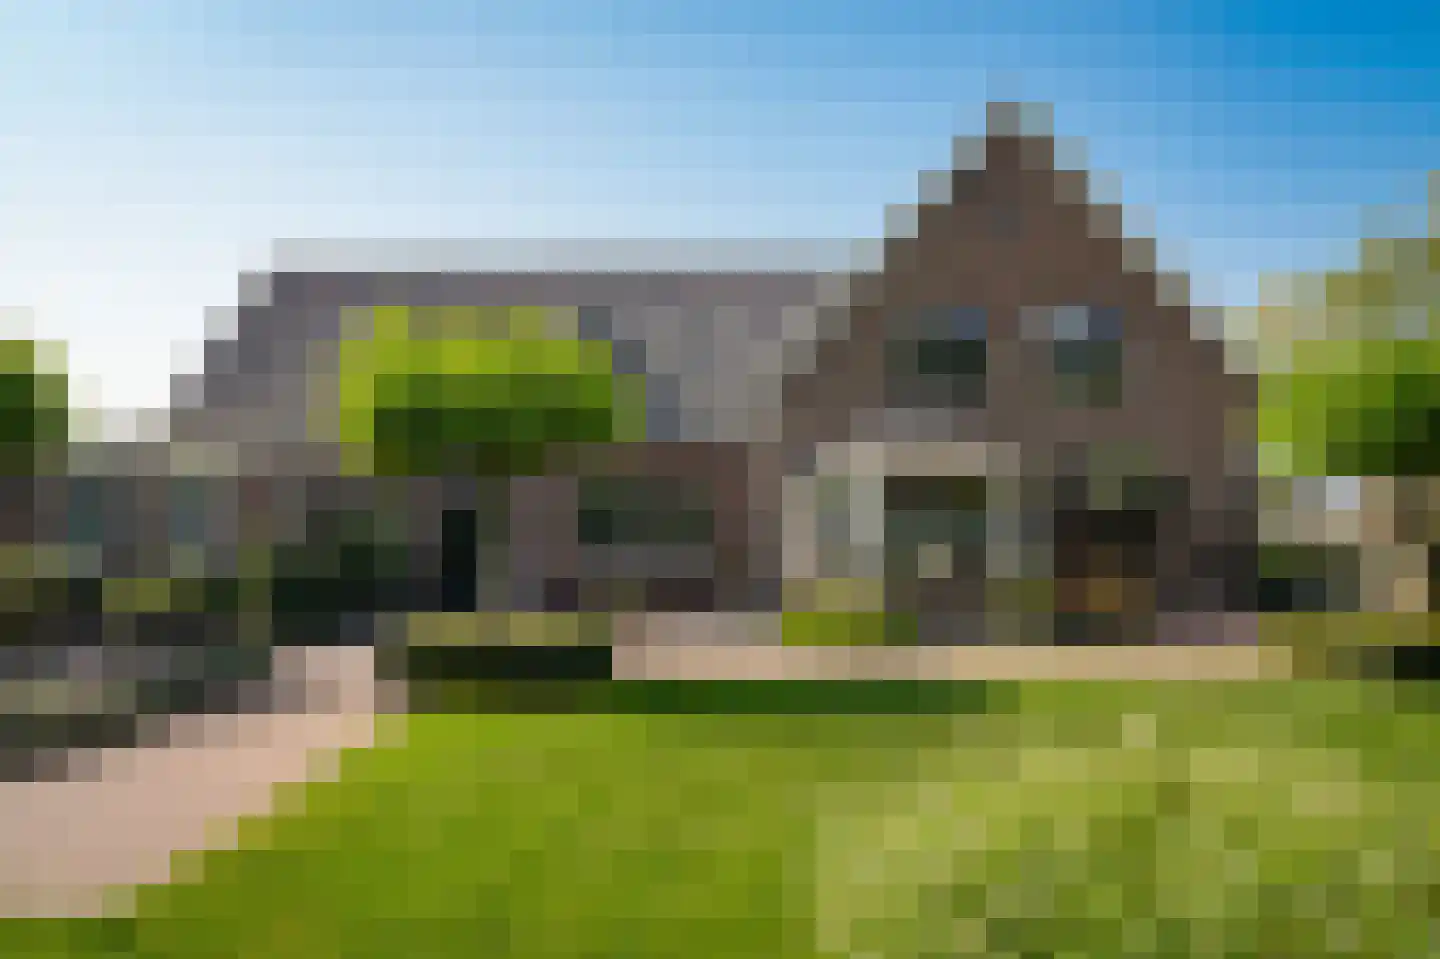
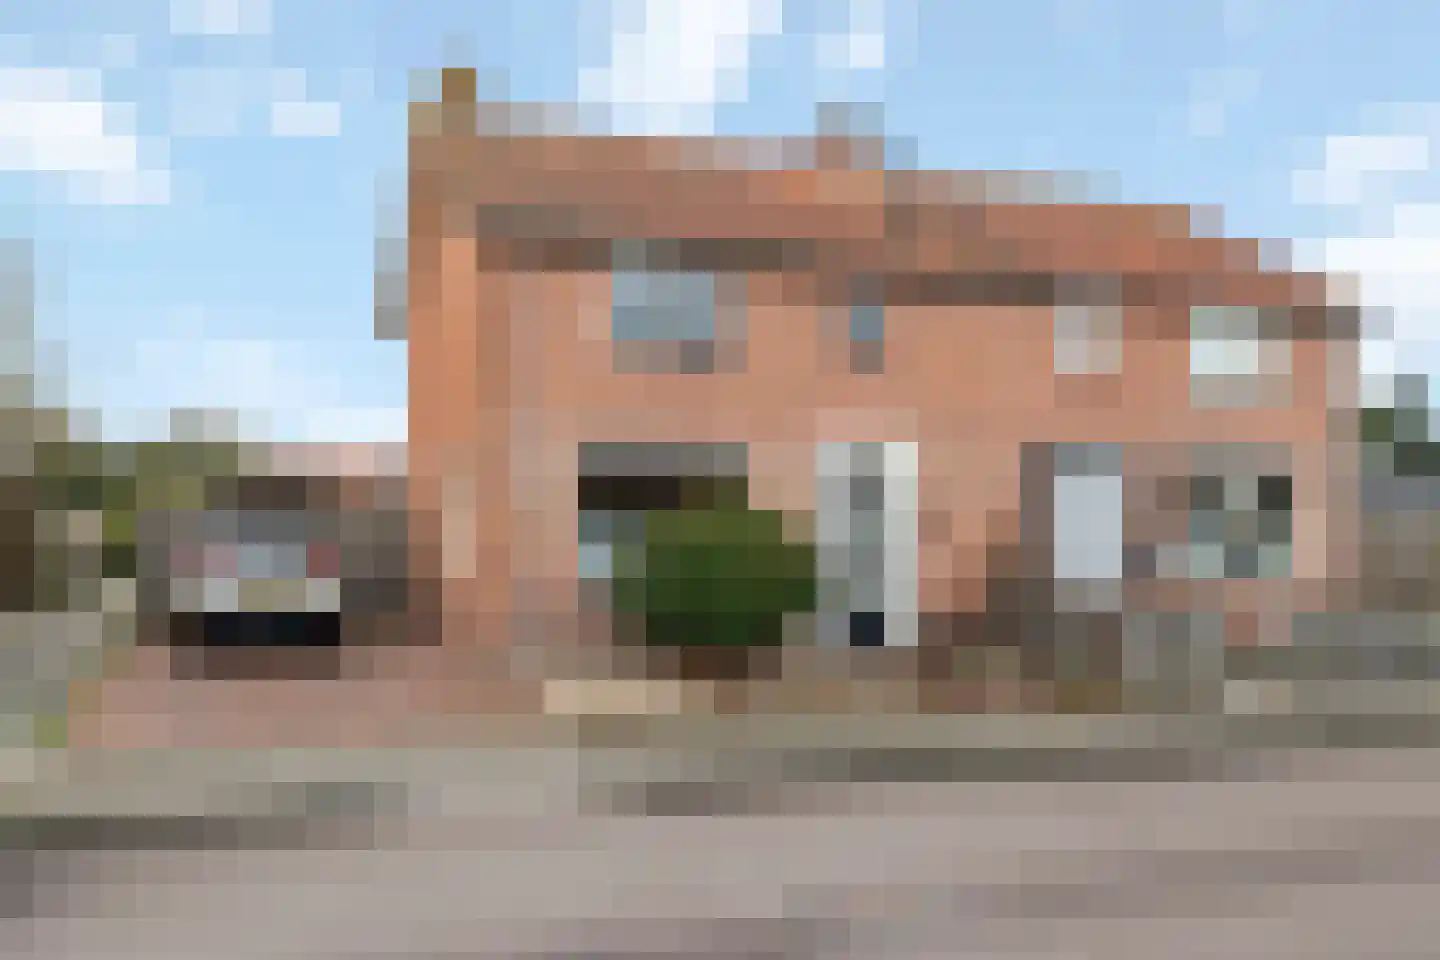
Housing offer in Boven-Leeuwen

Found: 29 houses in Boven-Leeuwen within your selection

Connected to: Vastgoed Nederland NVM Makelaars

View the current housing stock in Boven-Leeuwen and quickly filter by price, living area, rooms and more. There are currently 29 houses in this place within our selection. View also 21 sold houses in Boven-Leeuwen for extra insight into the local housing market.

Selection

Search and filter homes

Set your preferences and discover homes that suit you.

Total supply 240.351
Filters

Set price, area and other characteristics. Adjust a filter or click on Show homes. Location changes directly above.

Reset filters

You search for

  • Place Boven-Leeuwen

Selling a home in Boven-Leeuwen? Compare realtor offers

Get free quotes from realtors with local market knowledge in Boven-Leeuwen.

Free request a quote

  • Quotes in Boven-Leeuwen
  • Non-binding
  • Personal
  • Free property website

Selling a home in Boven-Leeuwen? Compare real estate agents who know the local housing market. Also check out all real estate agents in Boven-Leeuwen or the top 10 real estate agents in Boven-Leeuwen for extra context for your choice.

Save an average of €5000,-

By comparing brokers and requesting quotes

Frequently asked questions about homes in Boven-Leeuwen

Practical answers about housing supply, sales and comparing real estate agents in Boven-Leeuwen.

Residential and neighborhood statistics in Boven-Leeuwen

View current location data on residents, WOZ development, housing stock, energy consumption, business activity and safety in Boven-Leeuwen. In 2026 were there 2.327 residents. The average WOZ value in 2025 is EUR 461.000.

These figures help to better assess and compare the housing stock in Boven-Leeuwen with recent sold homes. Orient yourself then on suitable top real estate agents in Boven-Leeuwen for sales advice in this region.

Residents

2.327

Last year: 2026

Average WOZ

EUR 461.000

Last year: 2025

Average income per person.

EUR 32.400

Source: AllNumbers

Crimes (current year)

40

Total registered

Demographics and WOZ development

Inhabitants per year

Inhabitants per year in Boven-Leeuwen
Year Residents
2021 2.245
2022 2.250
2023 2.250
2024 2.250
2025 2.265
2026 2.327

Annual WOZ value

WOZ value per year in Boven-Leeuwen
Year Average WOZ
2021 EUR 318.000
2022 EUR 345.000
2023 EUR 413.000
2024 EUR 425.000
2025 EUR 461.000

Composition of residents

Age build-up

65+: 520 0-15: 345 15-25: 245 25-45: 515 45-65: 700

Education level

Hoger

430

Praktisch

370

Middelbaar

930

Origin of residents (2025)

Europa

120

Nederland

2.005

Buiten Europa

140

Housing stock and construction periods

Types of homes

Hoekwoningen 128
Appartementen 77
Tussenwoningen 133
Vrijstaande woningen 452
Twee-onder-één-kap woningen 171

Construction period of buildings

Voor 1700 4
1700 tot 1900 39
1900 tot 1925 83
1925 tot 1950 109
1950 tot 1970 205
1970 tot 1980 157
1980 tot 1990 83
1990 tot 2000 130
2000 tot 2010 43
2010 tot 2020 99
2020 en later 60

Energy and sustainability

Energy label distribution

Label A

287

Label C

187

Label G

142

Label B

129

Label D

93

Label F

61

Label E

33

Label A+++

30

Label A+

19

Label A++

11

Label A++++

4

Label A+++++

1

Average energy consumption per year

Average energy consumption per year in Boven-Leeuwen
Year Gas (m3) Electricity (kWh)
2020 1.530 3.490
2021 1.710 3.590
2022 1.300 3.480
2023 1.050 3.390
2024 1.030 3.590

Consumption per house type

Hoekwoning

Gas: 750 • Electricity: 2.480

Huurwoning

Gas: 810 • Electricity: 2.290

Koopwoning

Gas: 1.140 • Electricity: 3.800

Appartement

Gas: 760 • Electricity: 2.480

Tussenwoning

Gas: 730 • Electricity: 2.420

Vrijstaande woning

Gas: 1.330 • Electricity: 4.180

Twee-onder-één-kap woning

Gas: 940 • Electricity: 3.230

Business activity in Boven-Leeuwen (2025)

Handel en HORECA 80
Nijverheid en energie 95
Zakelijke dienstverlening 95
Overheid, onderwijs en zorg 50
Landbouw, bosbouw en visserij 25
Vervoer, informatie en communicatie 25
Financiele diensten en onroerendgoed 15
Cultuur, recreatie en overige diensten 40

Total number of company establishments: 425

Recent crime statistics

Recent crime statistics in Boven-Leeuwen
Period Crimes
jan 2026 5
jul 2025 2
jun 2025 7
mei 2025 3
mrt 2025 3
mrt 2026 5
nov 2024 6
nov 2025 3
okt 2024 1
okt 2025 1
sep 2024 2
sep 2025 2

These figures give an indicative picture of safety trends in the living environment of Boven-Leeuwen.

Frequently asked questions about living in Boven-Leeuwen

Short answers based on current local statistics, handy for a quick comparison of the living environment.

Hoeveel inwoners heeft Boven-Leeuwen?

Boven-Leeuwen telt in 2026 ongeveer 2.327 inwoners.

Wat is de gemiddelde WOZ-waarde in Boven-Leeuwen?

De gemiddelde WOZ-waarde in Boven-Leeuwen is in 2025 circa € 461.000.

Wat is het gemiddelde inkomen per inwoner in Boven-Leeuwen?

Het gemiddelde inkomen per inwoner in Boven-Leeuwen ligt rond € 32.400 per jaar.

Hoe veilig is wonen in Boven-Leeuwen?

Voor het huidige jaar gaat het om ongeveer 40 geregistreerde misdrijven. Gebruik deze cijfers als indicatie en vergelijk trends per periode.

Welke woningtypen komen het meest voor in Boven-Leeuwen?

In Boven-Leeuwen komt vooral "Vrijstaande woningen" veel voor, met ongeveer 452 woningen.