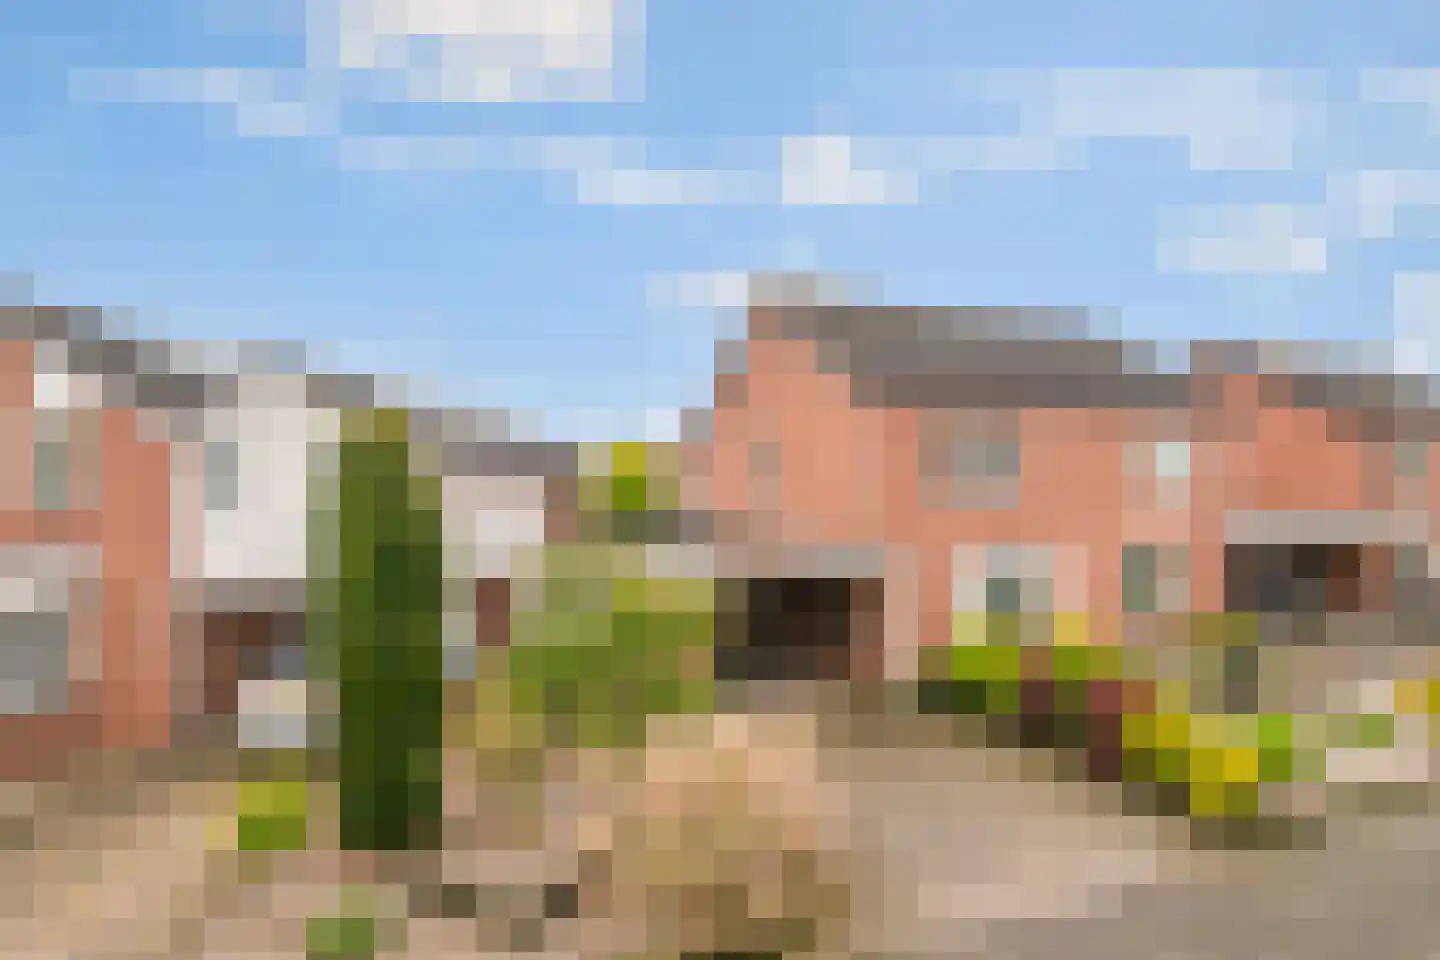
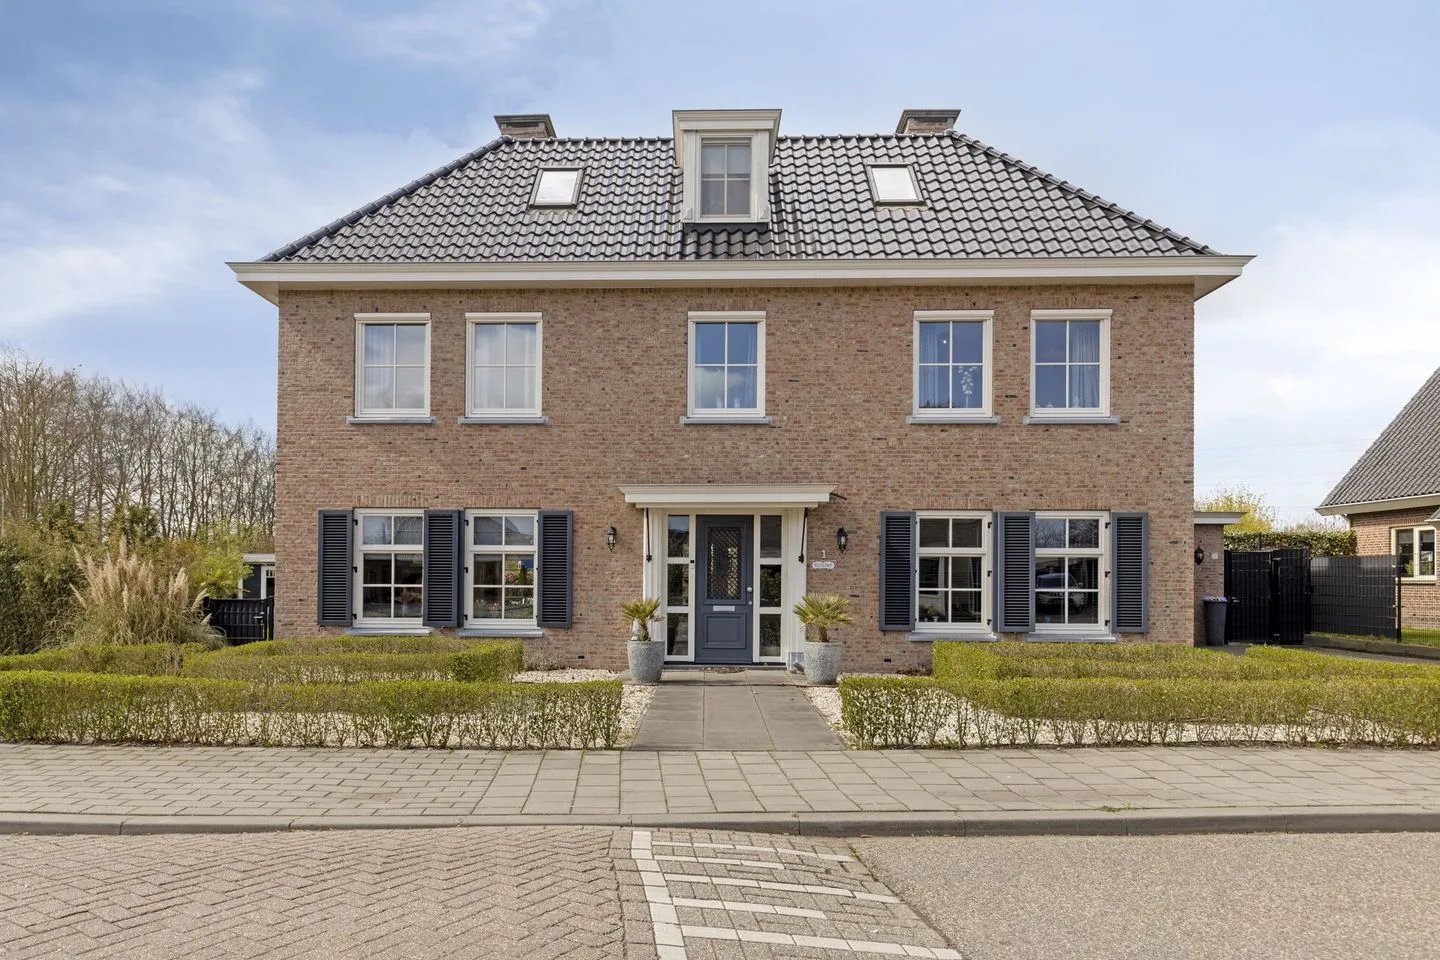
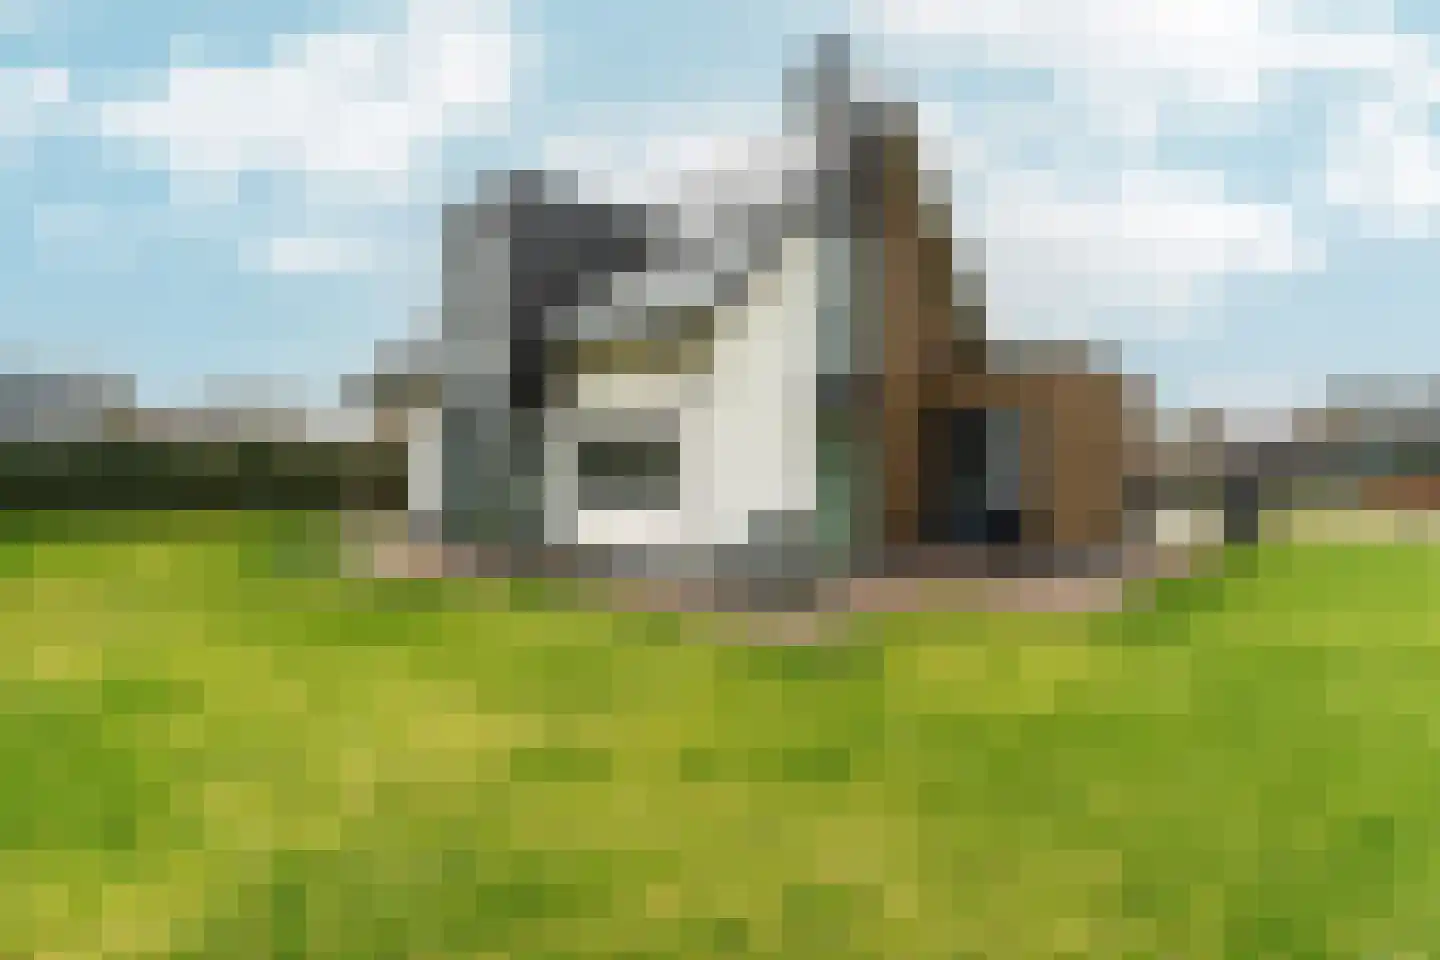
- Available
Sperwerstraat 20
6942KX Didam
€ 325.000 k.k.
€ 4.167/m²
- Living area
- 78 m²
- Land area
- 218 m²
- Bedrooms
- 2
Searching in 152 houses in Didam
Type to search. Use arrow down and arrow up to navigate through results and press Enter to open.
Hidden search suggestions.
View current properties in Didam or search targeted on street, postal code and property characteristics.
View the current housing stock in Didam and quickly filter by price, living area, rooms and more. There are currently 152 houses in this place within our selection. View also 116 sold houses in Didam for extra insight into the local housing market.
6942KX Didam
€ 325.000 k.k.
€ 4.167/m²
6942KK Didam
€ 375.000 k.k.
€ 3.289/m²
6942XK Didam
€ 300.000 k.k.
€ 3.371/m²
6941AS Didam
€ 385.000 k.k.
€ 4.583/m²
6942DP Didam
€ 310.000 k.k.
€ 2.897/m²
6941CB Didam
€ 495.000 k.k.
€ 2.578/m²
6941AS Didam
€ 350.000 k.k.
€ 3.846/m²
6941BL Didam
€ 479.000 k.k.
€ 2.801/m²
6942CE Didam
€ 300.000 k.k.
6942RN Didam
€ 519.000 k.k.
6941BK Didam
€ 449.000 k.k.
6941BG Didam
€ 648.000 k.k.
€ 3.767/m²
6942GP Didam
€ 845.000 k.k.
€ 3.658/m²
6942XP Didam
€ 495.000 k.k.
€ 3.667/m²
6942HS Didam
€ 1.395.000 k.k.
€ 4.745/m²
6942GG Didam
€ 599.000 k.k.
€ 5.816/m²
6941CG Didam
€ 795.000 k.k.
€ 2.331/m²
6942VD Didam
€ 459.000 k.k.
€ 5.598/m²
6941BC Didam
€ 385.000 k.k.
€ 3.667/m²
6942DZ Didam
€ 569.000 k.k.
€ 4.123/m²
6942GL Didam
€ 549.000 k.k.
€ 4.653/m²
6942NC Didam
€ 898.000 k.k.
€ 6.369/m²
6942ET Didam
€ 529.000 k.k.
€ 1.322/m²
6942PD Didam
€ 845.000 k.k.
€ 5.452/m²
6942RD Didam
€ 435.000 k.k.
€ 3.991/m²
6942LG Didam
€ 335.000 k.k.
€ 2.792/m²
6942PG Didam
€ 715.000 k.k.
6942MR Didam
€ 529.000 k.k.
€ 3.094/m²
Get free quotes from real estate agents with local market knowledge. Compare more than 28 real estate agents in Didam.
Selling a home in Didam? View the sales-oriented guide sell a house in Didam, compare all real estate agents in Didam or view the top 10 real estate agents in Didam for extra context to your choice.
Real estate agents make sharper offers when they know you're comparing — ask for quotes for sale or purchase.
Practical answers about housing supply, sales and comparing real estate agents in Didam.
The costs of a real estate agent in Didam depend on commission, setup costs, property presentation and the chosen service. Compare the 28 real estate agents in Didam via the real estate agent page and request multiple quotes to compare rates and approach well.
Within our selection, we are currently showing 152 houses in Didam. View also the sold houses in Didam to compare the current offering with recent transactions.
Take into account not only price and living area but also maintenance, energy label, location, outdoor space and sales status. This way you compare houses in Didam on more than just the asking price.
A local real estate agent knows the neighborhoods, recent transactions and demand in Didam. By comparing 28 real estate agents in the region you get a better insight into prices, sales strategy and expected yield; the top 10 in Didam provides a useful starting point.
Yes, when making a sales plan, a valuation in Didam is wise. You gain insight into a realistic asking price and can then compare offers from real estate agents specifically.
View current location data on residents, WOZ development, housing stock, energy consumption, business activity and safety in Didam. In 2026 were there 17.649 residents. The average WOZ value in 2025 is EUR 327.000.
These figures help to better assess and compare the housing stock in Didam with recent sold homes. Orient yourself then on suitable top real estate agents in Didam for sales advice in this region.
Residents
17.649
Last year: 2026
Average WOZ
EUR 327.000
Last year: 2025
Average income per person.
EUR 32.600
Source: AllNumbers
Crimes (current year)
309
Total registered
| Year | Residents |
|---|---|
| 2021 | 16.960 |
| 2022 | 17.185 |
| 2023 | 17.390 |
| 2024 | 17.445 |
| 2025 | 17.535 |
| 2026 | 17.649 |
| Year | Average WOZ |
|---|---|
| 2021 | EUR 236.000 |
| 2022 | EUR 257.000 |
| 2023 | EUR 286.000 |
| 2024 | EUR 300.000 |
| 2025 | EUR 327.000 |
Hoger
3.180
Praktisch
3.790
Middelbaar
5.970
Europa
975
Nederland
15.385
Buiten Europa
1.175
Label C
1.883
Label A
1.784
Label B
1.343
Label D
839
Label F
481
Label G
430
Label A+++
300
Label E
227
Label A++
148
Label A+
137
Label A++++
102
Label A+++++
0
| Year | Gas (m3) | Electricity (kWh) |
|---|---|---|
| 2020 | 1.330 | 3.140 |
| 2021 | 1.490 | 3.170 |
| 2022 | 1.160 | 2.980 |
| 2023 | 930 | 2.870 |
| 2024 | 880 | 2.960 |
Hoekwoning
Gas: 870 • Electricity: 2.580
Huurwoning
Gas: 700 • Electricity: 2.060
Koopwoning
Gas: 1.050 • Electricity: 3.300
Appartement
Gas: 610 • Electricity: 2.100
Tussenwoning
Gas: 800 • Electricity: 2.390
Vrijstaande woning
Gas: 1.270 • Electricity: 3.910
Twee-onder-één-kap woning
Gas: 950 • Electricity: 3.020
Total number of company establishments: 1.935
| Period | Crimes |
|---|---|
| jan 2026 | 21 |
| jul 2025 | 13 |
| jun 2025 | 25 |
| mei 2025 | 30 |
| mrt 2025 | 27 |
| mrt 2026 | 27 |
| nov 2024 | 39 |
| nov 2025 | 20 |
| okt 2024 | 39 |
| okt 2025 | 30 |
| sep 2024 | 20 |
| sep 2025 | 22 |
These figures give an indicative picture of safety trends in the living environment of Didam.
Short answers based on current local statistics, handy for a quick comparison of the living environment.
Didam telt in 2026 ongeveer 17.649 inwoners.
De gemiddelde WOZ-waarde in Didam is in 2025 circa € 327.000.
Het gemiddelde inkomen per inwoner in Didam ligt rond € 32.600 per jaar.
Voor het huidige jaar gaat het om ongeveer 309 geregistreerde misdrijven. Gebruik deze cijfers als indicatie en vergelijk trends per periode.
In Didam komt vooral "Vrijstaande woningen" veel voor, met ongeveer 2.019 woningen.