- Sold
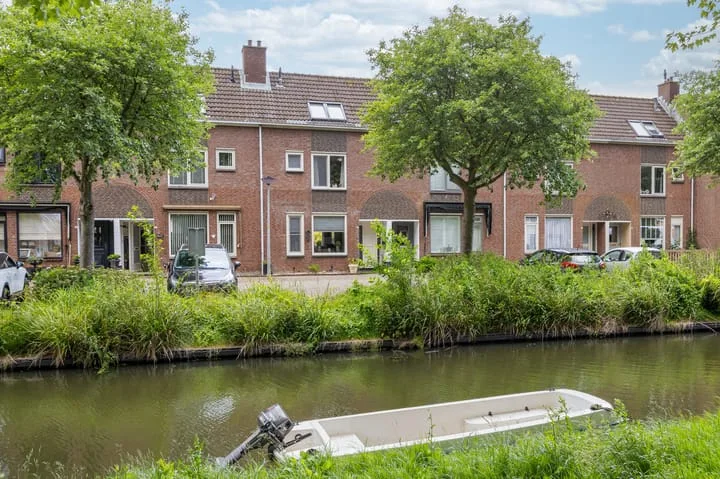
Zuider Boerenvaart 36
1601CD Enkhuizen
€ 550.000 k.k.
€ 3.956/m²
- Living area
- 139 m²
- Land area
- 127 m²
- Bedrooms
- 4
View 181 sold houses in Enkhuizen
Type to search. Use arrow down and arrow up to navigate through results and press Enter to open.
Hidden search suggestions.
Compare sold homes in Enkhuizen or view the current offering in this location directly.
On this page you will find recently sold homes in Enkhuizen. Use this overview to better estimate selling prices, popular neighborhoods, and the local housing supply before you choose a real estate agent. Also view the current housing supply with 232 houses in Enkhuizen.
1601CD Enkhuizen
€ 550.000 k.k.
€ 3.956/m²
1602MA Enkhuizen
€ 419.000 k.k.
€ 2.850/m²
1602ER Enkhuizen
€ 250.000 k.k.
€ 4.716/m²
1602JD Enkhuizen
€ 435.000 k.k.
€ 4.306/m²
1601SV Enkhuizen
€ 345.000 k.k.
€ 3.920/m²
1602BA Enkhuizen
€ 498.000 k.k.
€ 3.744/m²
1601RB Enkhuizen
€ 285.000 k.k.
€ 4.596/m²
1601MP Enkhuizen
€ 395.000 k.k.
€ 4.702/m²
1601GC Enkhuizen
€ 265.000 k.k.
€ 3.271/m²
1602CS Enkhuizen
€ 895.000 k.k.
€ 4.105/m²
1601KD Enkhuizen
€ 450.000 k.k.
€ 4.368/m²
1601EJ Enkhuizen
€ 365.000 k.k.
€ 3.967/m²
1602LV Enkhuizen
€ 295.000 k.k.
€ 3.314/m²
1602PC Enkhuizen
€ 285.000 k.k.
€ 2.766/m²
1602LP Enkhuizen
€ 365.000 k.k.
€ 3.650/m²
1601CV Enkhuizen
€ 299.000 k.k.
€ 7.666/m²
1602EK Enkhuizen
€ 350.000 k.k.
€ 2.966/m²
1602SZ Enkhuizen
€ 419.000 k.k.
€ 3.879/m²
1601EK Enkhuizen
€ 619.000 k.k.
€ 6.381/m²
1602EN Enkhuizen
€ 259.000 k.k.
€ 4.886/m²
1602EV Enkhuizen
€ 275.000 k.k.
€ 3.021/m²
1602SE Enkhuizen
€ 475.000 k.k.
€ 4.611/m²
1602TC Enkhuizen
€ 375.000 k.k.
€ 3.440/m²
1602NN Enkhuizen
€ 300.000 k.k.
€ 2.542/m²
1602PR Enkhuizen
€ 335.000 k.k.
€ 3.160/m²
1602RD Enkhuizen
€ 349.500 k.k.
€ 2.688/m²
1601KE Enkhuizen
€ 600.000 k.k.
€ 6.185/m²
1602BG Enkhuizen
€ 425.000 k.k.
€ 3.195/m²
Get free quotes from realtors with local market knowledge in Enkhuizen.
Selling a home in Enkhuizen? Compare real estate agents who know the local housing market. Also check out all real estate agents in Enkhuizen or the top 10 real estate agents in Enkhuizen for extra context for your choice.
By comparing brokers and requesting quotes
Short answers about housing prices, sold homes and comparing real estate agents in Enkhuizen.
The costs of a real estate agent in Enkhuizen vary per office, property type and sales approach. Therefore, compare multiple quotes and also look at the real estate agents in Enkhuizen to better compare rates, presentation and local experience.
On this page we currently show 181 sold houses in Enkhuizen from our selection. This helps you to better assess recent transactions and the local housing market.
Houses sold in Enkhuizen give insight into asking prices, house types and neighborhoods where recent transactions have taken place. Compare this also with the current housing stock in Enkhuizen to better understand the market.
You can use sold homes as a first market indication, but a local real estate agent can better take into account finishing, location, maintenance and current demand in Enkhuizen.
Compare realtors in Enkhuizen on local sales experience, reviews, expected yield, commission and marketing approach. The top 10 realtors in Enkhuizen helps to quickly discover strong offices.
View current location data on residents, WOZ development, housing stock, energy consumption, business activity and safety in Enkhuizen. In 2026 were there 18.738 residents. The average WOZ value in 2025 is EUR 332.000.
These figures help to better assess and compare the housing stock in Enkhuizen with recent sold homes. Orient yourself then on suitable top real estate agents in Enkhuizen for sales advice in this region.
Residents
18.738
Last year: 2026
Average WOZ
EUR 332.000
Last year: 2025
Average income per person.
EUR 32.100
Source: AllNumbers
Crimes (current year)
787
Total registered
| Year | Residents |
|---|---|
| 2022 | 18.620 |
| 2023 | 18.885 |
| 2024 | 18.895 |
| 2025 | 18.847 |
| 2026 | 18.738 |
| Year | Average WOZ |
|---|---|
| 2021 | EUR 243.000 |
| 2022 | EUR 269.000 |
| 2023 | EUR 320.000 |
| 2024 | EUR 321.000 |
| 2025 | EUR 332.000 |
Hoger
25
Praktisch
31
Middelbaar
45
Europa
1.836
Nederland
15.067
Buiten Europa
1.944
Label C
2.314
Label A
2.268
Label B
1.849
Label G
992
Label D
576
Label F
572
Label E
264
Label A+
160
Label A+++
157
Label A++
47
Label A++++
28
Label A+++++
1
| Year | Gas (m3) | Electricity (kWh) |
|---|---|---|
| 2020 | 1.100 | 2.650 |
| 2021 | 1.270 | 2.690 |
| 2022 | 1.000 | 2.510 |
| 2023 | 860 | 2.350 |
| 2024 | 840 | 2.380 |
Hoekwoning
Gas: 980 • Electricity: 2.500
Huurwoning
Gas: 690 • Electricity: 1.870
Koopwoning
Gas: 970 • Electricity: 2.650
Appartement
Gas: 590 • Electricity: 1.690
Tussenwoning
Gas: 860 • Electricity: 2.410
Vrijstaande woning
Gas: 1.280 • Electricity: 3.360
Twee-onder-één-kap woning
Gas: 1.020 • Electricity: 2.740
Total number of company establishments: 2.550
| Period | Crimes |
|---|---|
| jan 2025 | 69 |
| jan 2026 | 66 |
| jul 2025 | 68 |
| jun 2025 | 51 |
| mei 2025 | 66 |
| mrt 2025 | 71 |
| nov 2024 | 55 |
| nov 2025 | 52 |
| okt 2024 | 63 |
| okt 2025 | 63 |
| sep 2024 | 64 |
| sep 2025 | 69 |
These figures give an indicative picture of safety trends in the living environment of Enkhuizen.
Short answers based on current local statistics, handy for a quick comparison of the living environment.
Enkhuizen telt in 2026 ongeveer 18.738 inwoners.
De gemiddelde WOZ-waarde in Enkhuizen is in 2025 circa € 332.000.
Het gemiddelde inkomen per inwoner in Enkhuizen ligt rond € 32.100 per jaar.
Voor het huidige jaar gaat het om ongeveer 787 geregistreerde misdrijven. Gebruik deze cijfers als indicatie en vergelijk trends per periode.
In Enkhuizen komt vooral "Tussenwoningen" veel voor, met ongeveer 3.365 woningen.